| Param | Original file | Final file |
|---|---|---|
| Filename | modeM0/AS1T03_255T01_9000003922_27351cztM0_level2.evt | modeM0/AS1T03_255T01_9000003922_27351cztM0_level2_quad_clean.evt |
| Size (bytes) | 1,445,630,400 | 214,392,960 |
| Size | 1.3 GB | 204.5 MB |
| Events in quadrant A | 8,794,863 | 1,362,965 |
| Events in quadrant B | 10,545,753 | 1,306,153 |
| Events in quadrant C | 11,331,393 | 1,271,572 |
| Events in quadrant D | 11,857,725 | 1,274,532 |
| Mode M9 | |||
|---|---|---|---|
| Quadrant | BADHDUFLAG | Total packets | Discarded packets |
| A | 0 | 18 | 0 |
| B | 0 | 18 | 0 |
| C | 0 | 18 | 0 |
| D | 0 | 18 | 0 |
| Mode M0 | |||
|---|---|---|---|
| Quadrant | BADHDUFLAG | Total packets | Discarded packets |
| A | 0 | 37832 | 0 |
| B | 0 | 42874 | 0 |
| C | 0 | 45329 | 0 |
| D | 0 | 47655 | 0 |
| Quadrant | Total seconds | Saturated seconds | Saturation percentage |
|---|---|---|---|
| A | 18537 | 107 | 0.577224% |
| B | 18537 | 880 | 4.747262% |
| C | 18537 | 842 | 4.542267% |
| D | 18537 | 501 | 2.702703% |
Noise dominated data is calculated using 1-second bins in cleaned event files. If a bin has >2000 counts, and if more than 50% of those come from <1% of pixels, then it is considered to be noise-dominated and hence unusable.
| Quadrant | # 1 sec bins | Bins with >0 counts | Bins with >2000 counts | High rate bins dominated by noise | Noise dominated (total time) | Noise dominated (detector-on time) | Marked lightcurve |
|---|---|---|---|---|---|---|---|
| A | 20322 | 18540 | 7 | 7 | 0.03% | 0.04% | 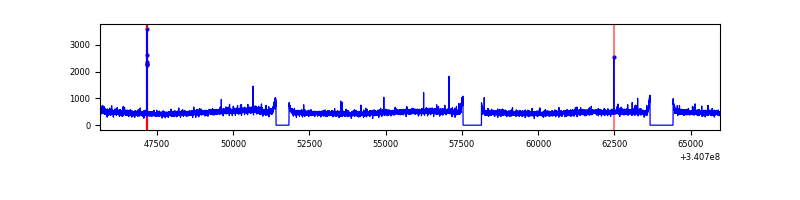 |
| B | 20322 | 18539 | 590 | 590 | 2.90% | 3.18% | 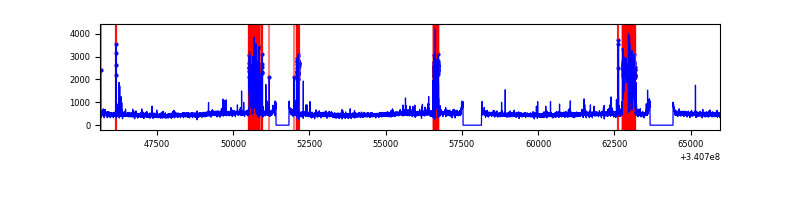 |
| C | 20322 | 18539 | 485 | 485 | 2.39% | 2.62% | 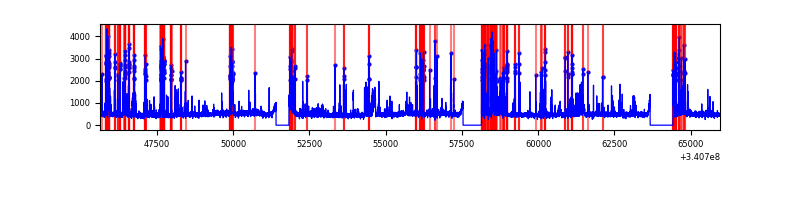 |
| D | 20322 | 18540 | 350 | 350 | 1.72% | 1.89% | 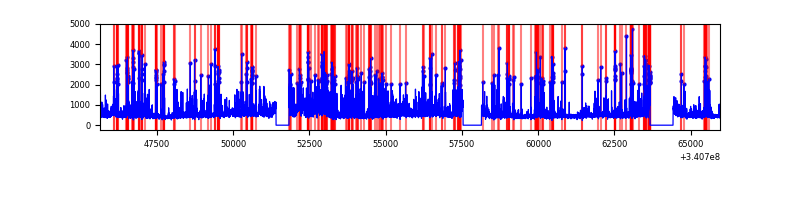 |
Top three noisy pixels from each quadrant. If the there are fewer than three noisy pixels in the level2.evt file, extra rows are filled as -1
| Pixel properties | Quadrant properties | ||||||
|---|---|---|---|---|---|---|---|
| Quadrant | DetID | PixID | Counts | Sigma | Mean | Median | Sigma |
| A | 13 | 254 | 32886 | 67.45 | 2259 | 2215 | 454.7 |
| A | 12 | 189 | 28549 | 57.91 | 2259 | 2215 | 454.7 |
| A | 15 | 174 | 23660 | 47.16 | 2259 | 2215 | 454.7 |
| B | 5 | 172 | 1725205 | 4126.6 | 2190 | 2135 | 417.6 |
| B | 0 | 190 | 76335 | 177.7 | 2190 | 2135 | 417.6 |
| B | 12 | 111 | 51118 | 117.31 | 2190 | 2135 | 417.6 |
| C | 2 | 16 | 2538309 | 5103.66 | 2112 | 2127 | 496.9 |
| C | 14 | 238 | 335088 | 670.03 | 2112 | 2127 | 496.9 |
| C | 15 | 208 | 191937 | 381.96 | 2112 | 2127 | 496.9 |
| D | 1 | 52 | 2676512 | 5044.34 | 2141 | 2091 | 530.2 |
| D | 2 | 250 | 581277 | 1092.43 | 2141 | 2091 | 530.2 |
| D | 11 | 176 | 229773 | 429.44 | 2141 | 2091 | 530.2 |
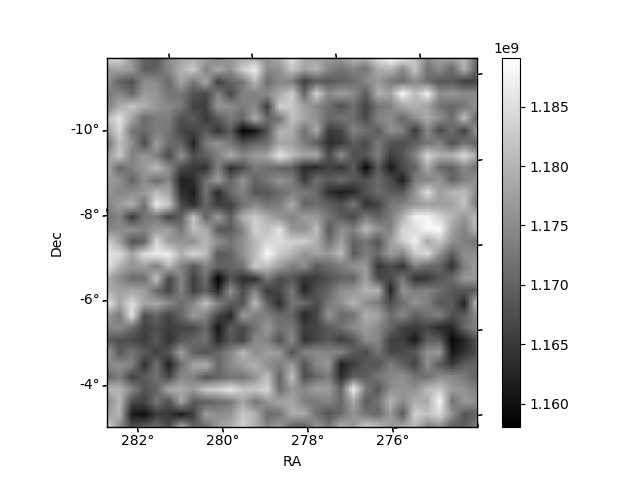
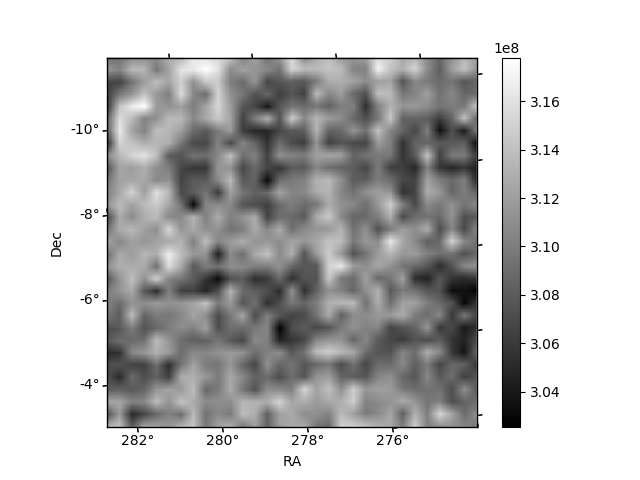
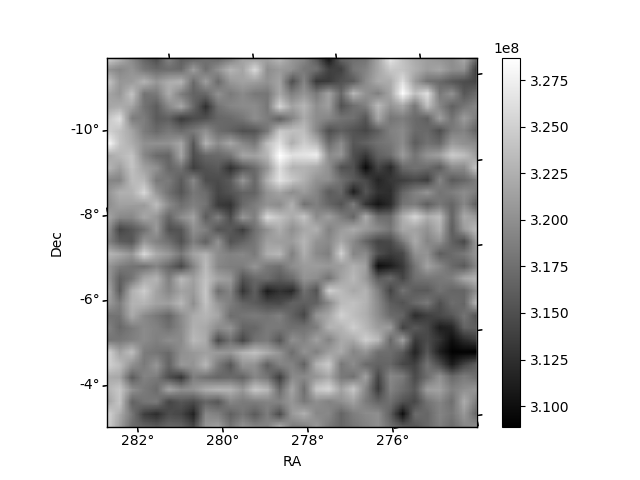
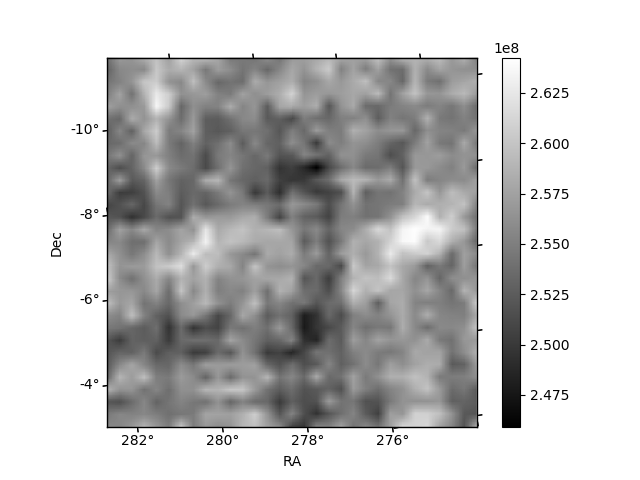
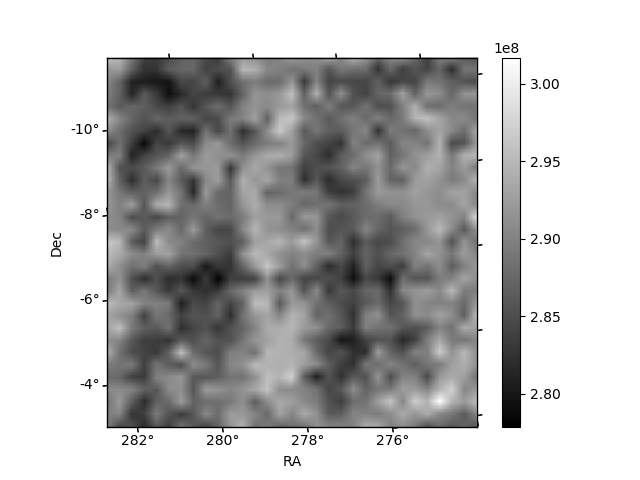
Histogram calculated using DETX and DETY for each event in the final _common_clean file
| Quadrant A | 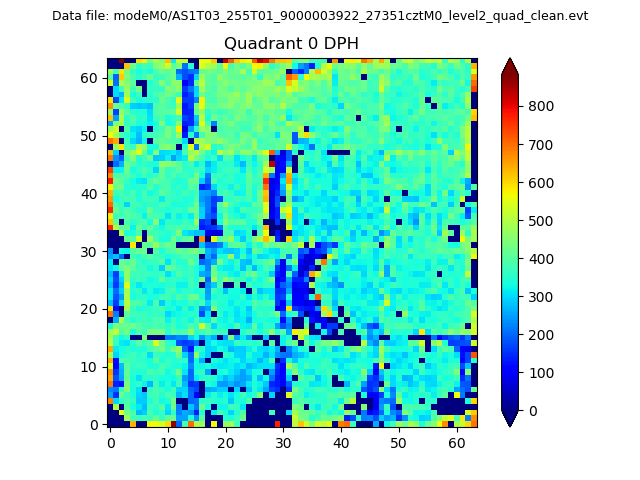 |
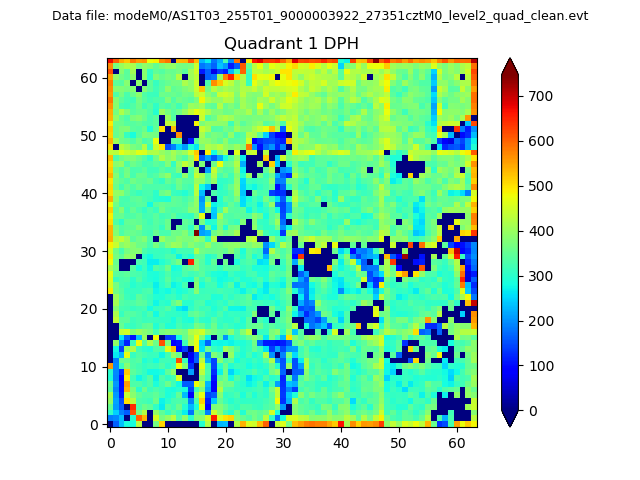 |
Quadrant B |
|---|---|---|---|
| Quadrant D |  |
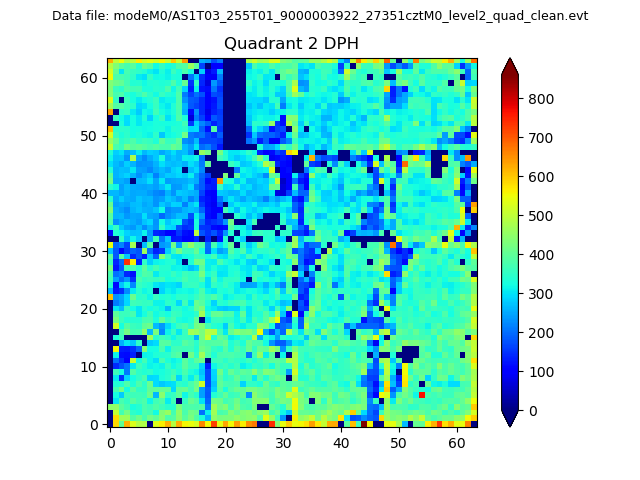 |
Quadrant C |
| Plot type | Count rate plots | Images |
|---|---|---|
| Comparison with Poisson distribution Blue bars denote a histogram of data divided into 1 sec bins. Red curve is a Poisson curve with rate = median count rate of data. |
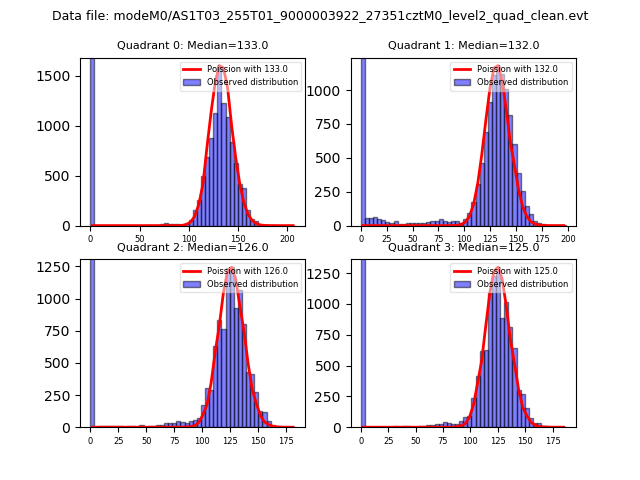 |
 |
| Quadrant-wise count rates Data is divided into 100 sec bins |
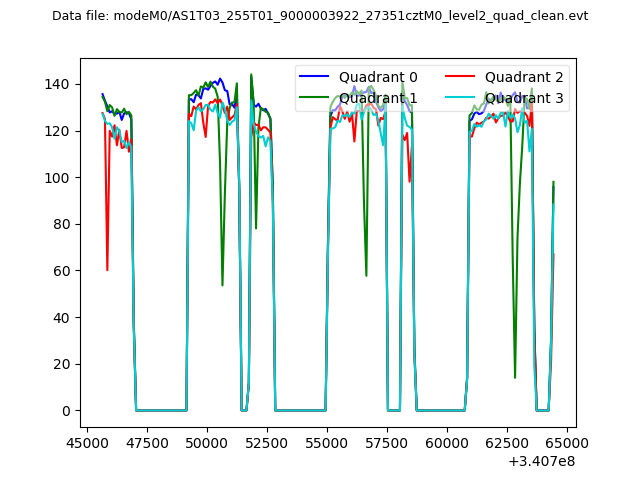 |
|
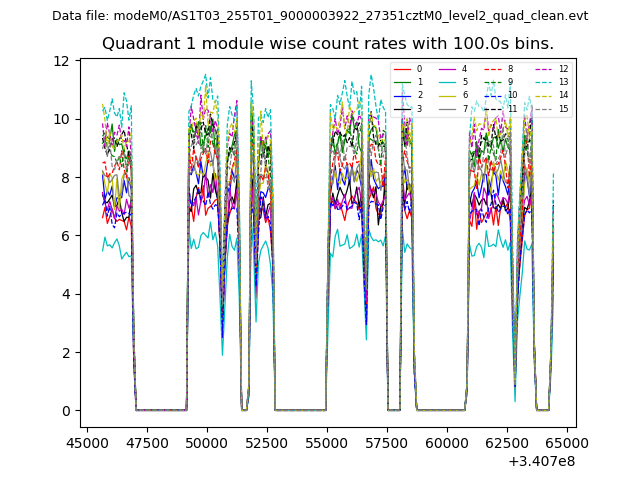
| Module-wise count rates for Quadrant A Data is divided into 100 sec bins |
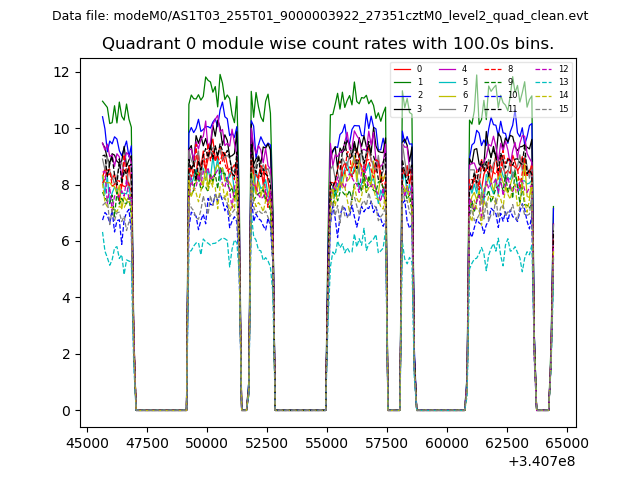 |
 |
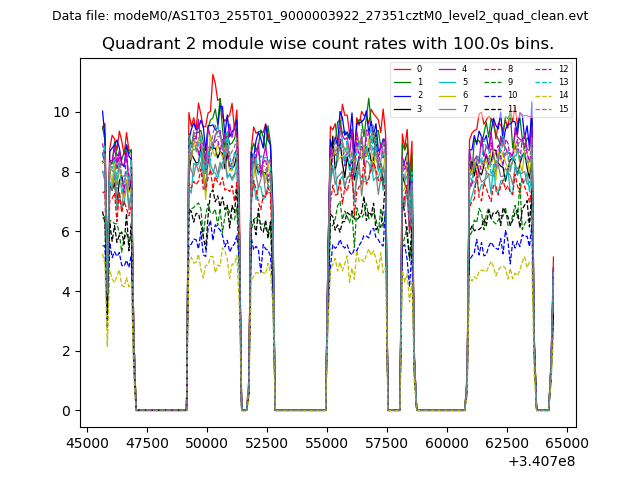
| Module-wise count rates for Quadrant B Data is divided into 100 sec bins |
 |
 |
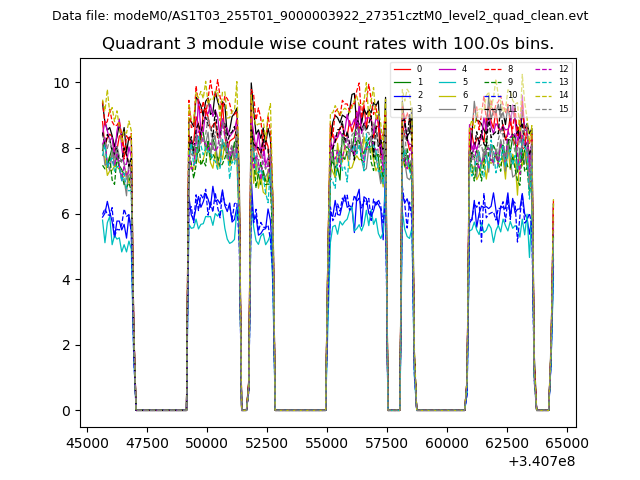
| Module-wise count rates for Quadrant C Data is divided into 100 sec bins |
 |
 |
| Module-wise count rates for Quadrant D Data is divided into 100 sec bins |
 |
 |
| Parameter | Plot |
|---|---|
| CZT HV Monitor | 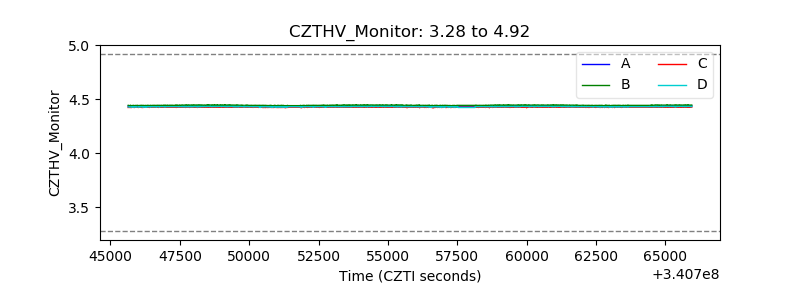 |
| D_VDD | 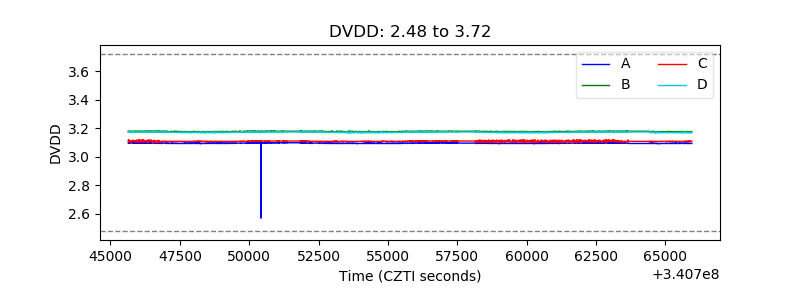 |
| Temperature 1 | 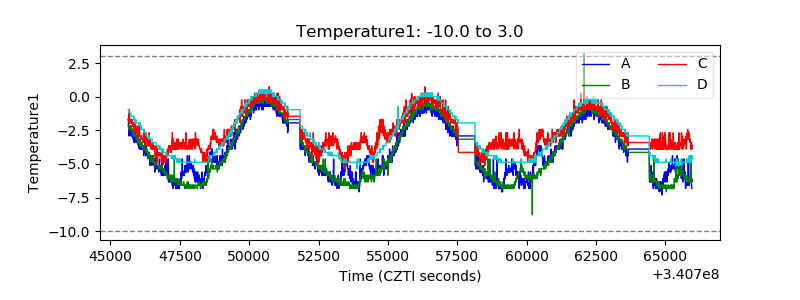 |
| Veto HV Monitor | 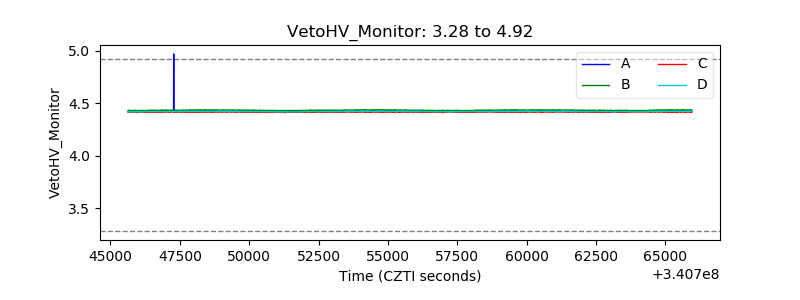 |
| Veto LLD | 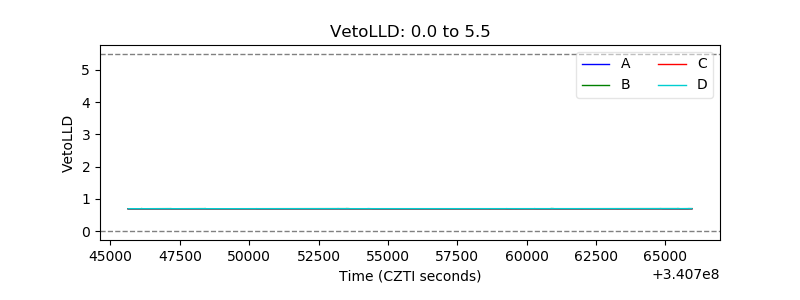 |
| Alpha Counter | 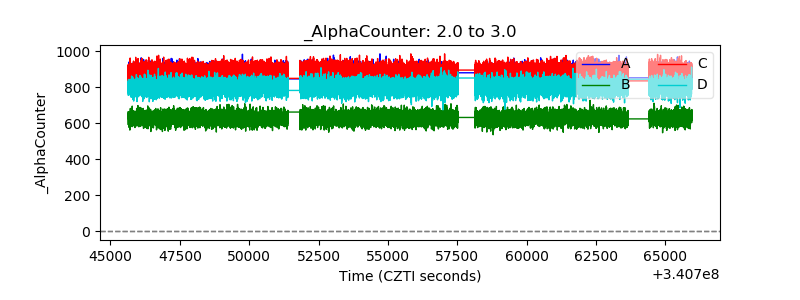 |
| _CPM_Rate | 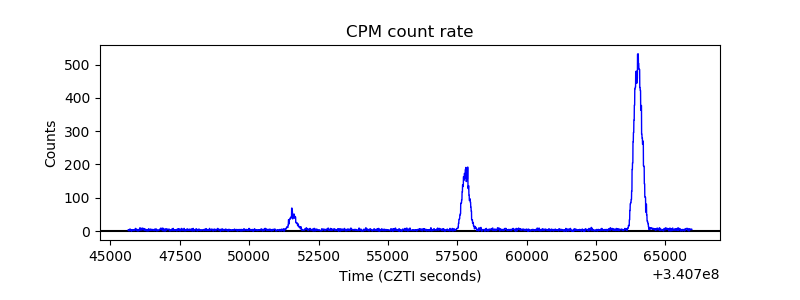 |
| CZT Counter | 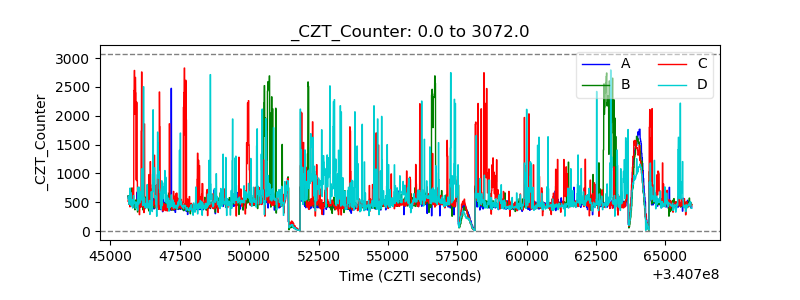 |
| +2.5 Volts monitor | 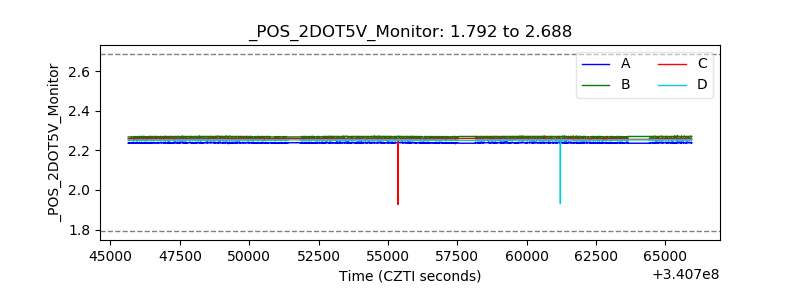 |
| +5 Volts monitor |  |
| _ROLL_ROT | 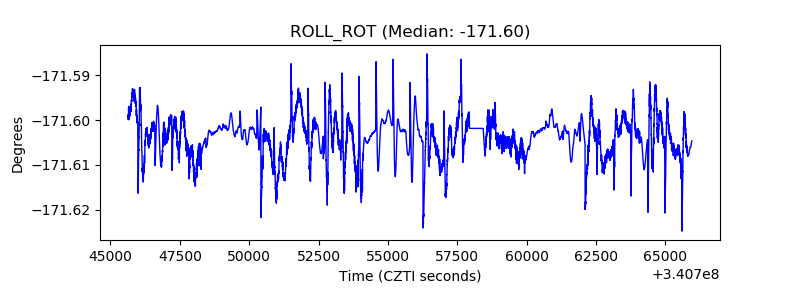 |
| _Roll_DEC | 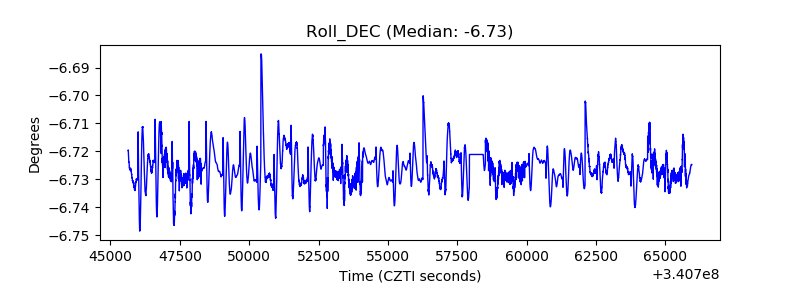 |
| _Roll_RA | 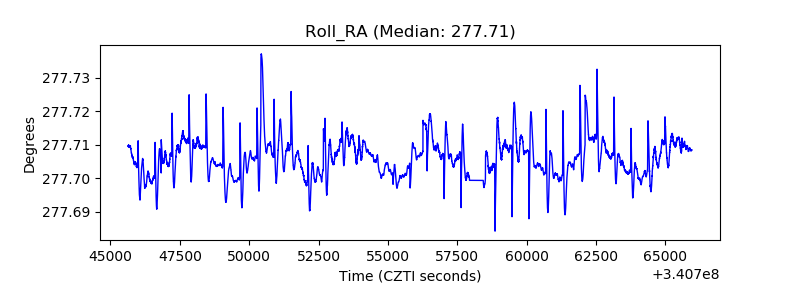 |
| Veto Counter | 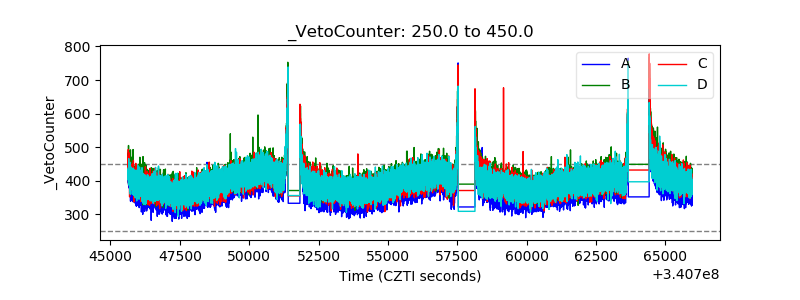 |