| Param | Original file | Final file |
|---|---|---|
| Filename | modeM0/AS1T03_255T01_9000003922_27352cztM0_level2.evt | modeM0/AS1T03_255T01_9000003922_27352cztM0_level2_quad_clean.evt |
| Size (bytes) | 514,512,000 | 70,012,800 |
| Size | 490.7 MB | 66.8 MB |
| Events in quadrant A | 3,311,528 | 426,047 |
| Events in quadrant B | 3,408,788 | 429,966 |
| Events in quadrant C | 4,621,735 | 389,319 |
| Events in quadrant D | 3,776,898 | 398,946 |
| Mode M9 | |||
|---|---|---|---|
| Quadrant | BADHDUFLAG | Total packets | Discarded packets |
| A | 0 | 17 | 0 |
| B | 0 | 17 | 0 |
| C | 0 | 17 | 0 |
| D | 0 | 17 | 0 |
| Mode M0 | |||
|---|---|---|---|
| Quadrant | BADHDUFLAG | Total packets | Discarded packets |
| A | 0 | 14019 | 0 |
| B | 0 | 14192 | 0 |
| C | 0 | 17986 | 0 |
| D | 0 | 15746 | 0 |
| Quadrant | Total seconds | Saturated seconds | Saturation percentage |
|---|---|---|---|
| A | 6823 | 57 | 0.835410% |
| B | 6824 | 77 | 1.128370% |
| C | 6824 | 493 | 7.224502% |
| D | 6824 | 100 | 1.465416% |
Noise dominated data is calculated using 1-second bins in cleaned event files. If a bin has >2000 counts, and if more than 50% of those come from <1% of pixels, then it is considered to be noise-dominated and hence unusable.
| Quadrant | # 1 sec bins | Bins with >0 counts | Bins with >2000 counts | High rate bins dominated by noise | Noise dominated (total time) | Noise dominated (detector-on time) | Marked lightcurve |
|---|---|---|---|---|---|---|---|
| A | 8498 | 6824 | 0 | 0 | 0.00% | 0.00% | 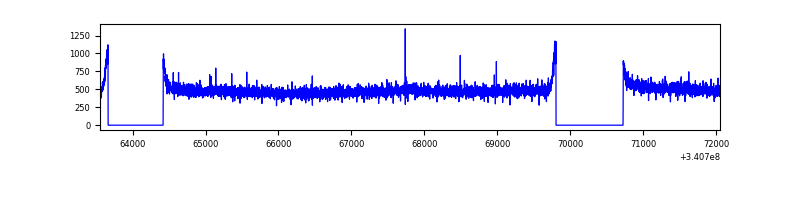 |
| B | 8499 | 6825 | 2 | 2 | 0.02% | 0.03% | 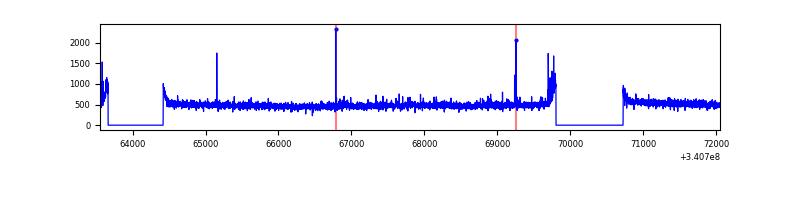 |
| C | 8499 | 6824 | 277 | 277 | 3.26% | 4.06% | 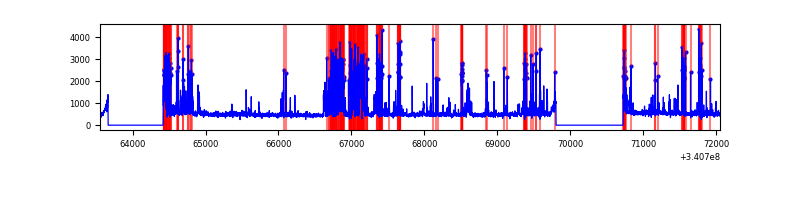 |
| D | 8499 | 6826 | 50 | 50 | 0.59% | 0.73% | 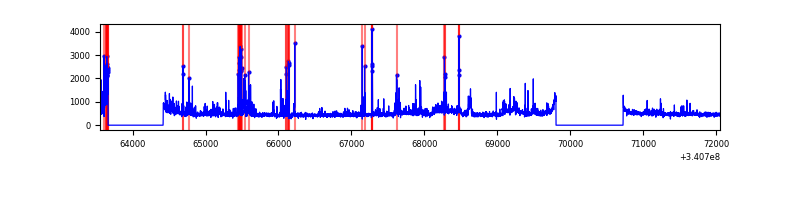 |
Top three noisy pixels from each quadrant. If the there are fewer than three noisy pixels in the level2.evt file, extra rows are filled as -1
| Pixel properties | Quadrant properties | ||||||
|---|---|---|---|---|---|---|---|
| Quadrant | DetID | PixID | Counts | Sigma | Mean | Median | Sigma |
| A | 13 | 254 | 11969 | 64.54 | 857 | 839 | 172.5 |
| A | 3 | 137 | 7969 | 41.34 | 857 | 839 | 172.5 |
| A | 0 | 226 | 7317 | 37.56 | 857 | 839 | 172.5 |
| B | 12 | 111 | 20057 | 116.66 | 856 | 836 | 164.8 |
| B | 11 | 111 | 17856 | 103.3 | 856 | 836 | 164.8 |
| B | 14 | 111 | 15928 | 91.6 | 856 | 836 | 164.8 |
| C | 2 | 16 | 1288769 | 6835.2 | 797 | 802 | 188.4 |
| C | 14 | 238 | 126354 | 666.3 | 797 | 802 | 188.4 |
| C | 15 | 208 | 98191 | 516.84 | 797 | 802 | 188.4 |
| D | 1 | 52 | 474117 | 2399.93 | 815 | 797 | 197.2 |
| D | 2 | 250 | 115194 | 580.04 | 815 | 797 | 197.2 |
| D | 11 | 176 | 68728 | 344.44 | 815 | 797 | 197.2 |
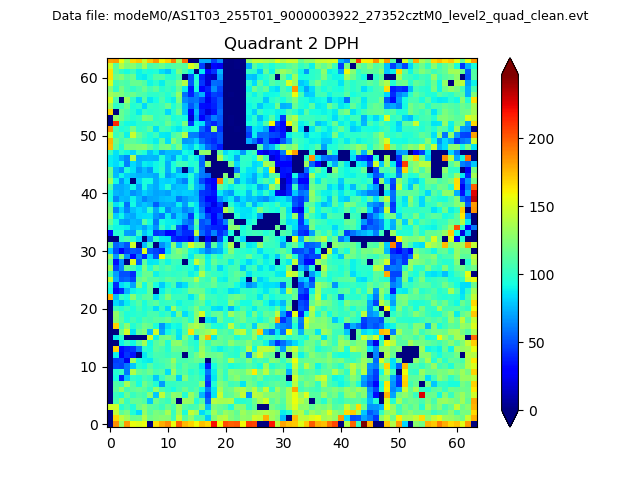
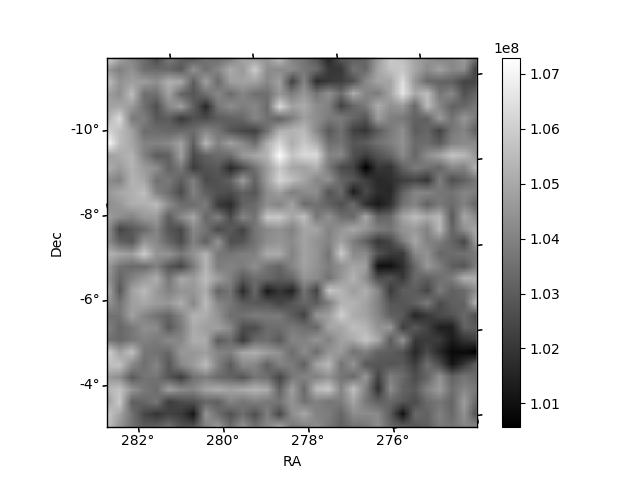
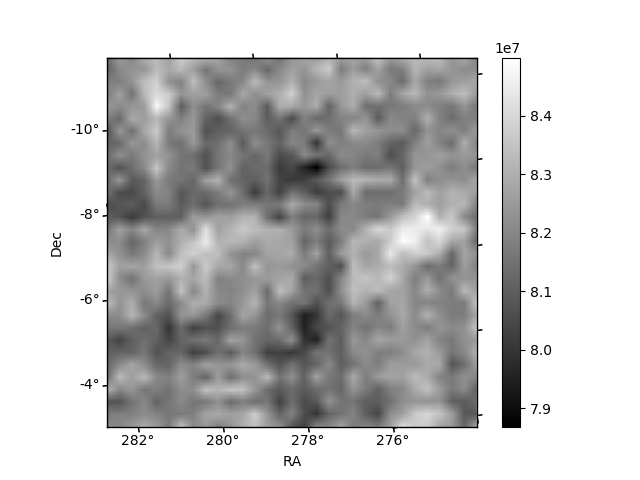
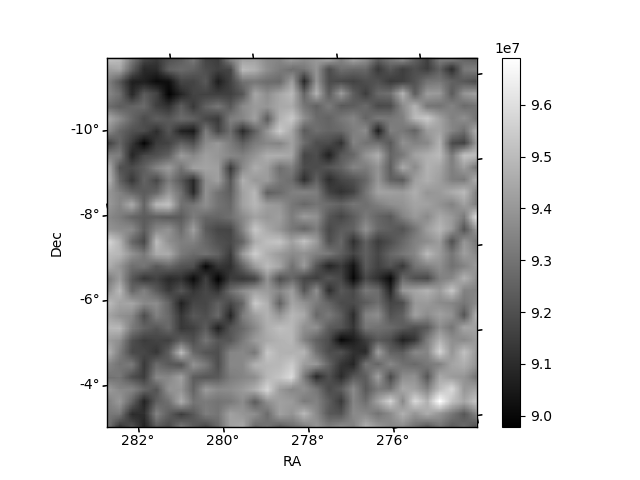
Histogram calculated using DETX and DETY for each event in the final _common_clean file
| Quadrant A |  |
 |
Quadrant B |
|---|---|---|---|
| Quadrant D | 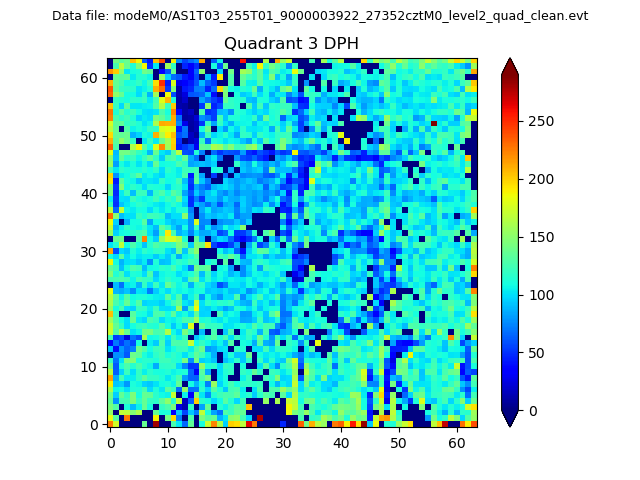 |
 |
Quadrant C |
| Plot type | Count rate plots | Images |
|---|---|---|
| Comparison with Poisson distribution Blue bars denote a histogram of data divided into 1 sec bins. Red curve is a Poisson curve with rate = median count rate of data. |
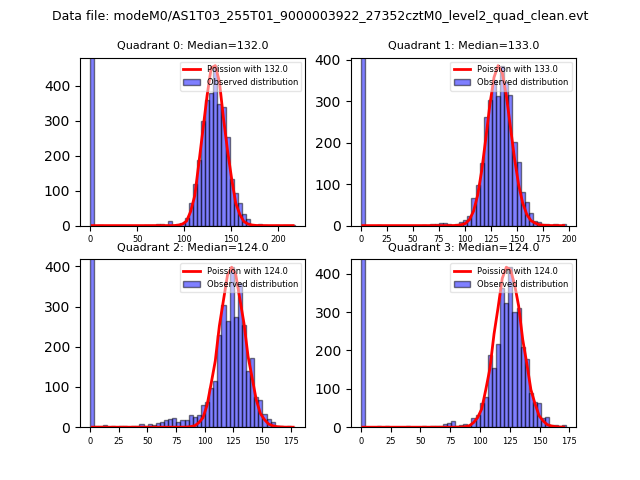 |
 |
| Quadrant-wise count rates Data is divided into 100 sec bins |
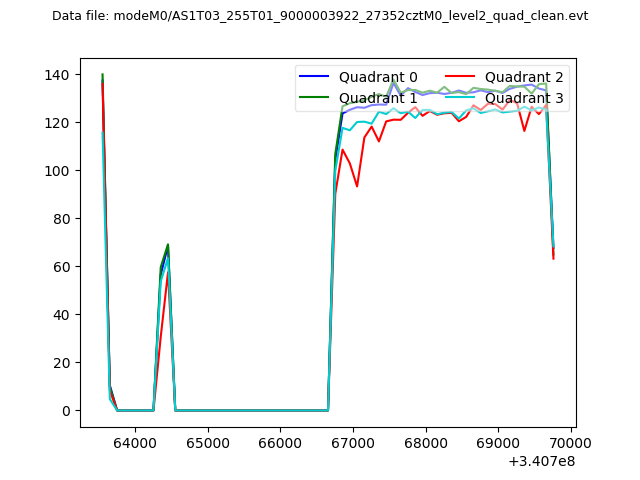 |
|
| Module-wise count rates for Quadrant A Data is divided into 100 sec bins |
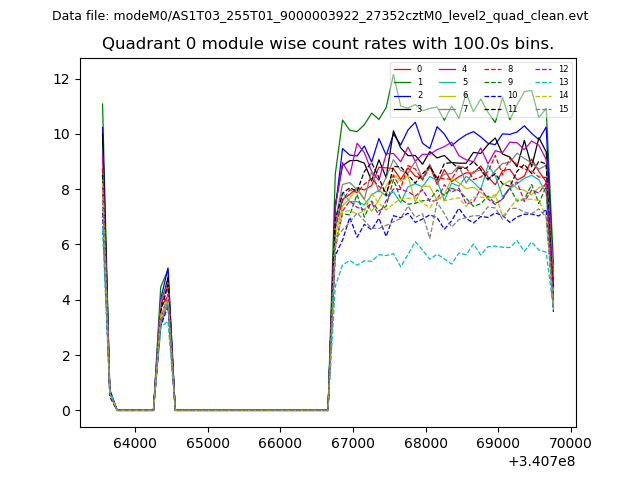 |
 |
| Module-wise count rates for Quadrant B Data is divided into 100 sec bins |
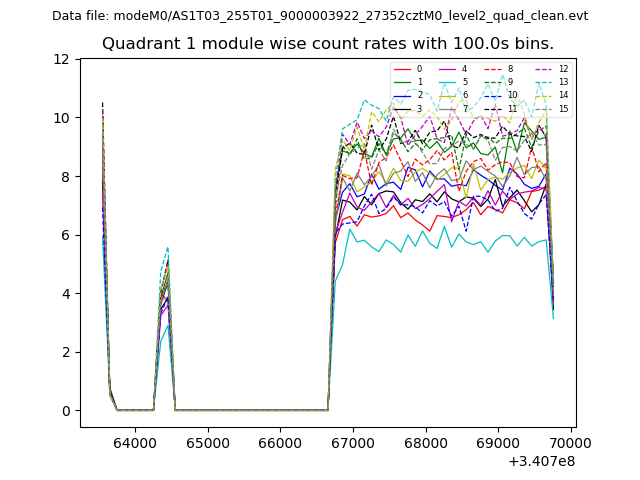 |
 |
| Module-wise count rates for Quadrant C Data is divided into 100 sec bins |
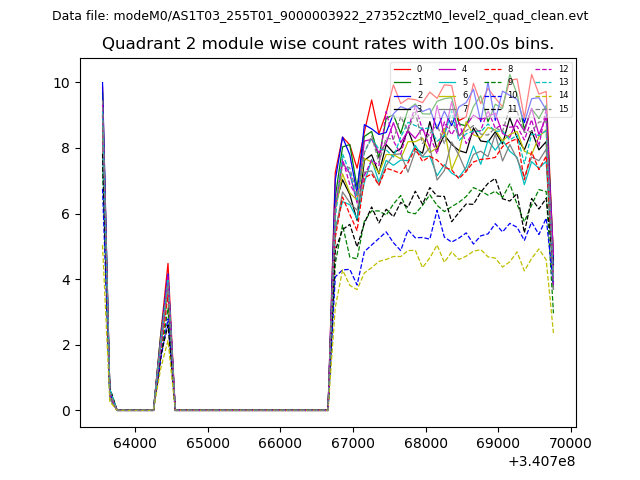 |
 |
| Module-wise count rates for Quadrant D Data is divided into 100 sec bins |
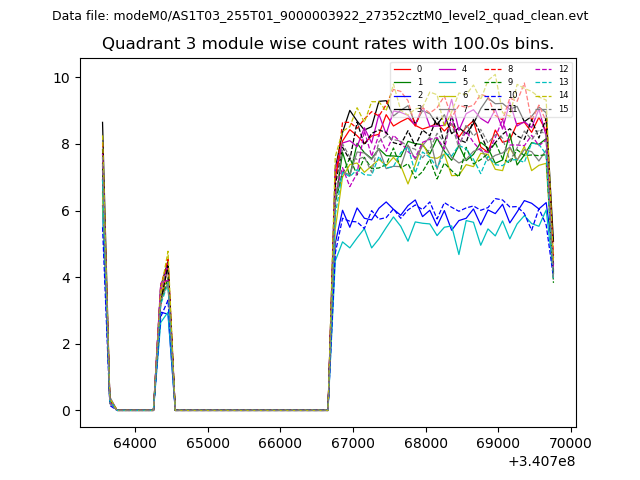 |
 |
| Parameter | Plot |
|---|---|
| CZT HV Monitor | 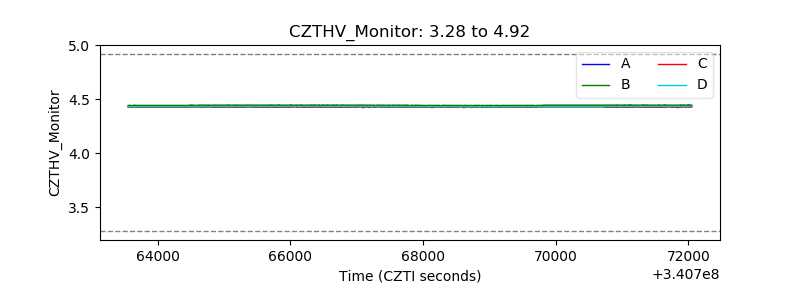 |
| D_VDD | 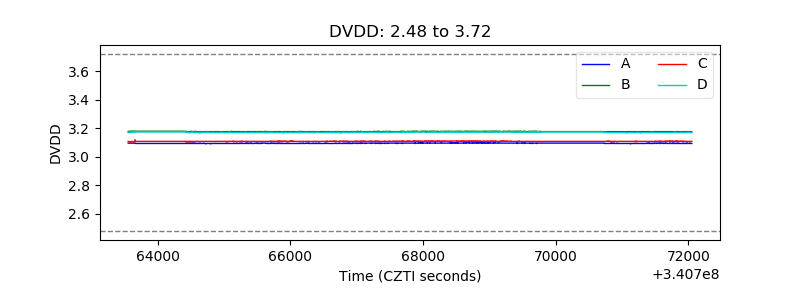 |
| Temperature 1 | 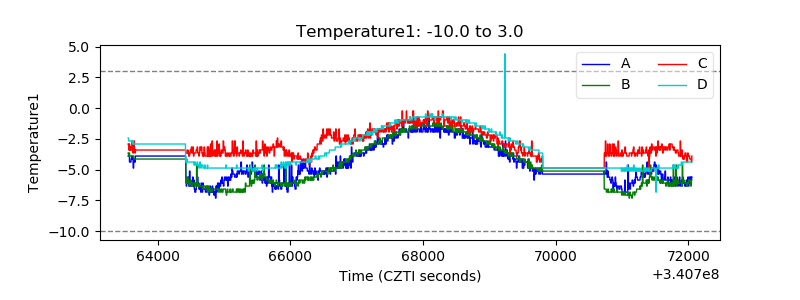 |
| Veto HV Monitor | 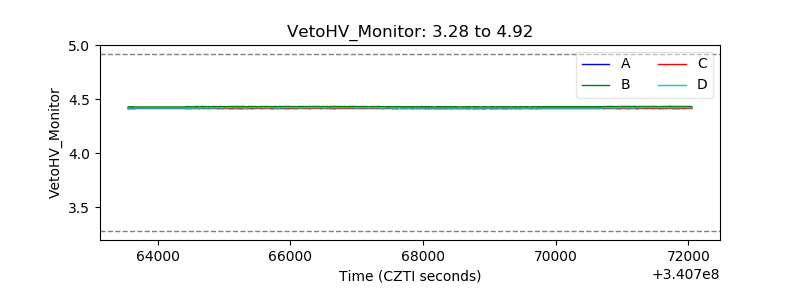 |
| Veto LLD | 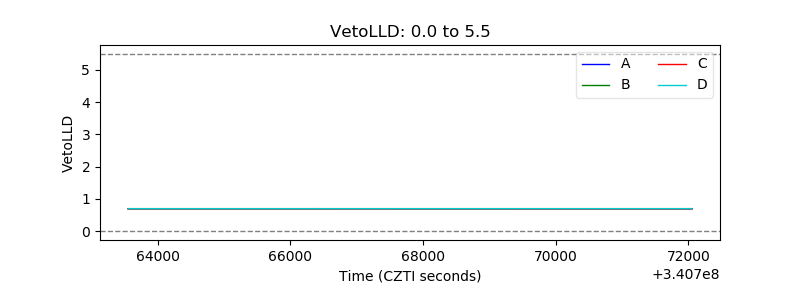 |
| Alpha Counter | 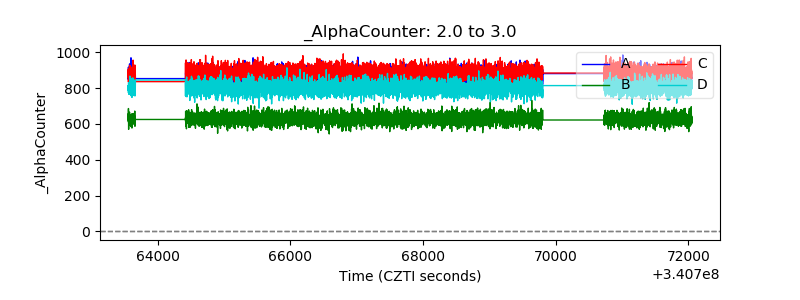 |
| _CPM_Rate | 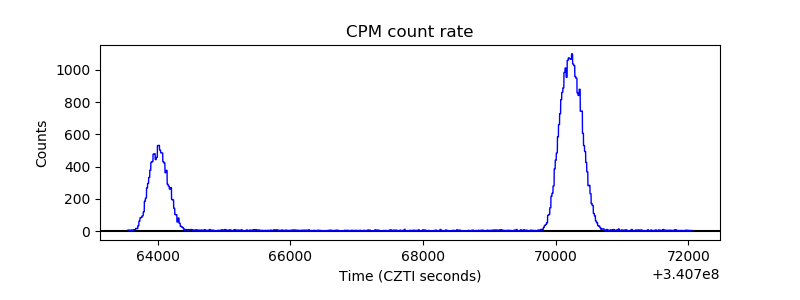 |
| CZT Counter | 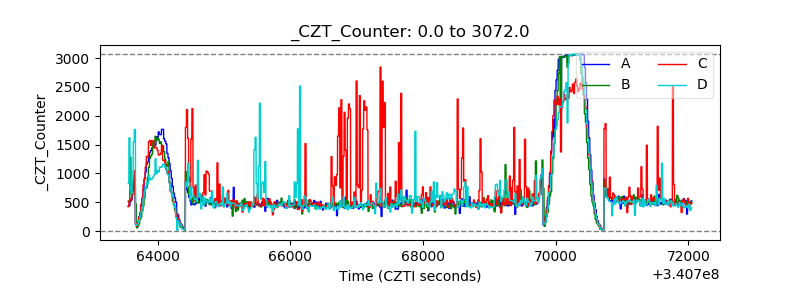 |
| +2.5 Volts monitor | 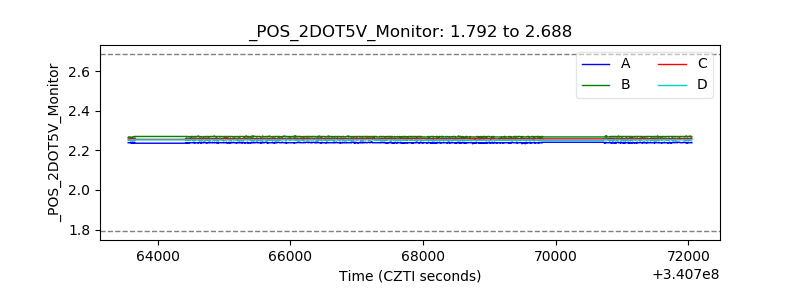 |
| +5 Volts monitor | 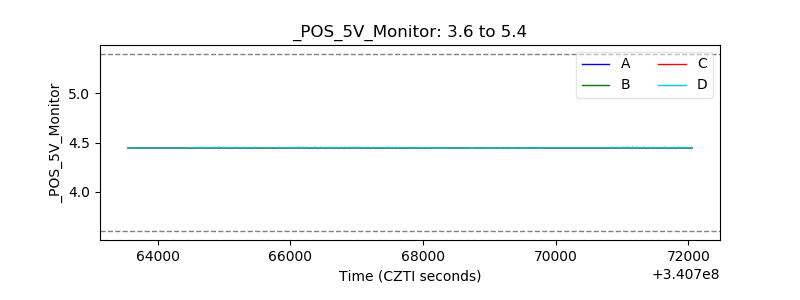 |
| _ROLL_ROT | 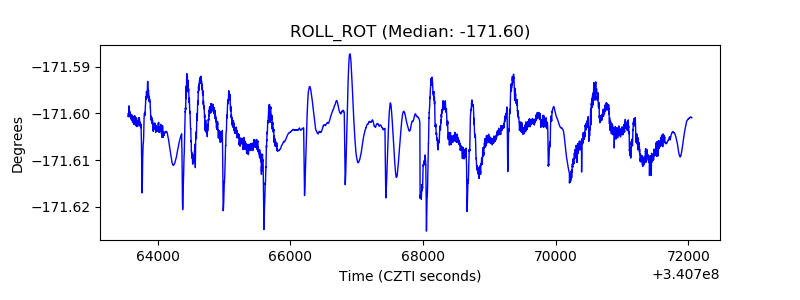 |
| _Roll_DEC | 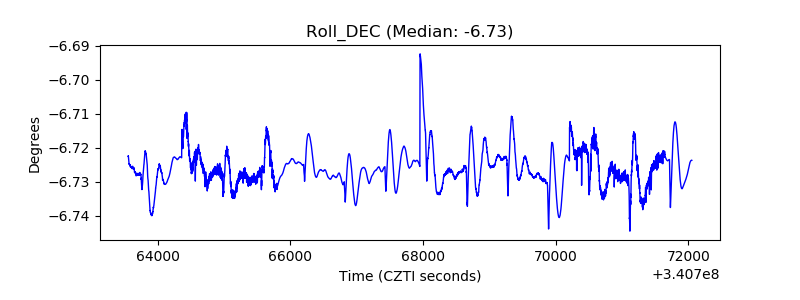 |
| _Roll_RA | 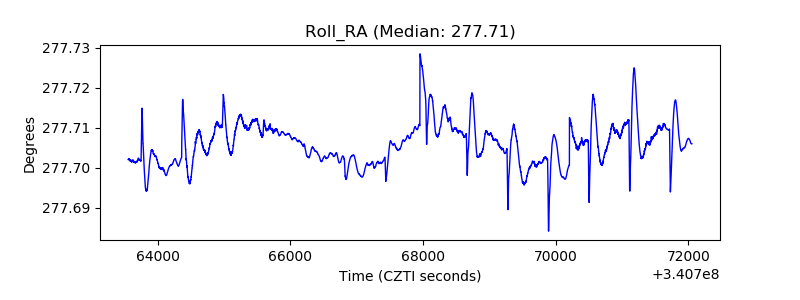 |
| Veto Counter | 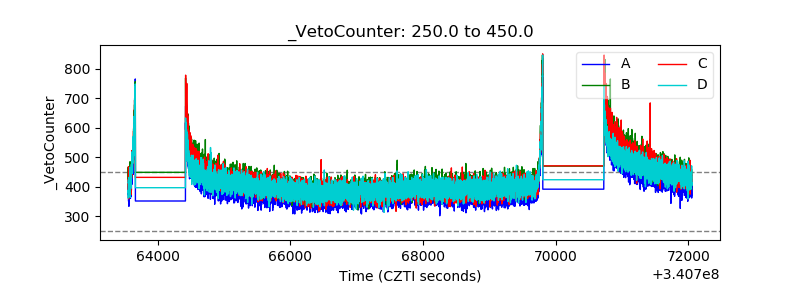 |