| Param | Original file | Final file |
|---|---|---|
| Filename | modeM0/AS1T03_255T01_9000003922_27353cztM0_level2.evt | modeM0/AS1T03_255T01_9000003922_27353cztM0_level2_quad_clean.evt |
| Size (bytes) | 478,592,640 | 72,581,760 |
| Size | 456.4 MB | 69.2 MB |
| Events in quadrant A | 3,276,476 | 449,465 |
| Events in quadrant B | 3,370,873 | 452,031 |
| Events in quadrant C | 3,877,469 | 423,230 |
| Events in quadrant D | 3,528,943 | 420,471 |
| Mode M9 | |||
|---|---|---|---|
| Quadrant | BADHDUFLAG | Total packets | Discarded packets |
| A | 0 | 12 | 0 |
| B | 0 | 13 | 0 |
| C | 0 | 13 | 0 |
| D | 0 | 13 | 0 |
| Mode M0 | |||
|---|---|---|---|
| Quadrant | BADHDUFLAG | Total packets | Discarded packets |
| A | 0 | 13633 | 0 |
| B | 0 | 13824 | 0 |
| C | 0 | 15644 | 0 |
| D | 0 | 14538 | 0 |
| Quadrant | Total seconds | Saturated seconds | Saturation percentage |
|---|---|---|---|
| A | 6494 | 50 | 0.769941% |
| B | 6494 | 75 | 1.154912% |
| C | 6493 | 267 | 4.112121% |
| D | 6493 | 60 | 0.924072% |
Noise dominated data is calculated using 1-second bins in cleaned event files. If a bin has >2000 counts, and if more than 50% of those come from <1% of pixels, then it is considered to be noise-dominated and hence unusable.
| Quadrant | # 1 sec bins | Bins with >0 counts | Bins with >2000 counts | High rate bins dominated by noise | Noise dominated (total time) | Noise dominated (detector-on time) | Marked lightcurve |
|---|---|---|---|---|---|---|---|
| A | 7539 | 6494 | 0 | 0 | 0.00% | 0.00% | 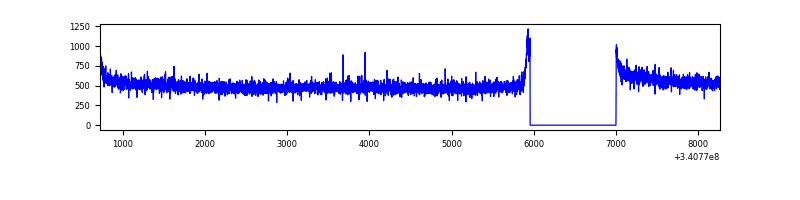 |
| B | 7539 | 6494 | 3 | 3 | 0.04% | 0.05% | 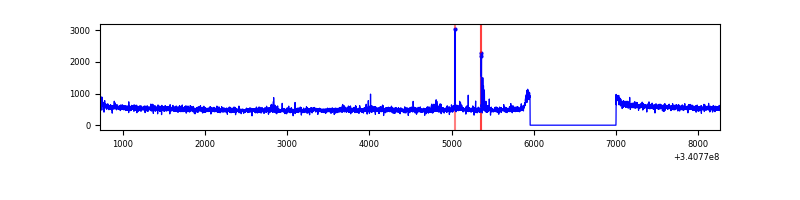 |
| C | 7538 | 6493 | 93 | 93 | 1.23% | 1.43% | 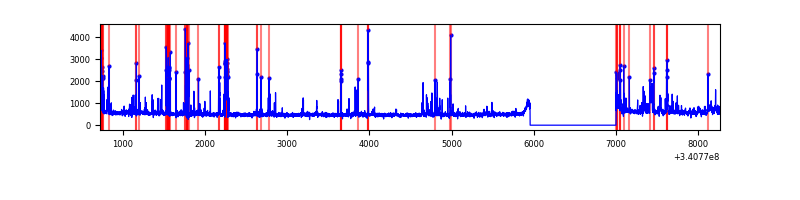 |
| D | 7538 | 6493 | 21 | 21 | 0.28% | 0.32% | 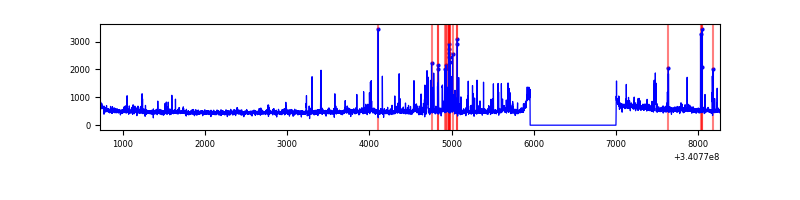 |
Top three noisy pixels from each quadrant. If the there are fewer than three noisy pixels in the level2.evt file, extra rows are filled as -1
| Pixel properties | Quadrant properties | ||||||
|---|---|---|---|---|---|---|---|
| Quadrant | DetID | PixID | Counts | Sigma | Mean | Median | Sigma |
| A | 13 | 254 | 11133 | 60.5 | 848 | 831 | 170.3 |
| A | 3 | 137 | 7603 | 39.77 | 848 | 831 | 170.3 |
| A | 0 | 226 | 7178 | 37.28 | 848 | 831 | 170.3 |
| B | 15 | 32 | 20118 | 120.24 | 843 | 823 | 160.5 |
| B | 12 | 111 | 18995 | 113.24 | 843 | 823 | 160.5 |
| B | 0 | 244 | 17145 | 101.71 | 843 | 823 | 160.5 |
| C | 2 | 16 | 566243 | 3031.22 | 795 | 798 | 186.5 |
| C | 14 | 238 | 128615 | 685.2 | 795 | 798 | 186.5 |
| C | 15 | 208 | 81080 | 430.37 | 795 | 798 | 186.5 |
| D | 1 | 52 | 326861 | 1698.54 | 808 | 789 | 192.0 |
| D | 2 | 250 | 116906 | 604.86 | 808 | 789 | 192.0 |
| D | 2 | 120 | 26882 | 135.92 | 808 | 789 | 192.0 |
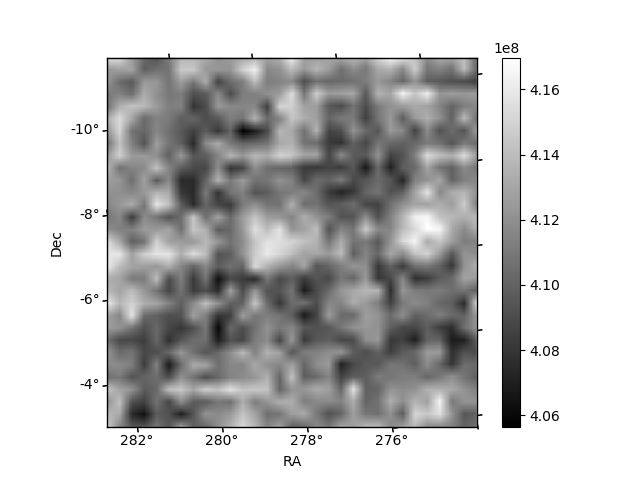
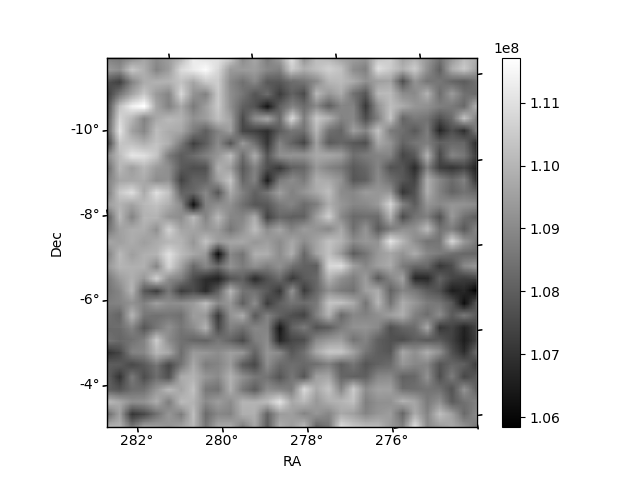
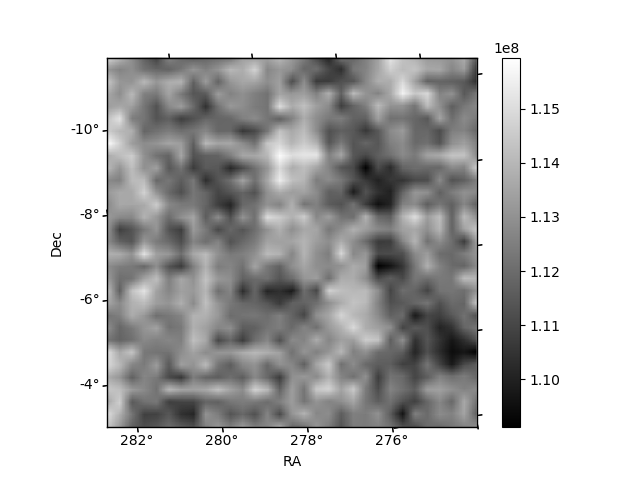
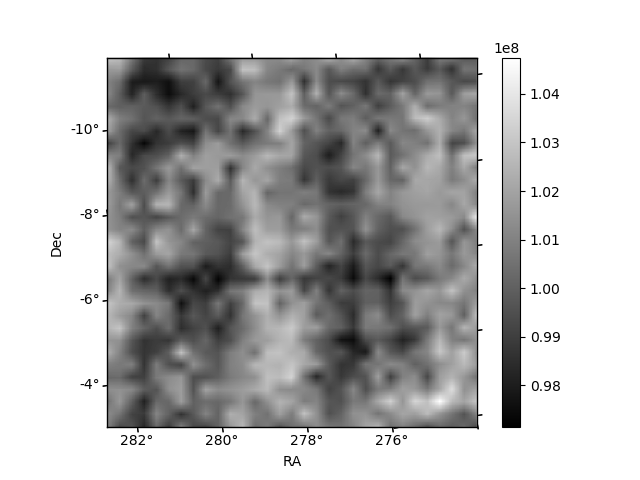
Histogram calculated using DETX and DETY for each event in the final _common_clean file
| Quadrant A | 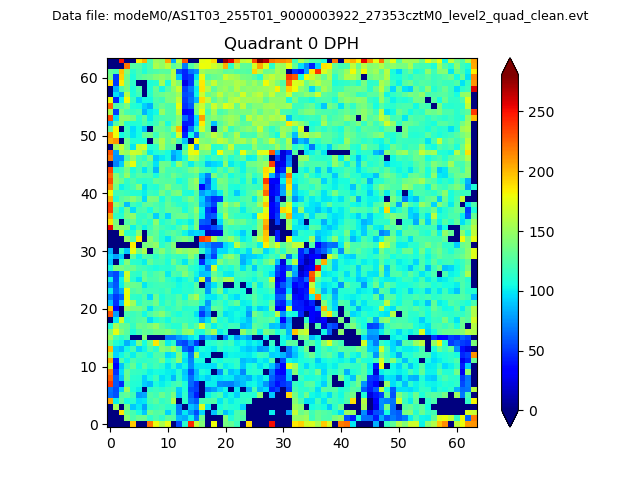 |
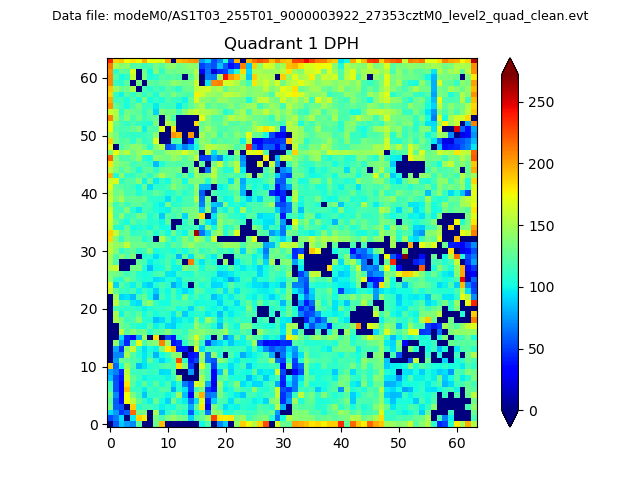 |
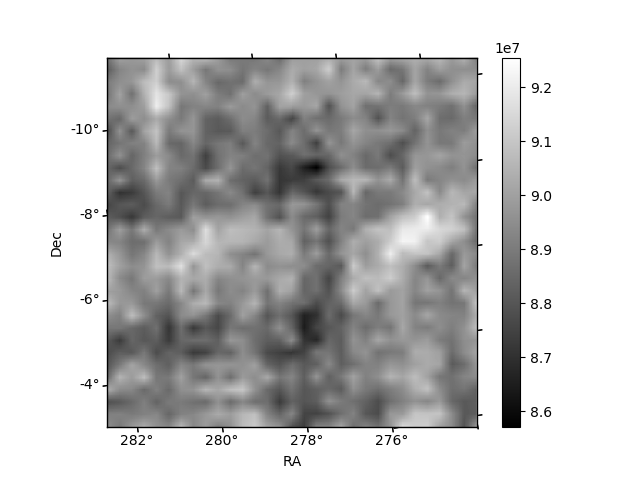
Quadrant B |
|---|---|---|---|
| Quadrant D | 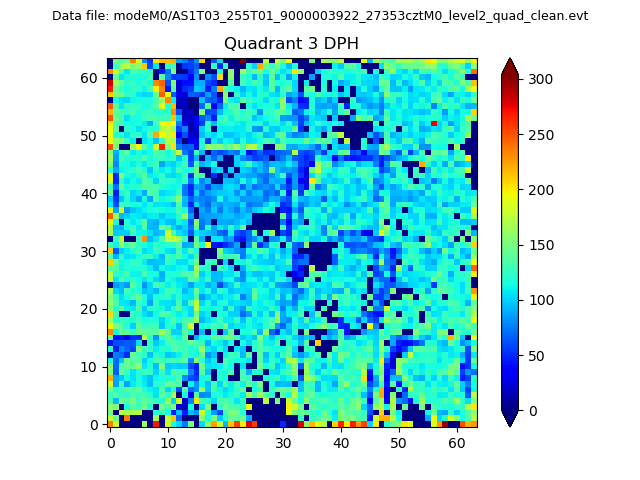 |
 |
Quadrant C |
| Plot type | Count rate plots | Images |
|---|---|---|
| Comparison with Poisson distribution Blue bars denote a histogram of data divided into 1 sec bins. Red curve is a Poisson curve with rate = median count rate of data. |
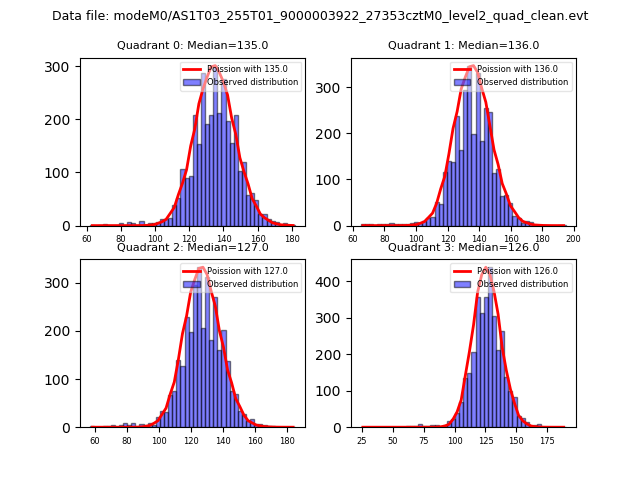 |
 |
| Quadrant-wise count rates Data is divided into 100 sec bins |
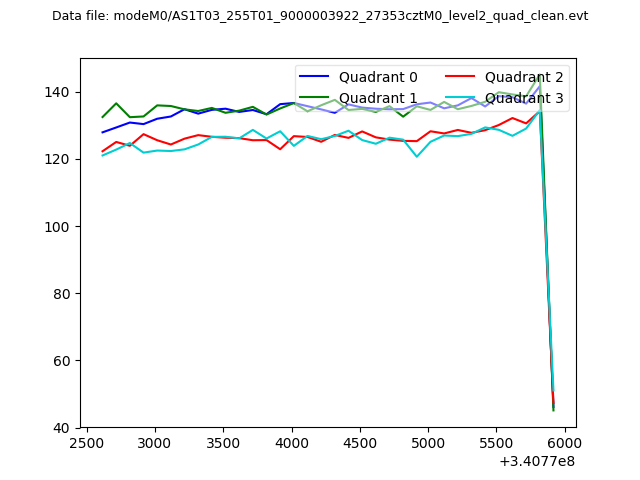 |
|
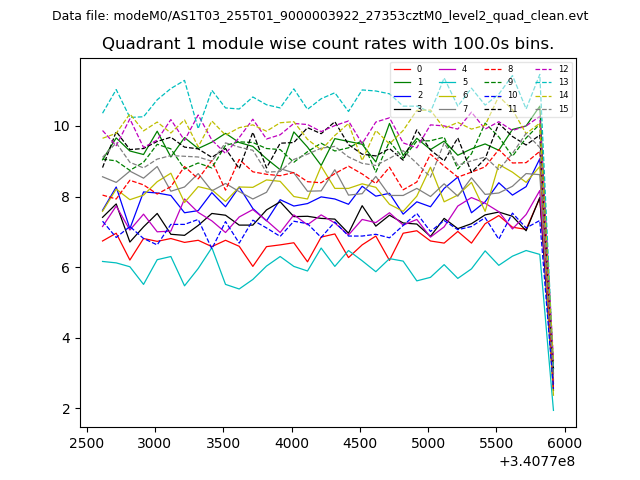
| Module-wise count rates for Quadrant A Data is divided into 100 sec bins |
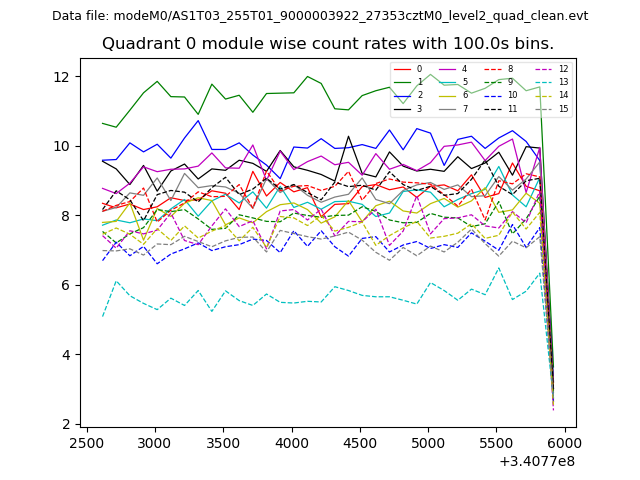 |
 |
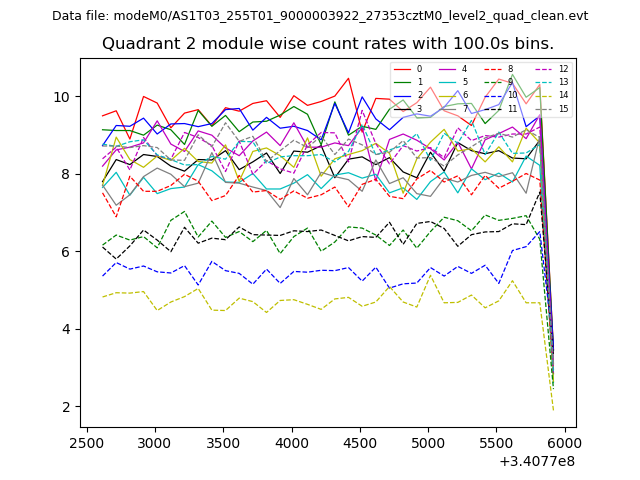
| Module-wise count rates for Quadrant B Data is divided into 100 sec bins |
 |
 |
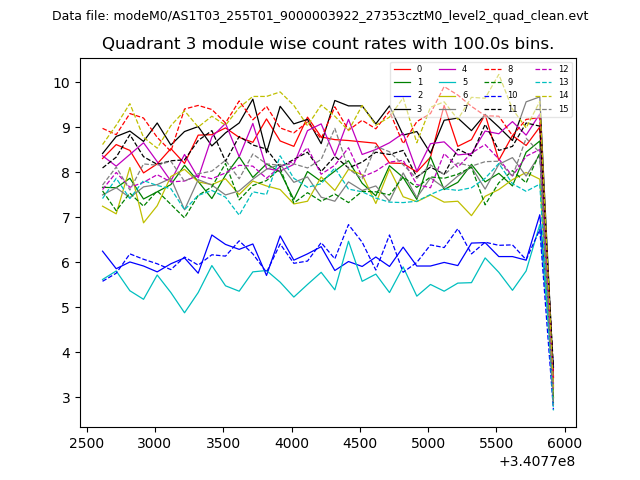
| Module-wise count rates for Quadrant C Data is divided into 100 sec bins |
 |
 |
| Module-wise count rates for Quadrant D Data is divided into 100 sec bins |
 |
 |
| Parameter | Plot |
|---|---|
| CZT HV Monitor | 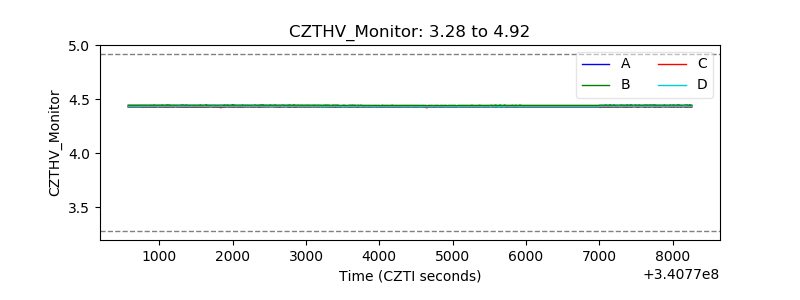 |
| D_VDD | 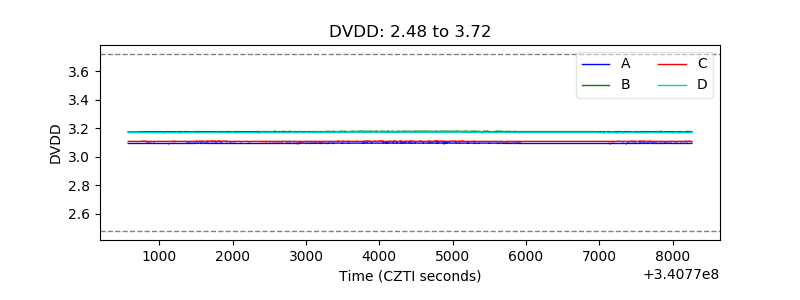 |
| Temperature 1 | 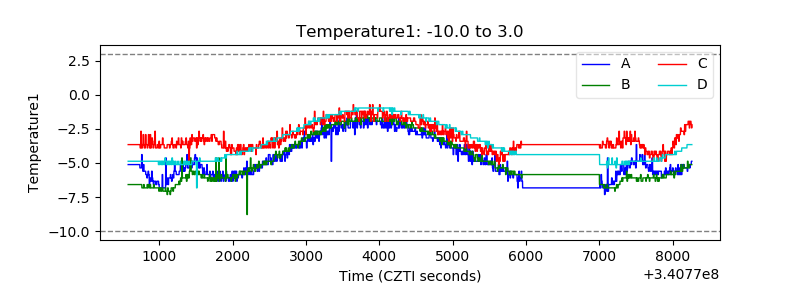 |
| Veto HV Monitor | 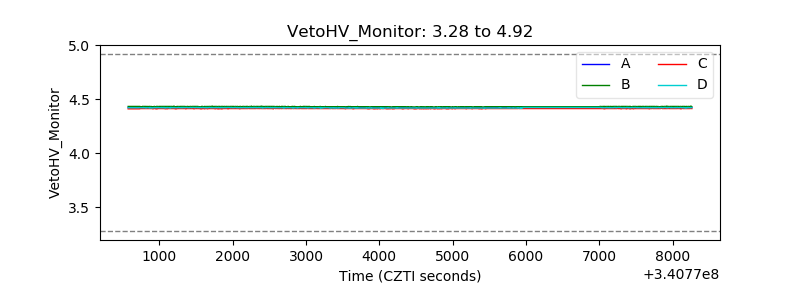 |
| Veto LLD | 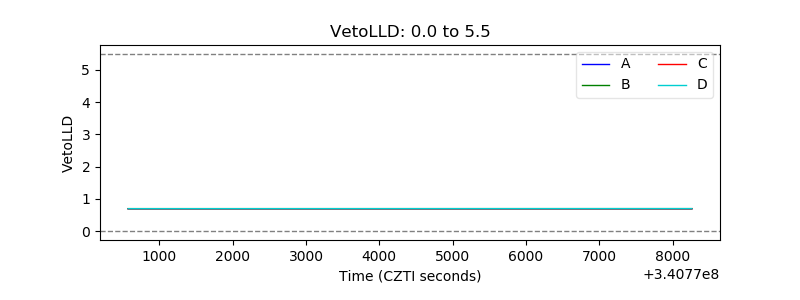 |
| Alpha Counter | 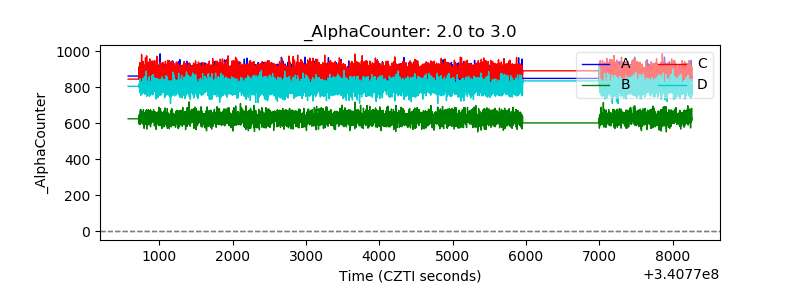 |
| _CPM_Rate | 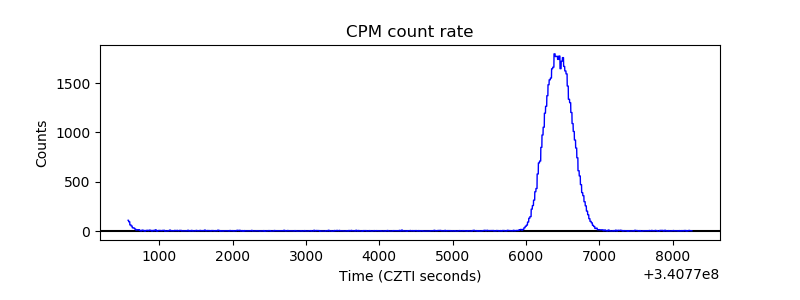 |
| CZT Counter | 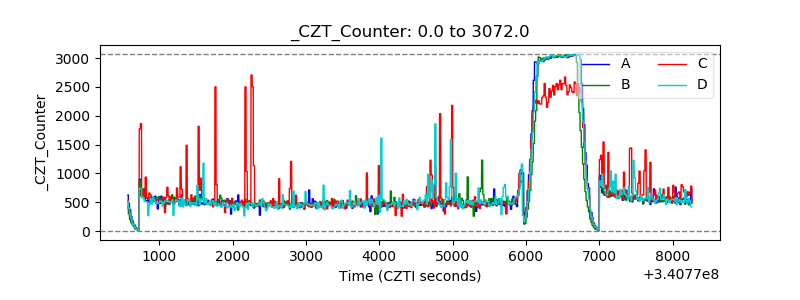 |
| +2.5 Volts monitor | 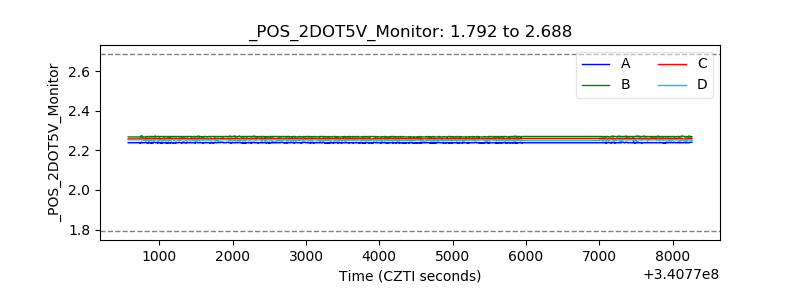 |
| +5 Volts monitor | 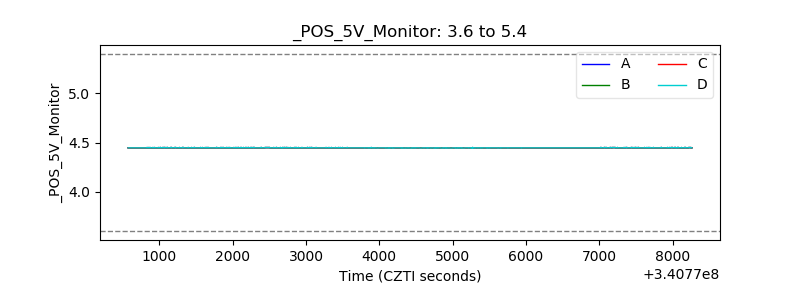 |
| _ROLL_ROT | 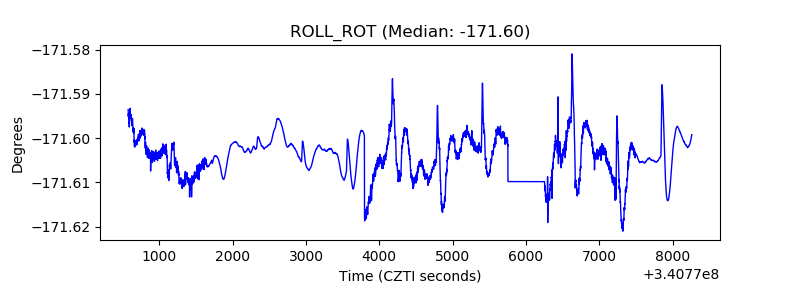 |
| _Roll_DEC |  |
| _Roll_RA | 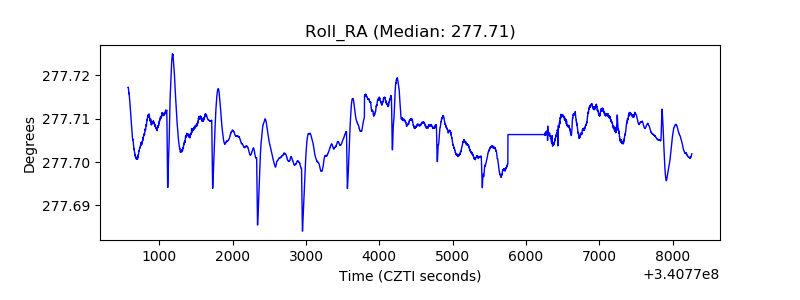 |
| Veto Counter | 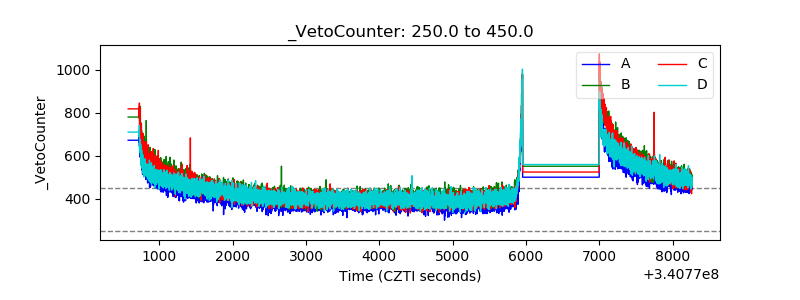 |