| Param | Original file | Final file |
|---|---|---|
| Filename | modeM0/AS1T03_255T01_9000003922_27355cztM0_level2.evt | modeM0/AS1T03_255T01_9000003922_27355cztM0_level2_quad_clean.evt |
| Size (bytes) | 140,713,920 | 8,233,920 |
| Size | 134.2 MB | 7.9 MB |
| Events in quadrant A | 939,284 | 31,931 |
| Events in quadrant B | 950,189 | 32,836 |
| Events in quadrant C | 1,216,846 | 29,864 |
| Events in quadrant D | 1,038,192 | 29,923 |
| Mode M9 | |||
|---|---|---|---|
| Quadrant | BADHDUFLAG | Total packets | Discarded packets |
| A | 0 | 7 | 0 |
| B | 0 | 8 | 0 |
| C | 0 | 8 | 0 |
| D | 0 | 8 | 0 |
| Mode M0 | |||
|---|---|---|---|
| Quadrant | BADHDUFLAG | Total packets | Discarded packets |
| A | 0 | 3779 | 0 |
| B | 0 | 3811 | 0 |
| C | 0 | 4814 | 0 |
| D | 0 | 4138 | 0 |
| Quadrant | Total seconds | Saturated seconds | Saturation percentage |
|---|---|---|---|
| A | 1686 | 11 | 0.652432% |
| B | 1686 | 20 | 1.186240% |
| C | 1686 | 94 | 5.575326% |
| D | 1686 | 12 | 0.711744% |
Noise dominated data is calculated using 1-second bins in cleaned event files. If a bin has >2000 counts, and if more than 50% of those come from <1% of pixels, then it is considered to be noise-dominated and hence unusable.
| Quadrant | # 1 sec bins | Bins with >0 counts | Bins with >2000 counts | High rate bins dominated by noise | Noise dominated (total time) | Noise dominated (detector-on time) | Marked lightcurve |
|---|---|---|---|---|---|---|---|
| A | 1686 | 1686 | 0 | 0 | 0.00% | 0.00% | 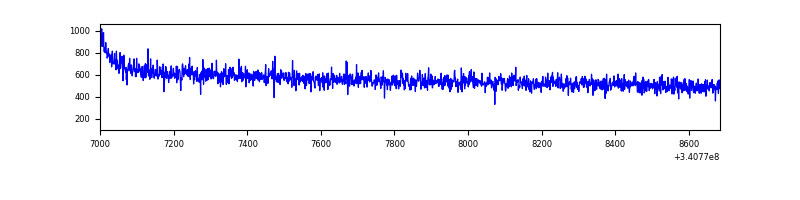 |
| B | 1686 | 1686 | 0 | 0 | 0.00% | 0.00% | 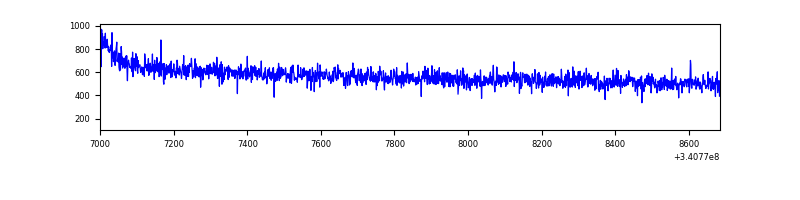 |
| C | 1686 | 1686 | 19 | 19 | 1.13% | 1.13% | 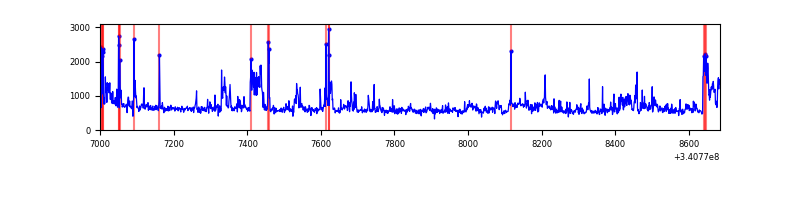 |
| D | 1686 | 1686 | 5 | 5 | 0.30% | 0.30% | 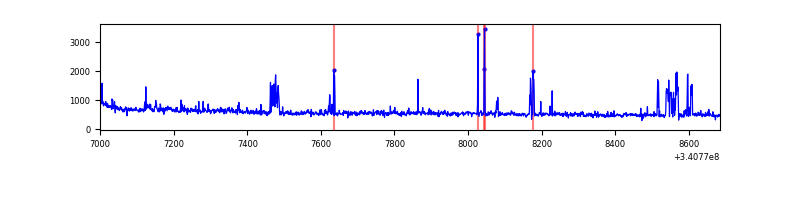 |
Top three noisy pixels from each quadrant. If the there are fewer than three noisy pixels in the level2.evt file, extra rows are filled as -1
| Pixel properties | Quadrant properties | ||||||
|---|---|---|---|---|---|---|---|
| Quadrant | DetID | PixID | Counts | Sigma | Mean | Median | Sigma |
| A | 13 | 254 | 2726 | 49.88 | 243 | 238 | 49.9 |
| A | 0 | 226 | 2060 | 36.53 | 243 | 238 | 49.9 |
| A | 3 | 137 | 2045 | 36.23 | 243 | 238 | 49.9 |
| B | 12 | 111 | 5237 | 106.19 | 243 | 237 | 47.1 |
| B | 11 | 111 | 4826 | 97.47 | 243 | 237 | 47.1 |
| B | 14 | 111 | 4697 | 94.73 | 243 | 237 | 47.1 |
| C | 2 | 16 | 231475 | 4269.37 | 229 | 231 | 54.2 |
| C | 15 | 208 | 52103 | 957.69 | 229 | 231 | 54.2 |
| C | 14 | 238 | 38448 | 705.59 | 229 | 231 | 54.2 |
| D | 1 | 52 | 149766 | 2646.62 | 233 | 227 | 56.5 |
| D | 2 | 120 | 6490 | 110.85 | 233 | 227 | 56.5 |
| D | 2 | 234 | 5299 | 89.77 | 233 | 227 | 56.5 |
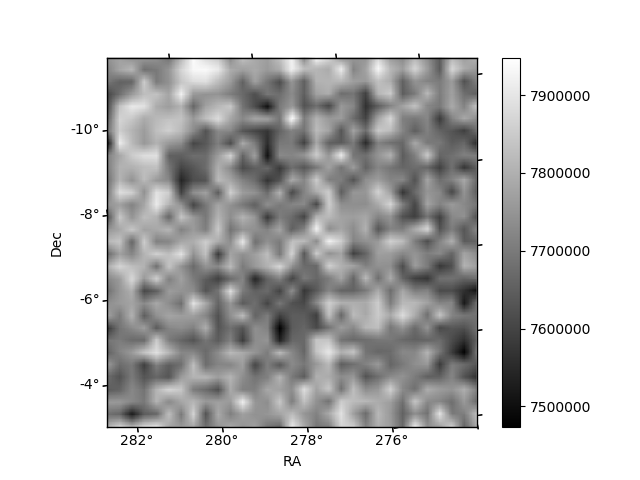
Histogram calculated using DETX and DETY for each event in the final _common_clean file
| Quadrant A | 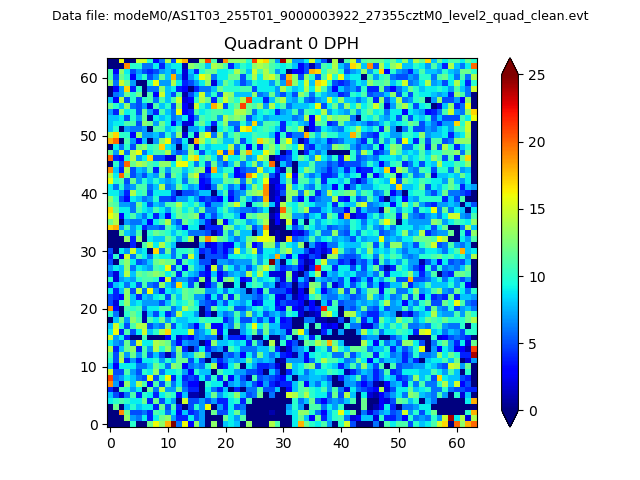 |
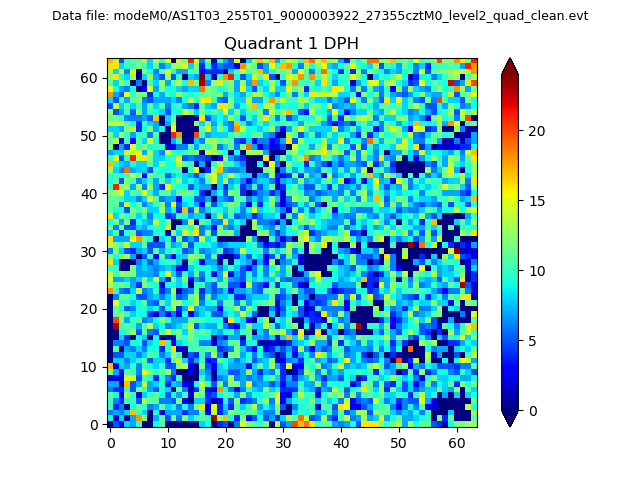 |
Quadrant B |
|---|---|---|---|
| Quadrant D | 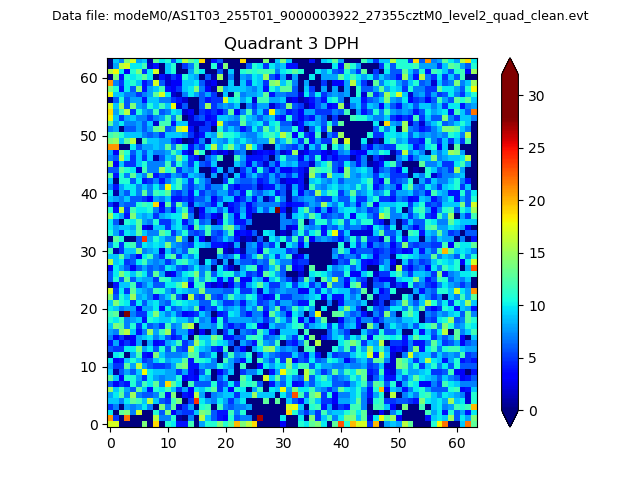 |
 |
Quadrant C |
| Plot type | Count rate plots | Images |
|---|---|---|
| Comparison with Poisson distribution Blue bars denote a histogram of data divided into 1 sec bins. Red curve is a Poisson curve with rate = median count rate of data. |
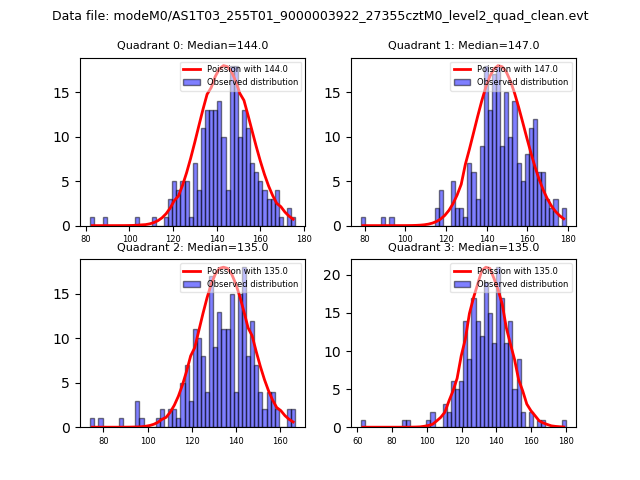 |
 |
| Quadrant-wise count rates Data is divided into 100 sec bins |
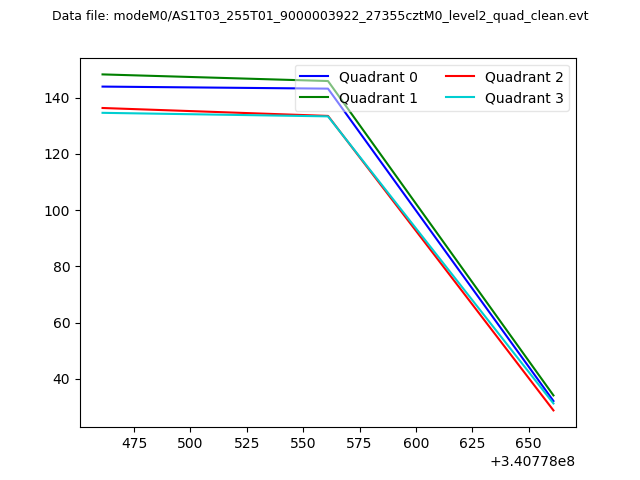 |
|
| Module-wise count rates for Quadrant A Data is divided into 100 sec bins |
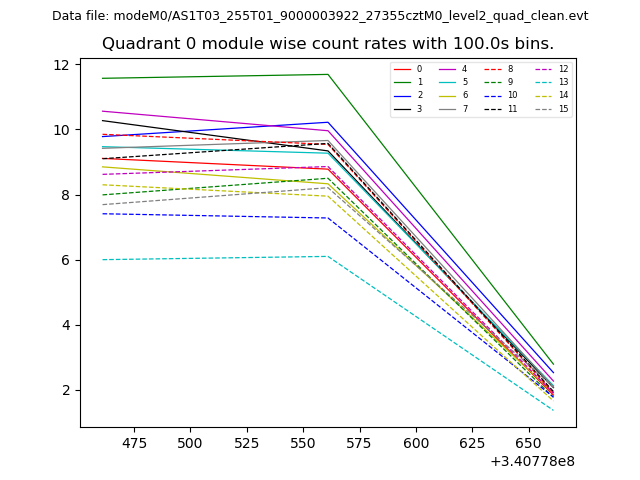 |
 |
| Module-wise count rates for Quadrant B Data is divided into 100 sec bins |
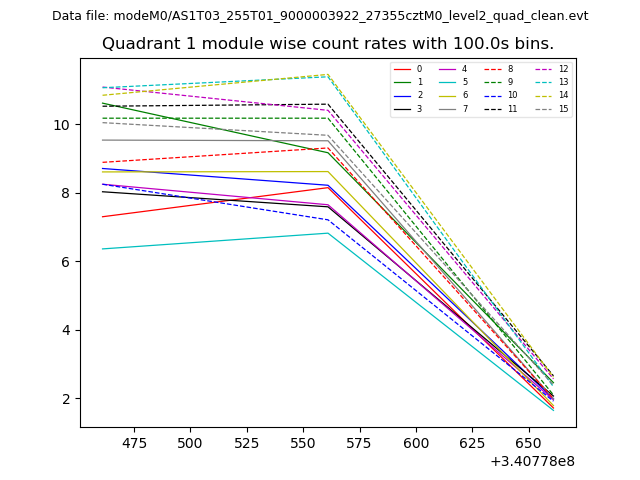 |
 |
| Module-wise count rates for Quadrant C Data is divided into 100 sec bins |
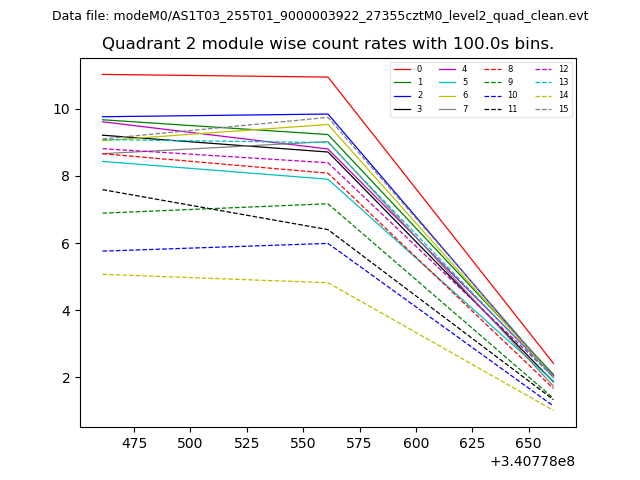 |
 |
| Module-wise count rates for Quadrant D Data is divided into 100 sec bins |
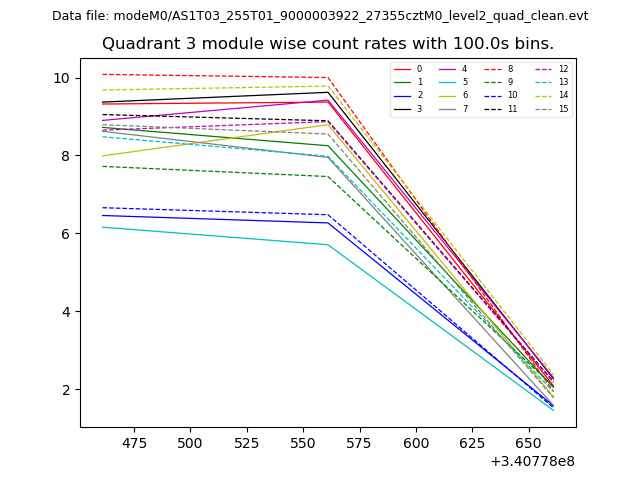 |
 |
| Parameter | Plot |
|---|---|
| CZT HV Monitor | 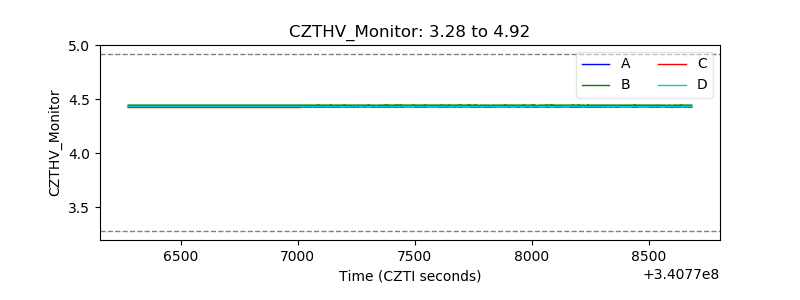 |
| D_VDD | 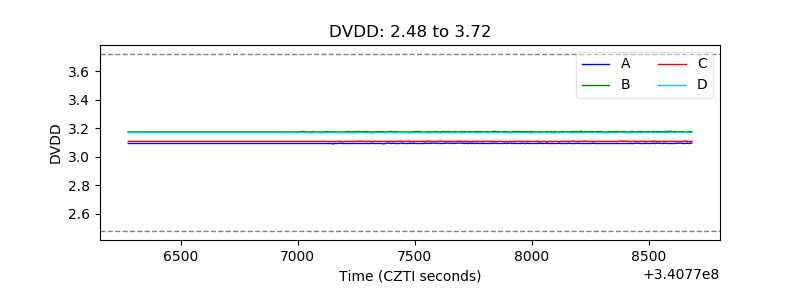 |
| Temperature 1 | 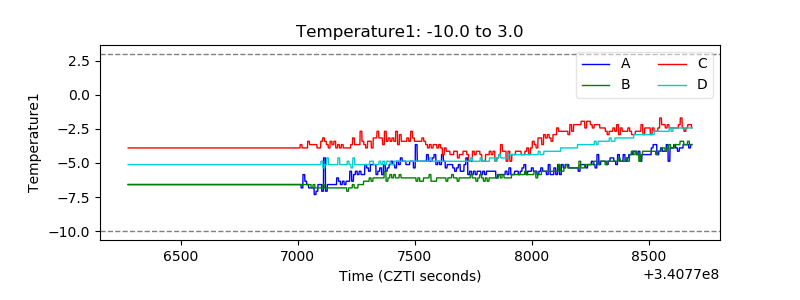 |
| Veto HV Monitor | 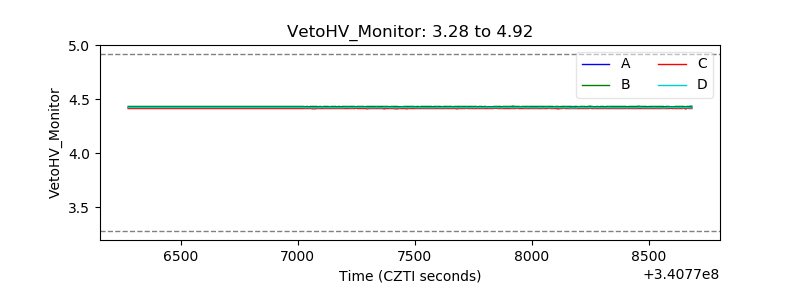 |
| Veto LLD | 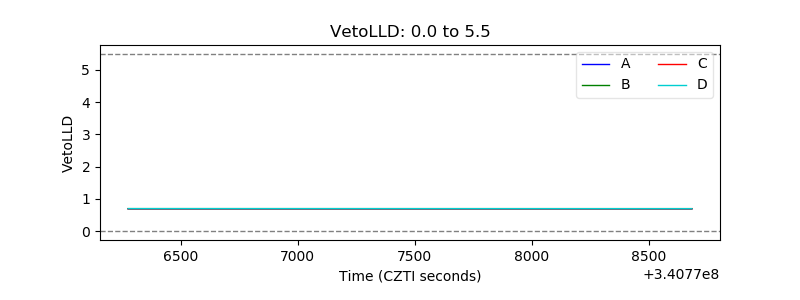 |
| Alpha Counter | 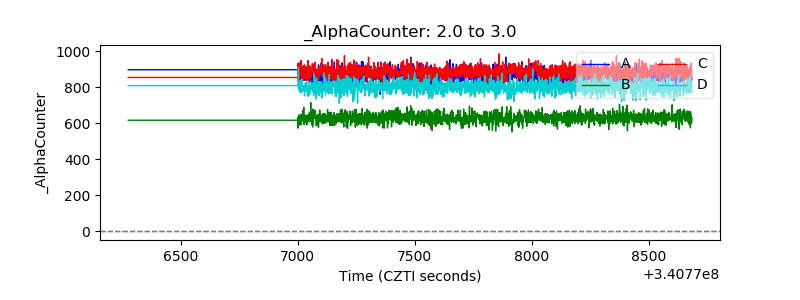 |
| _CPM_Rate | 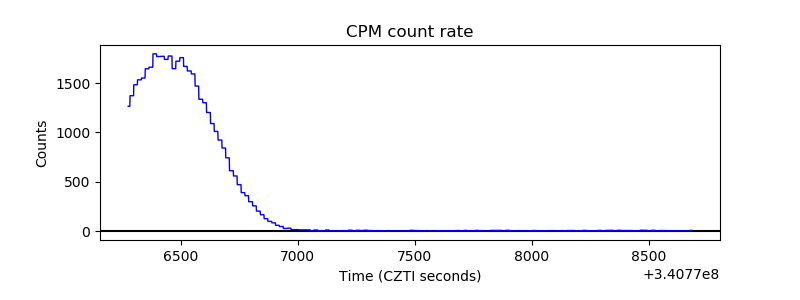 |
| CZT Counter |  |
| +2.5 Volts monitor |  |
| +5 Volts monitor | 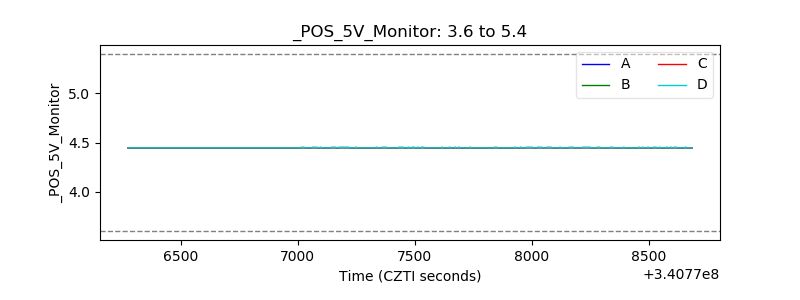 |
| _ROLL_ROT | 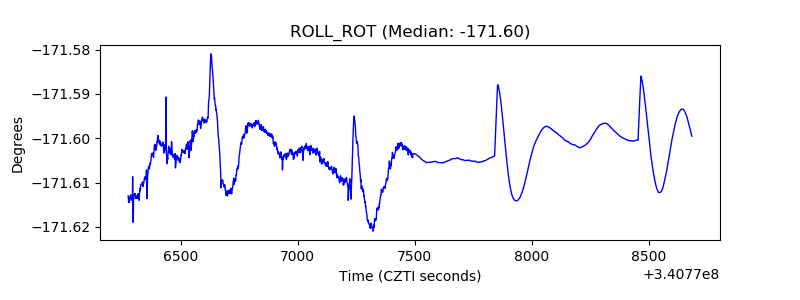 |
| _Roll_DEC | 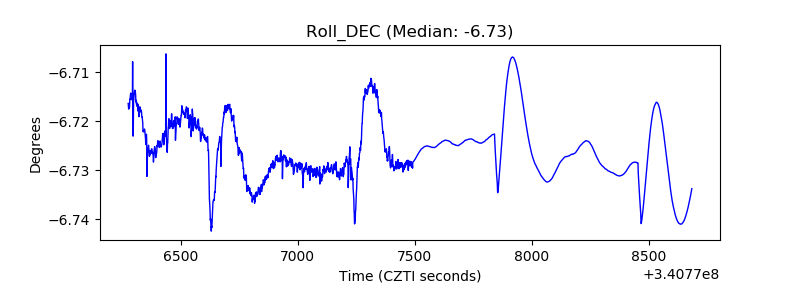 |
| _Roll_RA | 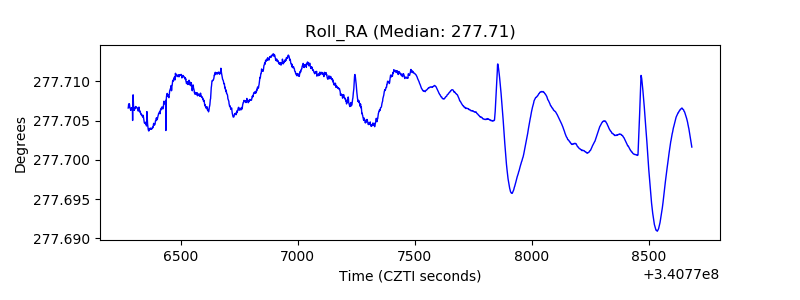 |
| Veto Counter | 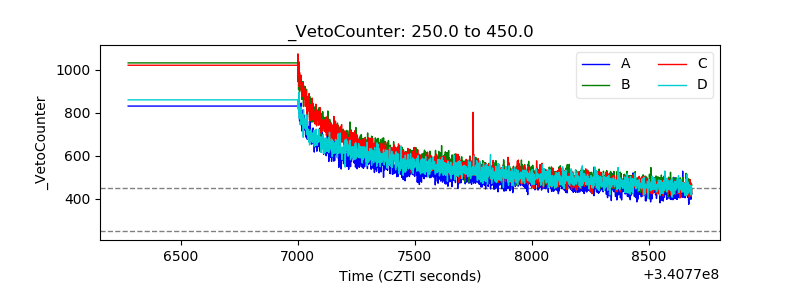 |