| Param | Original file | Final file |
|---|---|---|
| Filename | modeM0/AS1A09_038T11_9000003924cztM0_level2.fits | modeM0/AS1A09_038T11_9000003924cztM0_level2_quad_clean.evt |
| Size (bytes) | 71,418,240 | 42,563,520 |
| Size | 68.1 MB | 40.6 MB |
| Events in quadrant A | 477,142 | 233,928 |
| Events in quadrant B | 455,078 | 234,049 |
| Events in quadrant C | 361,516 | 157,265 |
| Events in quadrant D | 385,312 | 179,865 |
| Mode M0 | |||
|---|---|---|---|
| Quadrant | BADHDUFLAG | Total packets | Discarded packets |
| A | 0 | 14654 | 0 |
| B | 0 | 14777 | 0 |
| C | 0 | 27779 | 0 |
| D | 0 | 24717 | 0 |
| Mode M9 | |||
|---|---|---|---|
| Quadrant | BADHDUFLAG | Total packets | Discarded packets |
| A | 0 | 12 | 0 |
| B | 0 | 12 | 0 |
| C | 0 | 12 | 0 |
| D | 0 | 12 | 0 |
| Mode SS | |||
|---|---|---|---|
| Quadrant | BADHDUFLAG | Total packets | Discarded packets |
| A | 0 | 140 | 0 |
| B | 0 | 140 | 0 |
| C | 0 | 140 | 0 |
| D | 0 | 140 | 0 |
| Quadrant | Total seconds | Saturated seconds | Saturation percentage |
|---|---|---|---|
| A | 6932 | 53 | 0.764570% |
| B | 6932 | 52 | 0.750144% |
| C | 6932 | 2074 | 29.919215% |
| D | 6932 | 1006 | 14.512406% |
Noise dominated data is calculated using 1-second bins in cleaned event files. If a bin has >2000 counts, and if more than 50% of those come from <1% of pixels, then it is considered to be noise-dominated and hence unusable.
| Quadrant | # 1 sec bins | Bins with >0 counts | Bins with >2000 counts | High rate bins dominated by noise | Noise dominated (total time) | Noise dominated (detector-on time) | Marked lightcurve |
|---|---|---|---|---|---|---|---|
| A | 8102 | 6931 | 0 | 0 | 0.00% | 0.00% |  |
| B | 8102 | 6931 | 0 | 0 | 0.00% | 0.00% |  |
| C | 8101 | 6428 | 0 | 0 | 0.00% | 0.00% |  |
| D | 8102 | 6932 | 0 | 0 | 0.00% | 0.00% |  |
Top three noisy pixels from each quadrant. If the there are fewer than three noisy pixels in the level2.evt file, extra rows are filled as -1
| Pixel properties | Quadrant properties | ||||||
|---|---|---|---|---|---|---|---|
| Quadrant | DetID | PixID | Counts | Sigma | Mean | Median | Sigma |
| A | 0 | 29 | 426 | 9.72 | 124 | 118 | 31.7 |
| A | 7 | 110 | 386 | 8.46 | 124 | 118 | 31.7 |
| A | 9 | 19 | 360 | 7.64 | 124 | 118 | 31.7 |
| B | 2 | 9 | 342 | 8.75 | 120 | 116 | 25.8 |
| B | 5 | 232 | 315 | 7.7 | 120 | 116 | 25.8 |
| B | 12 | 226 | 293 | 6.85 | 120 | 116 | 25.8 |
| C | 3 | 202 | 298 | 7.98 | 95 | 90 | 26.0 |
| C | 1 | 81 | 280 | 7.29 | 95 | 90 | 26.0 |
| C | 3 | 203 | 269 | 6.87 | 95 | 90 | 26.0 |
| D | 6 | 38 | 280 | 5.92 | 110 | 100 | 30.4 |
| D | 6 | 62 | 279 | 5.89 | 110 | 100 | 30.4 |
| D | 10 | 189 | 278 | 5.86 | 110 | 100 | 30.4 |
Histogram calculated using DETX and DETY for each event in the final _common_clean file
| Quadrant A | 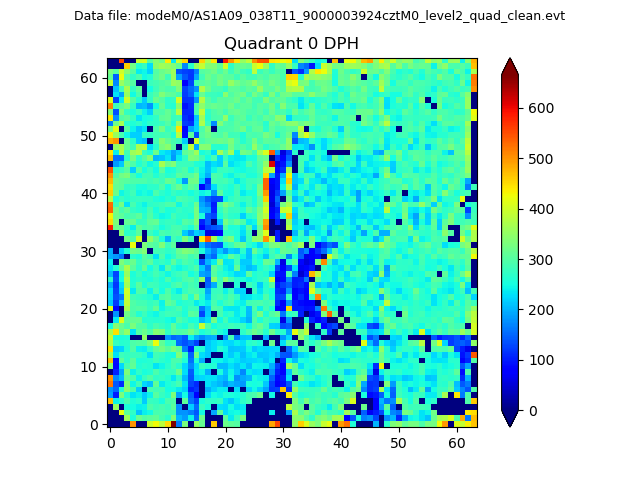 |
 |
Quadrant B |
|---|---|---|---|
| Quadrant D |  |
 |
Quadrant C |
| Plot type | Count rate plots | Images |
|---|---|---|
| Comparison with Poisson distribution Blue bars denote a histogram of data divided into 1 sec bins. Red curve is a Poisson curve with rate = median count rate of data. |
 |
 |
| Quadrant-wise count rates Data is divided into 100 sec bins |
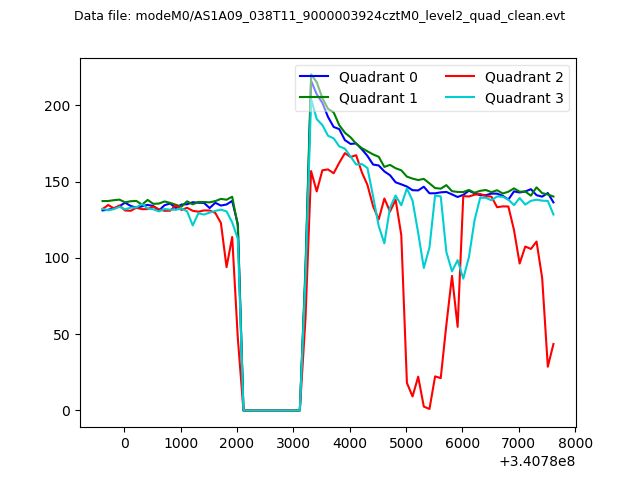 |
|
| Module-wise count rates for Quadrant A Data is divided into 100 sec bins |
 |
 |
| Module-wise count rates for Quadrant B Data is divided into 100 sec bins |
 |
 |
| Module-wise count rates for Quadrant C Data is divided into 100 sec bins |
 |
 |
| Module-wise count rates for Quadrant D Data is divided into 100 sec bins |
 |
 |
| Parameter | Plot |
|---|---|
| CZT HV Monitor |  |
| D_VDD | 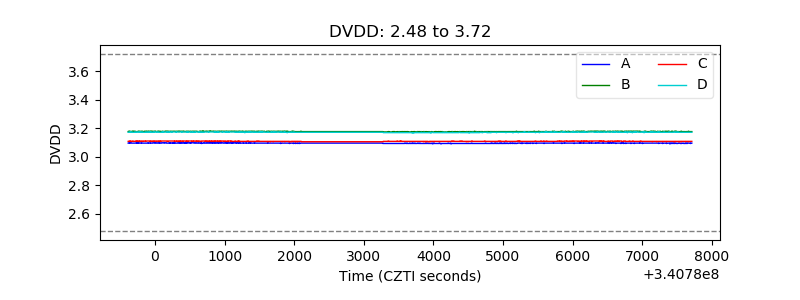 |
| Temperature 1 | 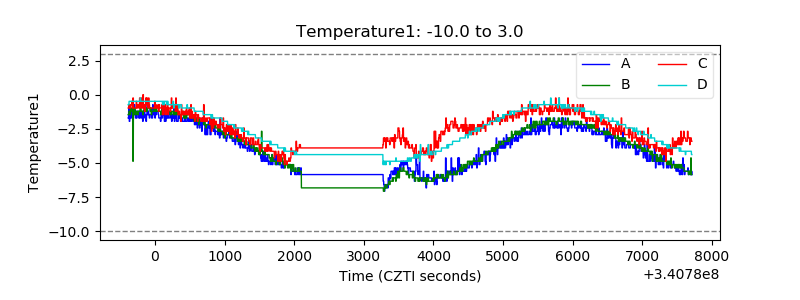 |
| Veto HV Monitor |  |
| Veto LLD |  |
| Alpha Counter | 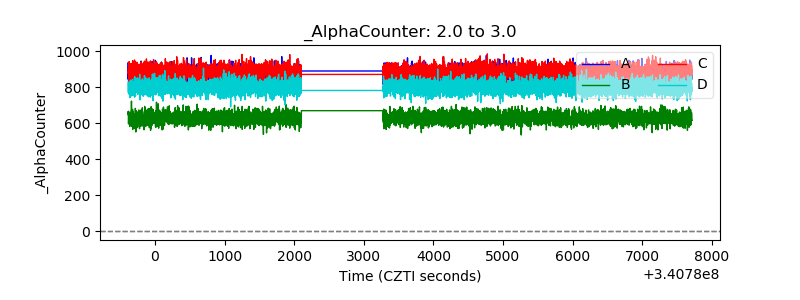 |
| _CPM_Rate |  |
| CZT Counter | 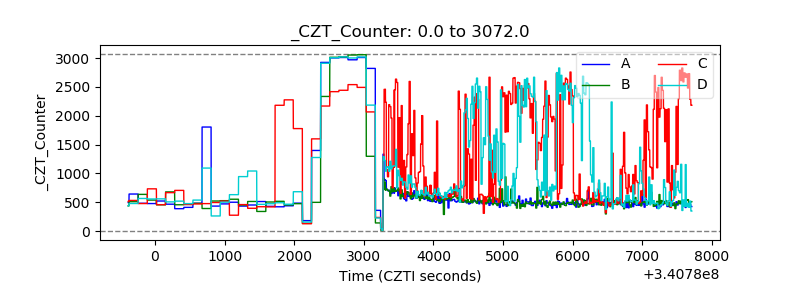 |
| +2.5 Volts monitor |  |
| +5 Volts monitor |  |
| _ROLL_ROT | 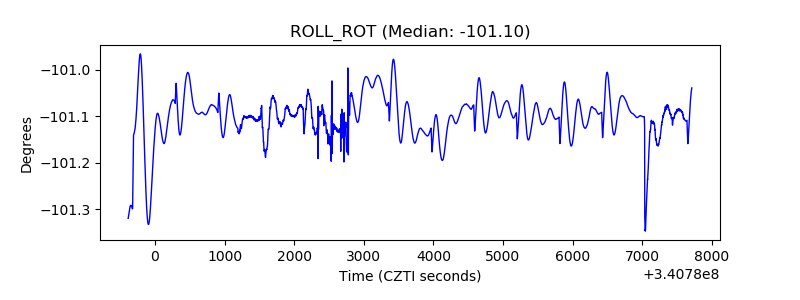 |
| _Roll_DEC |  |
| _Roll_RA | 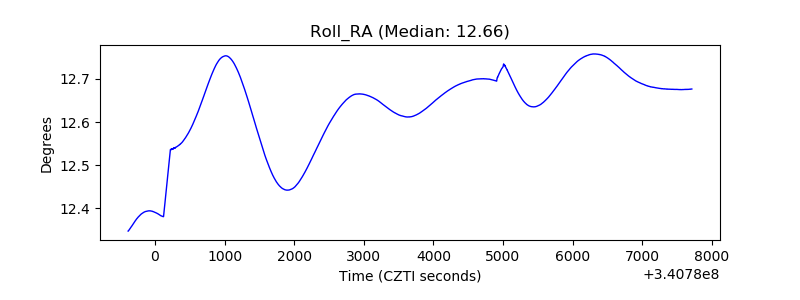 |
| Veto Counter | 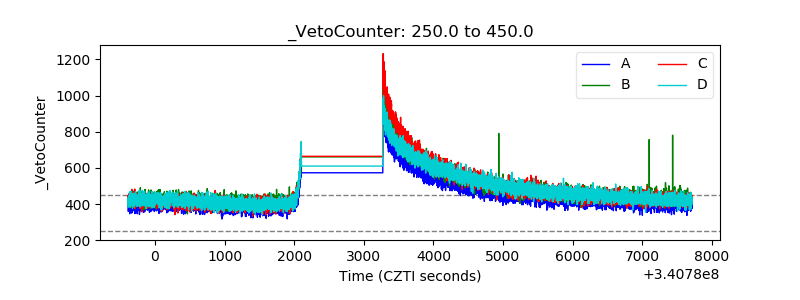 |