| Param | Original file | Final file |
|---|---|---|
| Filename | modeM0/AS1A09_038T11_9000003924_27355cztM0_level2.evt | modeM0/AS1A09_038T11_9000003924_27355cztM0_level2_quad_clean.evt |
| Size (bytes) | 342,987,840 | 82,900,800 |
| Size | 327.1 MB | 79.1 MB |
| Events in quadrant A | 2,004,772 | 578,408 |
| Events in quadrant B | 2,058,920 | 591,104 |
| Events in quadrant C | 3,191,756 | 518,657 |
| Events in quadrant D | 2,871,608 | 552,376 |
| Mode M0 | |||
|---|---|---|---|
| Quadrant | BADHDUFLAG | Total packets | Discarded packets |
| A | 0 | 8397 | 0 |
| B | 0 | 8459 | 0 |
| C | 0 | 12048 | 0 |
| D | 0 | 11094 | 0 |
| Mode M9 | |||
|---|---|---|---|
| Quadrant | BADHDUFLAG | Total packets | Discarded packets |
| A | 0 | 12 | 0 |
| B | 0 | 12 | 0 |
| C | 0 | 12 | 0 |
| D | 0 | 12 | 0 |
| Quadrant | Total seconds | Saturated seconds | Saturation percentage |
|---|---|---|---|
| A | 3820 | 50 | 1.308901% |
| B | 3820 | 47 | 1.230366% |
| C | 3820 | 584 | 15.287958% |
| D | 3820 | 181 | 4.738220% |
Noise dominated data is calculated using 1-second bins in cleaned event files. If a bin has >2000 counts, and if more than 50% of those come from <1% of pixels, then it is considered to be noise-dominated and hence unusable.
| Quadrant | # 1 sec bins | Bins with >0 counts | Bins with >2000 counts | High rate bins dominated by noise | Noise dominated (total time) | Noise dominated (detector-on time) | Marked lightcurve |
|---|---|---|---|---|---|---|---|
| A | 4990 | 3820 | 8 | 8 | 0.16% | 0.21% | 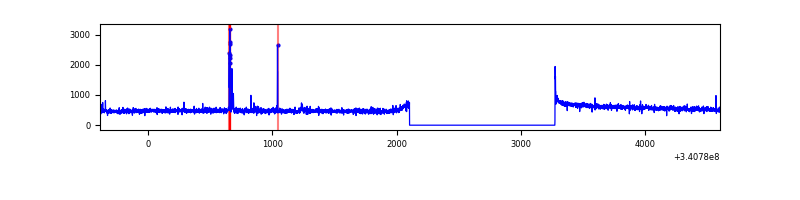 |
| B | 4990 | 3820 | 3 | 3 | 0.06% | 0.08% | 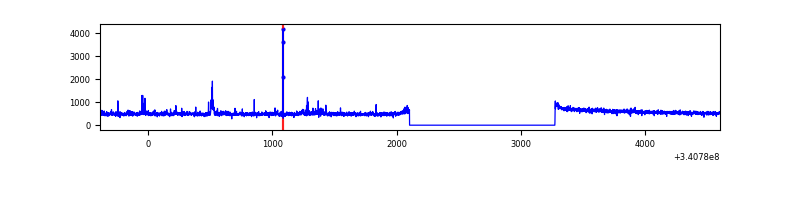 |
| C | 4990 | 3820 | 348 | 348 | 6.97% | 9.11% | 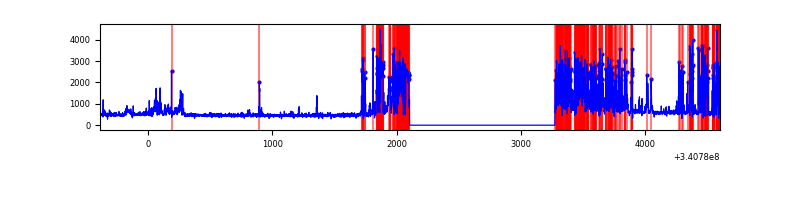 |
| D | 4990 | 3821 | 141 | 141 | 2.83% | 3.69% | 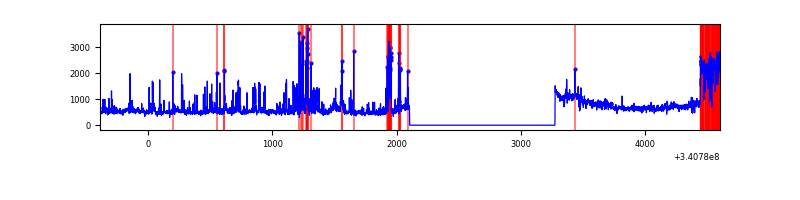 |
Top three noisy pixels from each quadrant. If the there are fewer than three noisy pixels in the level2.evt file, extra rows are filled as -1
| Pixel properties | Quadrant properties | ||||||
|---|---|---|---|---|---|---|---|
| Quadrant | DetID | PixID | Counts | Sigma | Mean | Median | Sigma |
| A | 13 | 248 | 36419 | 357.85 | 508 | 501 | 100.4 |
| A | 13 | 254 | 7060 | 65.35 | 508 | 501 | 100.4 |
| A | 8 | 192 | 5848 | 53.27 | 508 | 501 | 100.4 |
| B | 5 | 172 | 28365 | 294.42 | 505 | 494 | 94.7 |
| B | 0 | 190 | 22416 | 231.57 | 505 | 494 | 94.7 |
| B | 0 | 182 | 11314 | 114.3 | 505 | 494 | 94.7 |
| C | 2 | 16 | 1330966 | 12712.23 | 452 | 456 | 104.7 |
| C | 14 | 238 | 75643 | 718.37 | 452 | 456 | 104.7 |
| C | 15 | 208 | 23087 | 216.23 | 452 | 456 | 104.7 |
| D | 1 | 52 | 813500 | 6705.18 | 485 | 474 | 121.3 |
| D | 2 | 250 | 162885 | 1339.43 | 485 | 474 | 121.3 |
| D | 2 | 120 | 31253 | 253.84 | 485 | 474 | 121.3 |
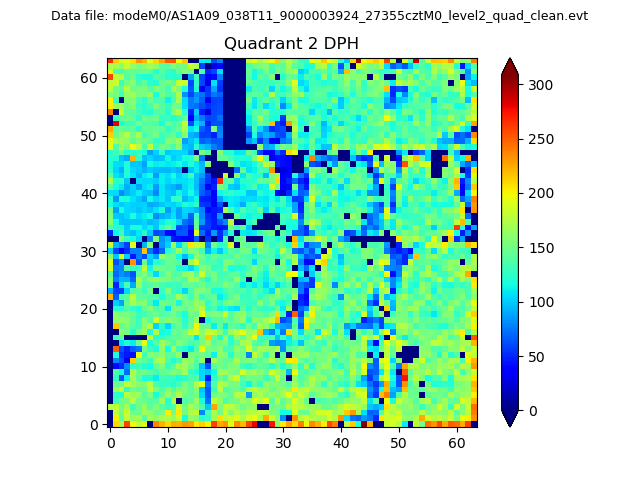
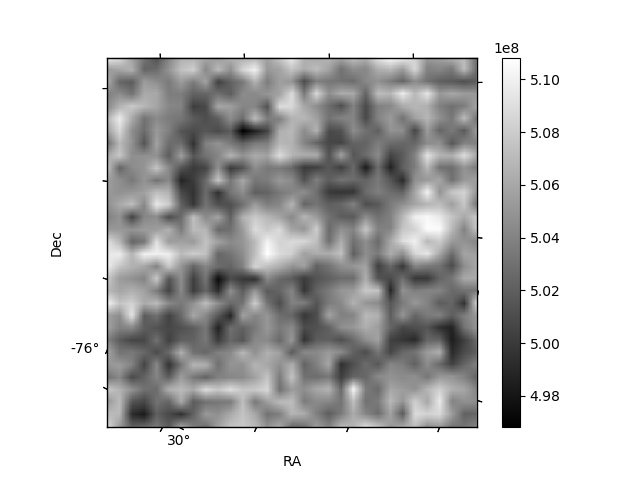
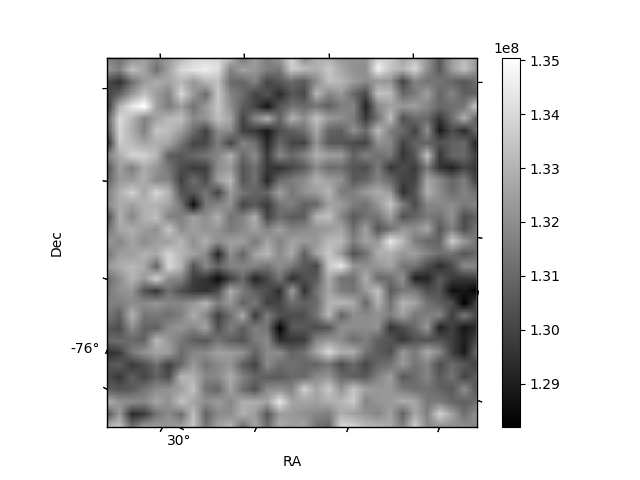
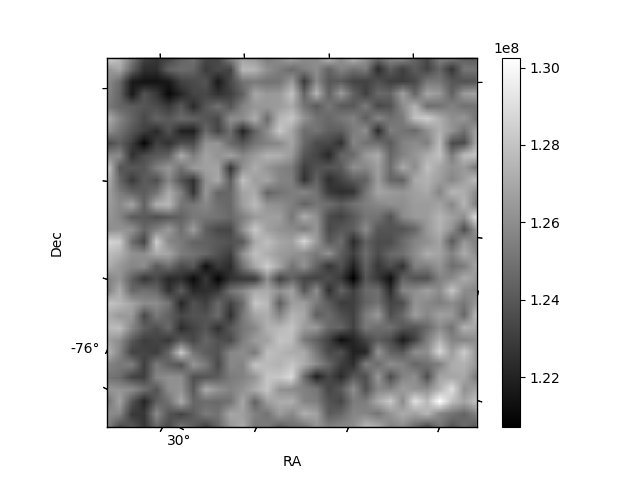
Histogram calculated using DETX and DETY for each event in the final _common_clean file
| Quadrant A | 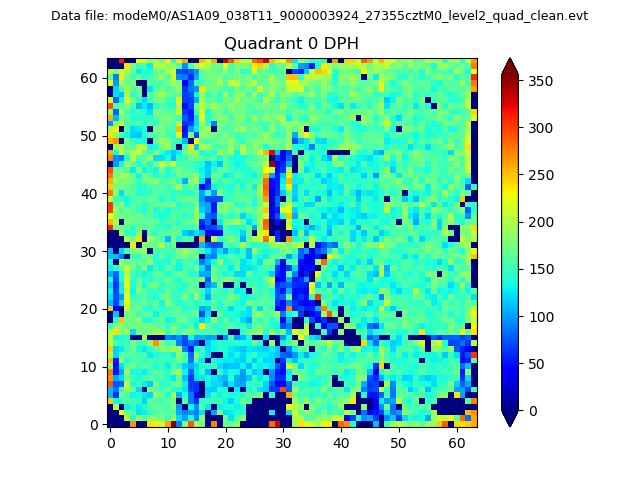 |
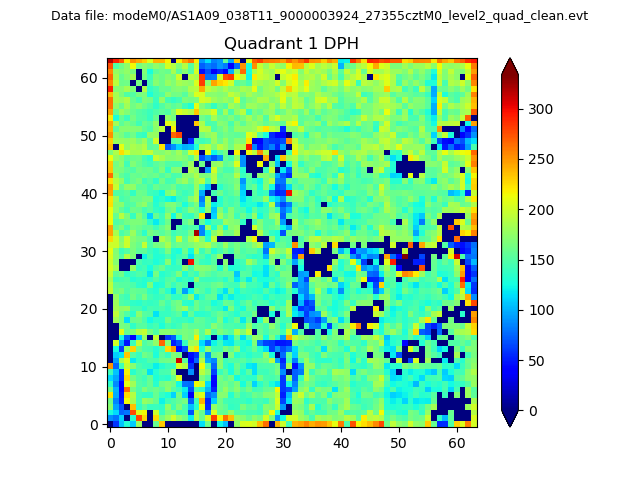 |
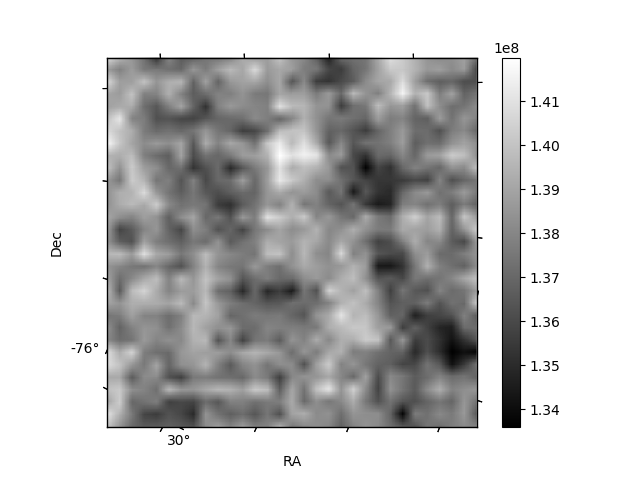
Quadrant B |
|---|---|---|---|
| Quadrant D | 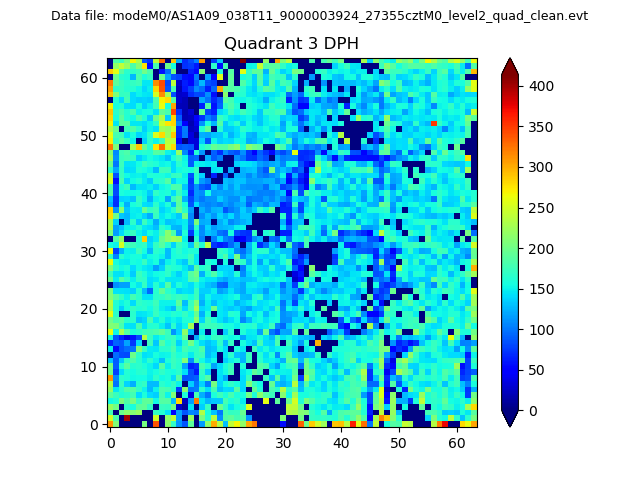 |
 |
Quadrant C |
| Plot type | Count rate plots | Images |
|---|---|---|
| Comparison with Poisson distribution Blue bars denote a histogram of data divided into 1 sec bins. Red curve is a Poisson curve with rate = median count rate of data. |
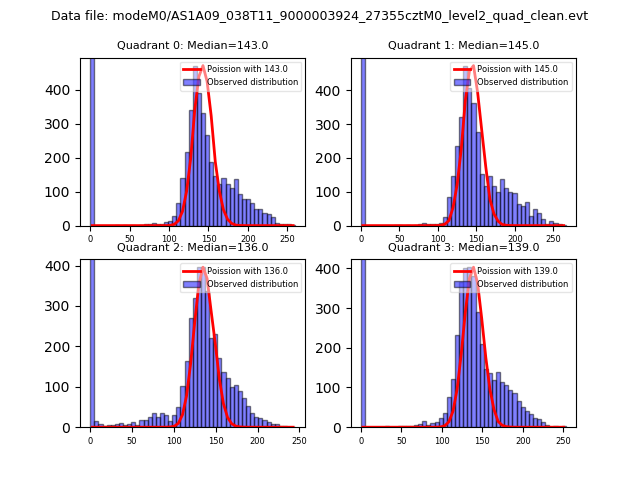 |
 |
| Quadrant-wise count rates Data is divided into 100 sec bins |
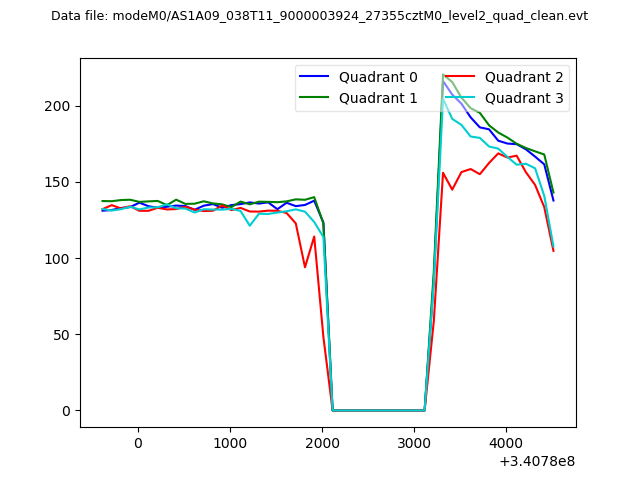 |
|
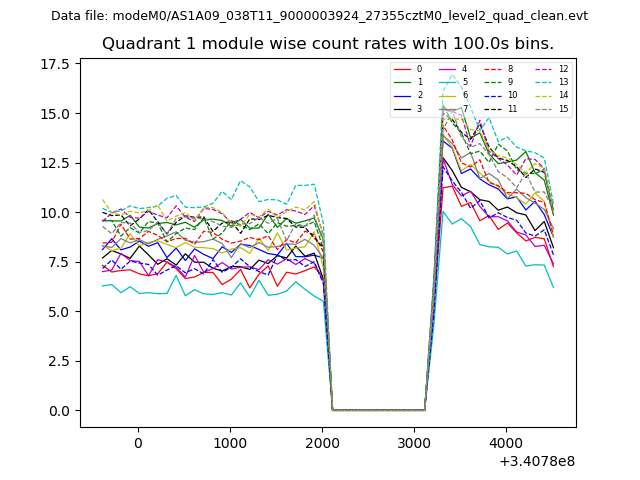
| Module-wise count rates for Quadrant A Data is divided into 100 sec bins |
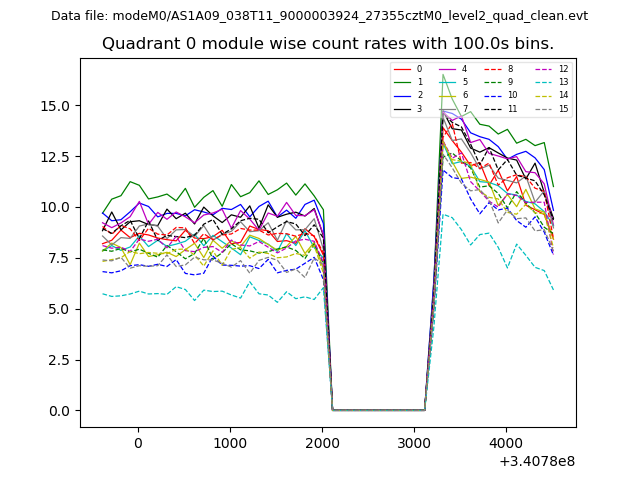 |
 |
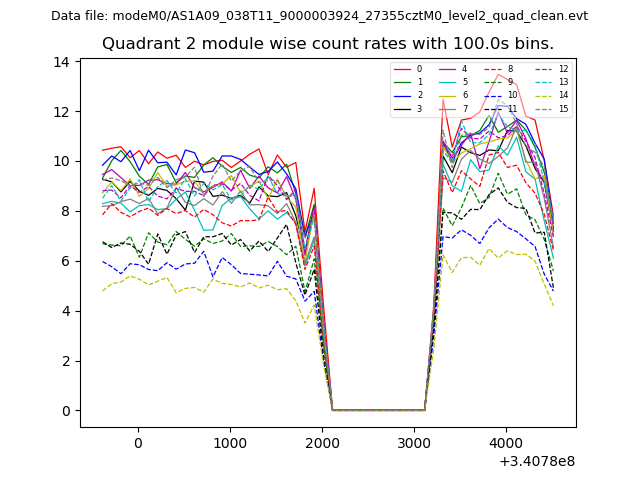
| Module-wise count rates for Quadrant B Data is divided into 100 sec bins |
 |
 |
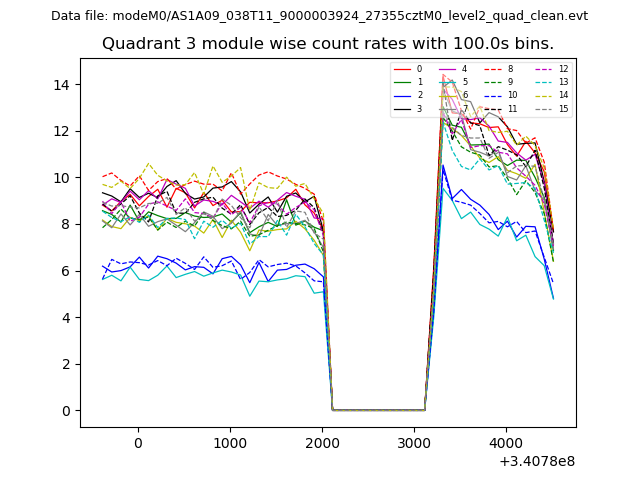
| Module-wise count rates for Quadrant C Data is divided into 100 sec bins |
 |
 |
| Module-wise count rates for Quadrant D Data is divided into 100 sec bins |
 |
 |
| Parameter | Plot |
|---|---|
| CZT HV Monitor | 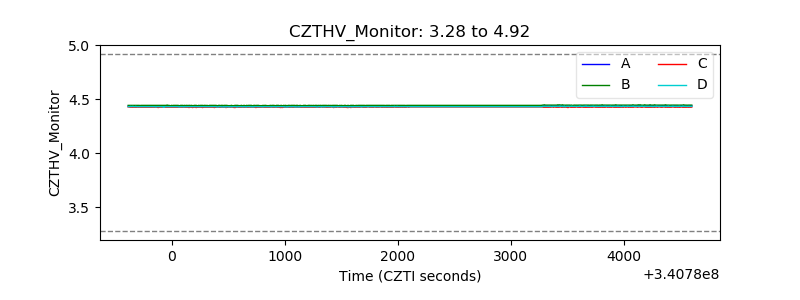 |
| D_VDD | 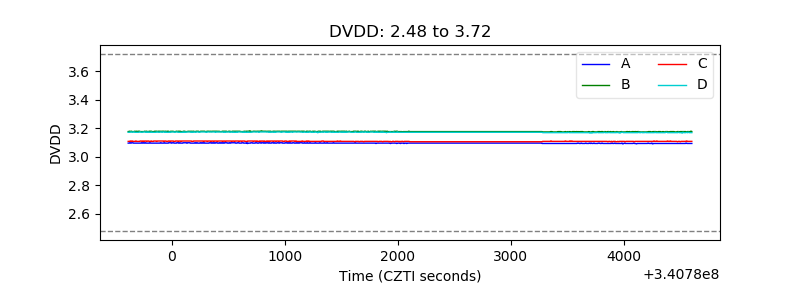 |
| Temperature 1 |  |
| Veto HV Monitor | 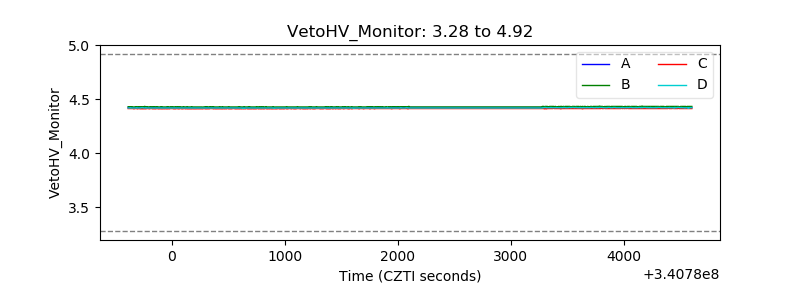 |
| Veto LLD |  |
| Alpha Counter | 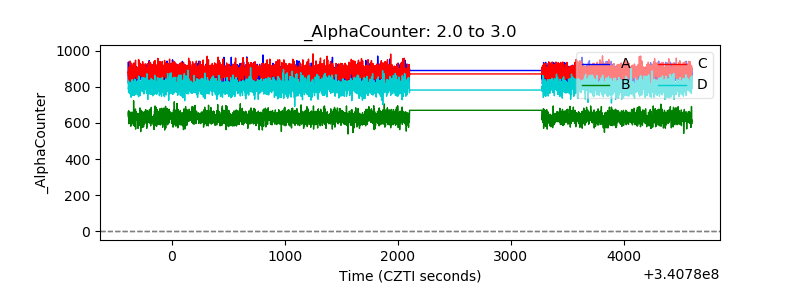 |
| _CPM_Rate | 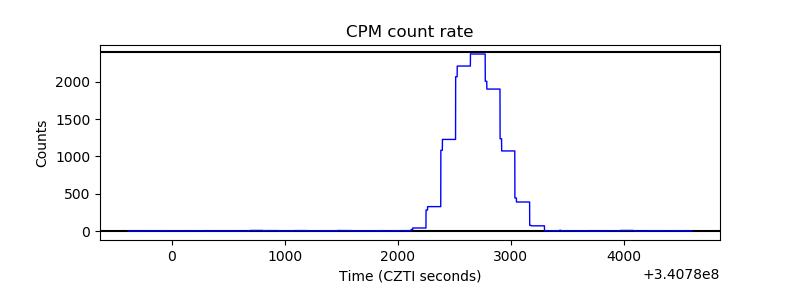 |
| CZT Counter | 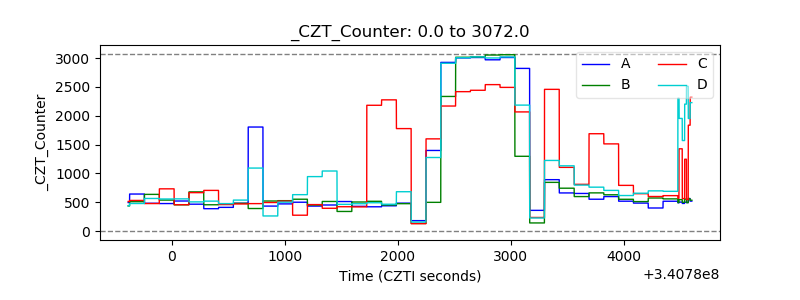 |
| +2.5 Volts monitor |  |
| +5 Volts monitor |  |
| _ROLL_ROT | 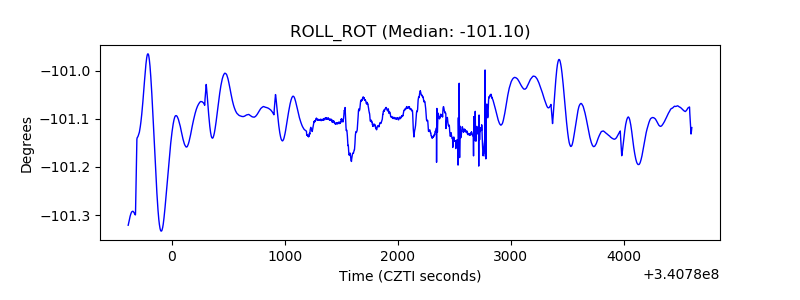 |
| _Roll_DEC | 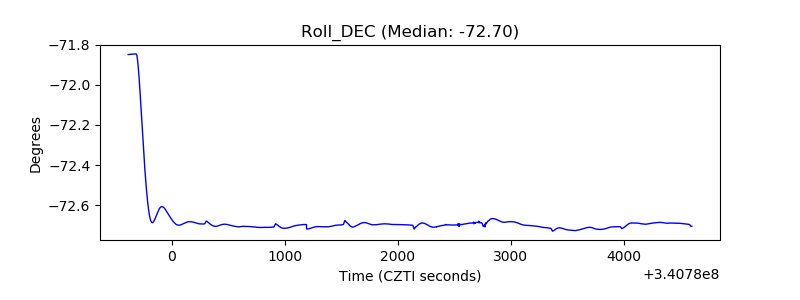 |
| _Roll_RA | 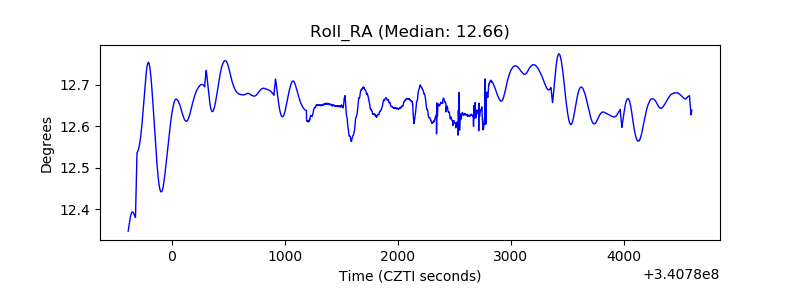 |
| Veto Counter | 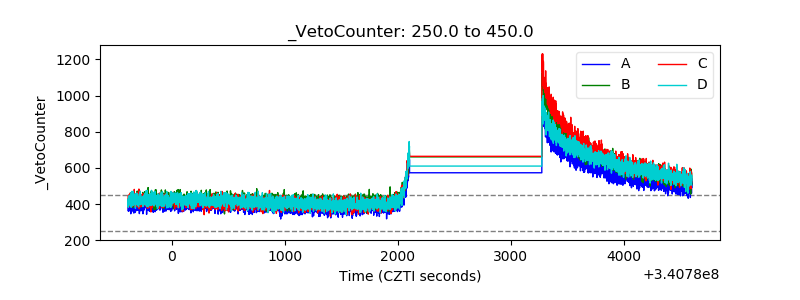 |