| Param | Original file | Final file |
|---|---|---|
| Filename | modeM0/AS1A09_038T11_9000003924_27356cztM0_level2.evt | modeM0/AS1A09_038T11_9000003924_27356cztM0_level2_quad_clean.evt |
| Size (bytes) | 464,379,840 | 77,679,360 |
| Size | 442.9 MB | 74.1 MB |
| Events in quadrant A | 1,910,989 | 577,541 |
| Events in quadrant B | 1,948,875 | 591,193 |
| Events in quadrant C | 5,324,443 | 394,763 |
| Events in quadrant D | 4,615,841 | 513,865 |
| Mode M0 | |||
|---|---|---|---|
| Quadrant | BADHDUFLAG | Total packets | Discarded packets |
| A | 0 | 7908 | 0 |
| B | 0 | 7953 | 0 |
| C | 0 | 18390 | 0 |
| D | 0 | 16435 | 0 |
| Quadrant | Total seconds | Saturated seconds | Saturation percentage |
|---|---|---|---|
| A | 3875 | 4 | 0.103226% |
| B | 3876 | 6 | 0.154799% |
| C | 3876 | 1611 | 41.563467% |
| D | 3876 | 922 | 23.787410% |
Noise dominated data is calculated using 1-second bins in cleaned event files. If a bin has >2000 counts, and if more than 50% of those come from <1% of pixels, then it is considered to be noise-dominated and hence unusable.
| Quadrant | # 1 sec bins | Bins with >0 counts | Bins with >2000 counts | High rate bins dominated by noise | Noise dominated (total time) | Noise dominated (detector-on time) | Marked lightcurve |
|---|---|---|---|---|---|---|---|
| A | 3875 | 3875 | 0 | 0 | 0.00% | 0.00% | 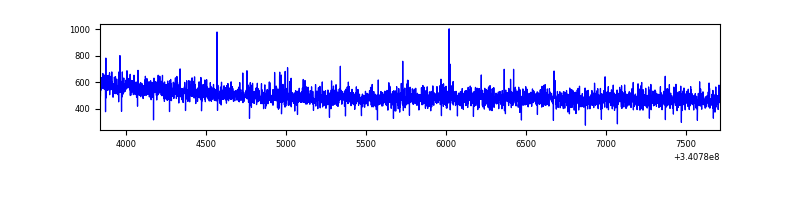 |
| B | 3876 | 3876 | 0 | 0 | 0.00% | 0.00% | 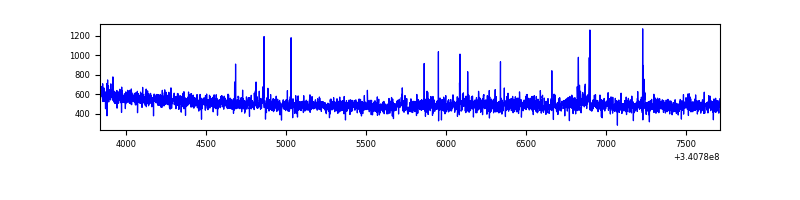 |
| C | 3875 | 3875 | 1188 | 1188 | 30.66% | 30.66% | 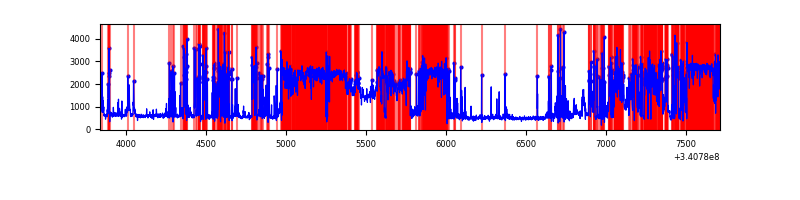 |
| D | 3876 | 3876 | 869 | 869 | 22.42% | 22.42% | 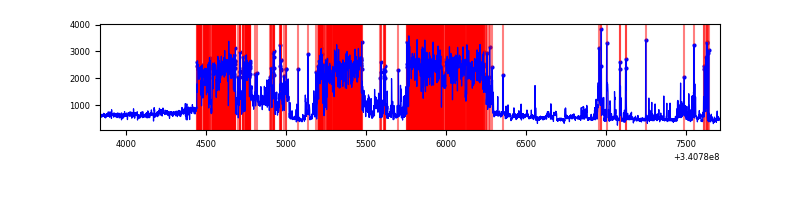 |
Top three noisy pixels from each quadrant. If the there are fewer than three noisy pixels in the level2.evt file, extra rows are filled as -1
| Pixel properties | Quadrant properties | ||||||
|---|---|---|---|---|---|---|---|
| Quadrant | DetID | PixID | Counts | Sigma | Mean | Median | Sigma |
| A | 13 | 254 | 6612 | 61.96 | 495 | 487 | 98.8 |
| A | 0 | 226 | 4237 | 37.93 | 495 | 487 | 98.8 |
| A | 3 | 137 | 4181 | 37.37 | 495 | 487 | 98.8 |
| B | 15 | 32 | 13547 | 144.88 | 489 | 477 | 90.2 |
| B | 12 | 111 | 10214 | 107.93 | 489 | 477 | 90.2 |
| B | 11 | 111 | 9244 | 97.18 | 489 | 477 | 90.2 |
| C | 2 | 16 | 3890310 | 49227.7 | 343 | 346 | 79.0 |
| C | 14 | 238 | 56147 | 706.16 | 343 | 346 | 79.0 |
| C | 15 | 208 | 35251 | 441.72 | 343 | 346 | 79.0 |
| D | 1 | 52 | 2782974 | 25331.52 | 450 | 439 | 109.8 |
| D | 2 | 250 | 101928 | 923.93 | 450 | 439 | 109.8 |
| D | 2 | 234 | 15806 | 139.89 | 450 | 439 | 109.8 |
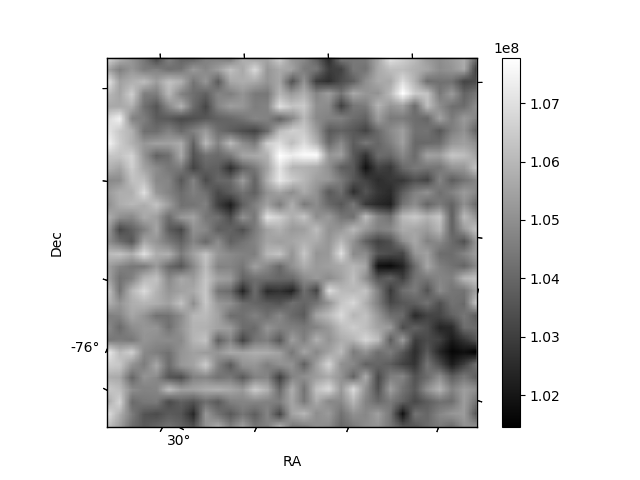
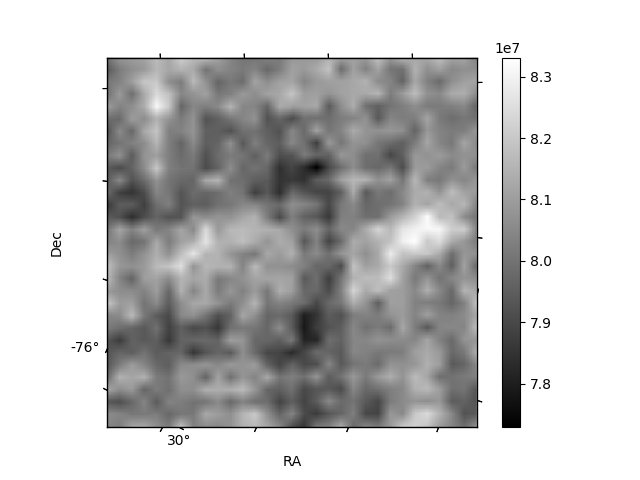
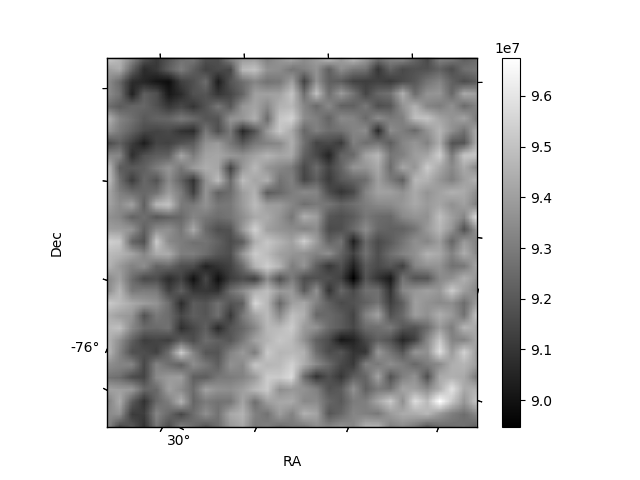
Histogram calculated using DETX and DETY for each event in the final _common_clean file
| Quadrant A | 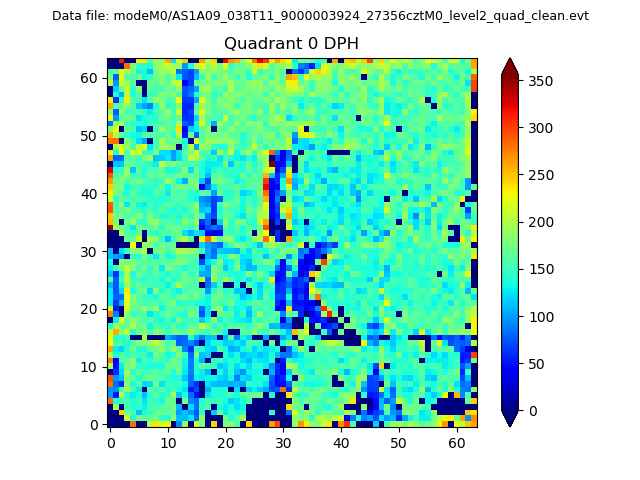 |
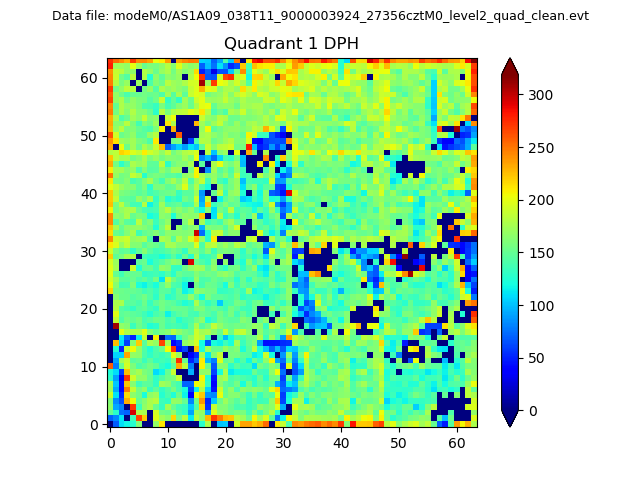 |
Quadrant B |
|---|---|---|---|
| Quadrant D | 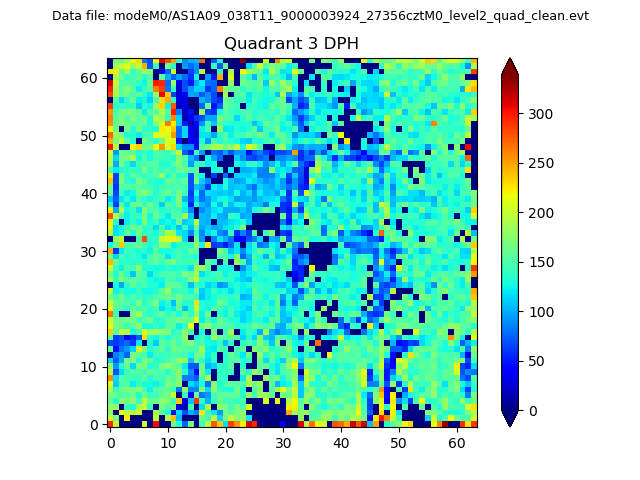 |
 |
Quadrant C |
| Plot type | Count rate plots | Images |
|---|---|---|
| Comparison with Poisson distribution Blue bars denote a histogram of data divided into 1 sec bins. Red curve is a Poisson curve with rate = median count rate of data. |
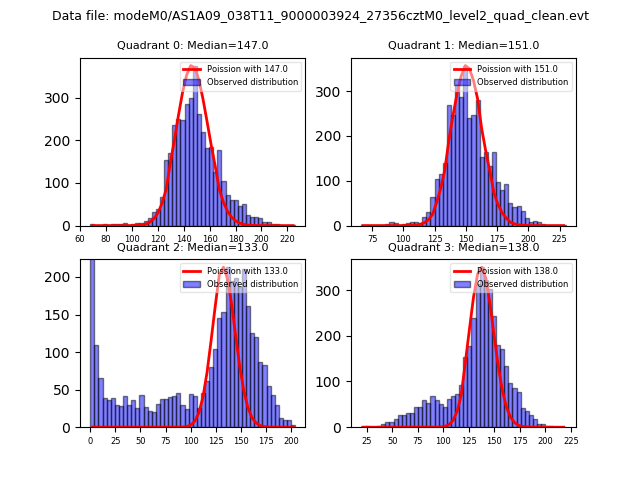 |
 |
| Quadrant-wise count rates Data is divided into 100 sec bins |
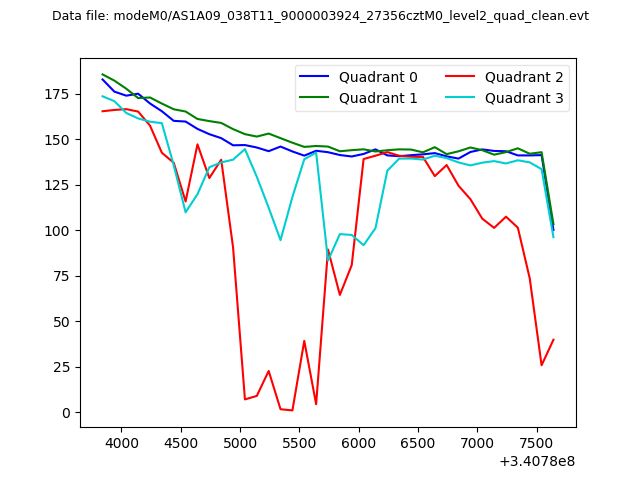 |
|
| Module-wise count rates for Quadrant A Data is divided into 100 sec bins |
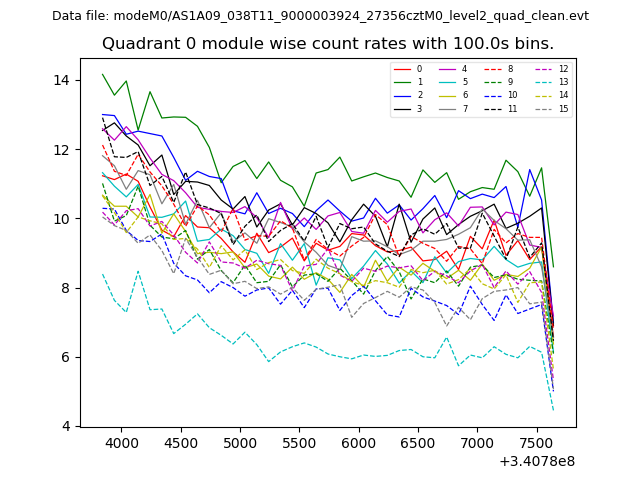 |
 |
| Module-wise count rates for Quadrant B Data is divided into 100 sec bins |
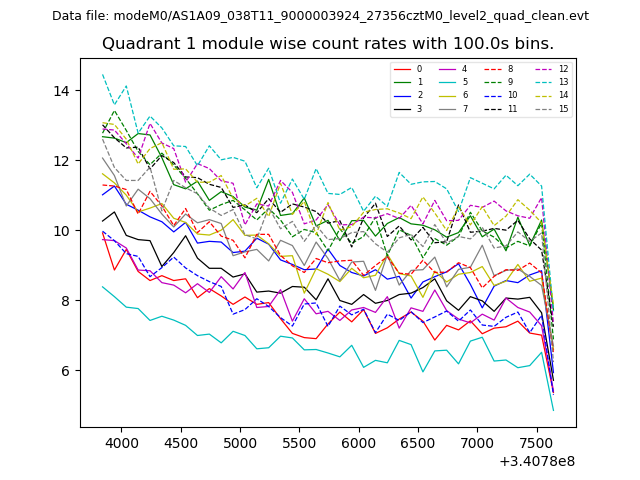 |
 |
| Module-wise count rates for Quadrant C Data is divided into 100 sec bins |
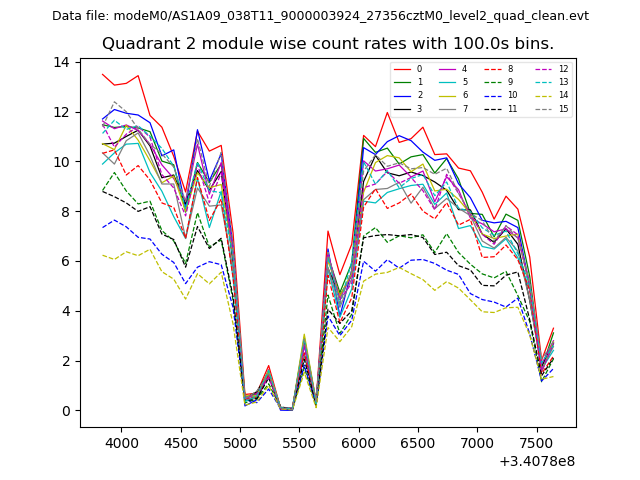 |
 |
| Module-wise count rates for Quadrant D Data is divided into 100 sec bins |
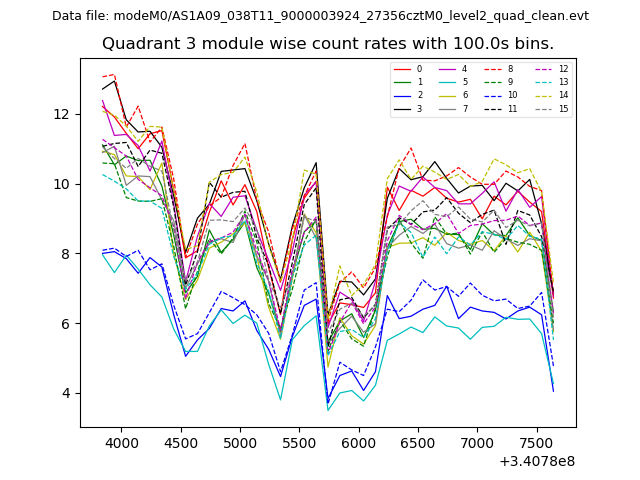 |
 |
| Parameter | Plot |
|---|---|
| CZT HV Monitor | 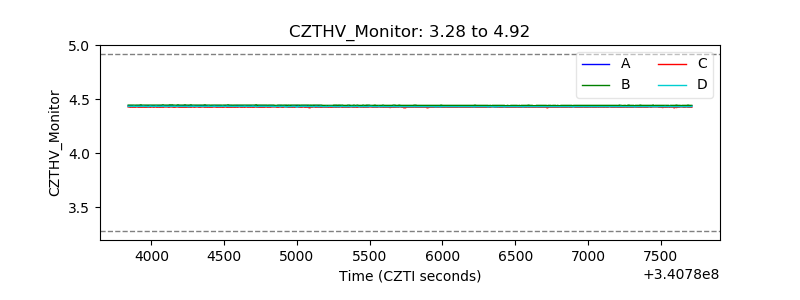 |
| D_VDD | 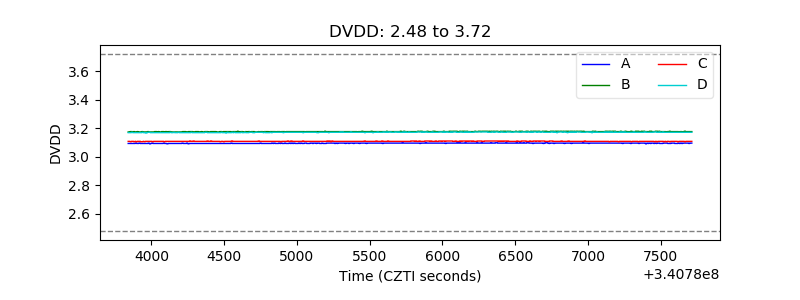 |
| Temperature 1 | 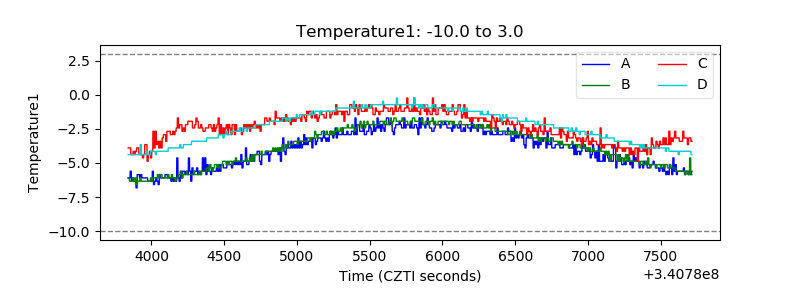 |
| Veto HV Monitor | 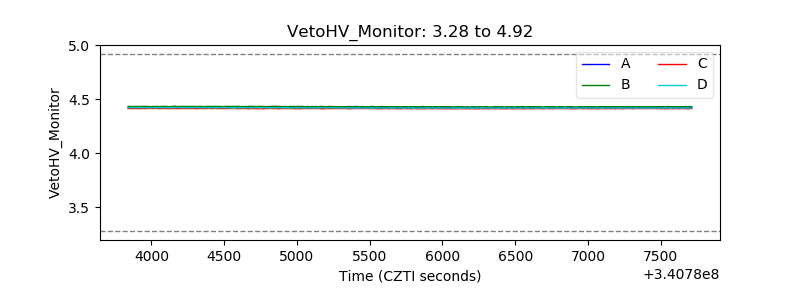 |
| Veto LLD | 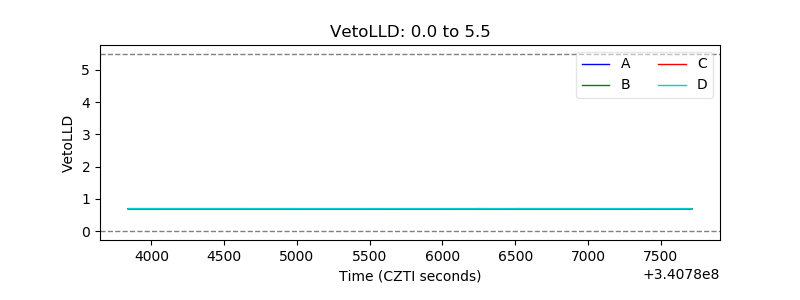 |
| Alpha Counter | 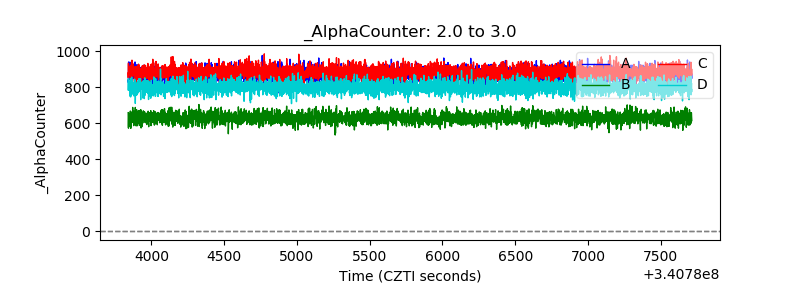 |
| _CPM_Rate | 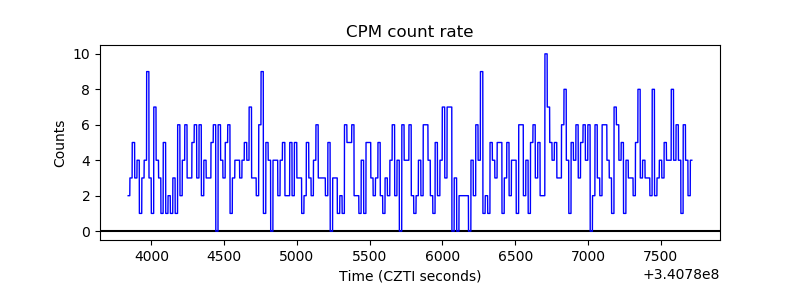 |
| CZT Counter |  |
| +2.5 Volts monitor |  |
| +5 Volts monitor |  |
| _ROLL_ROT | 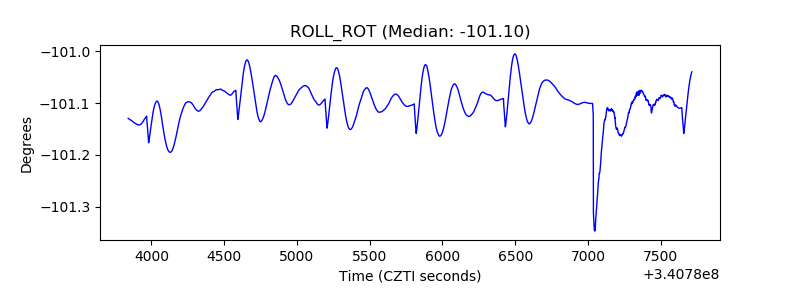 |
| _Roll_DEC | 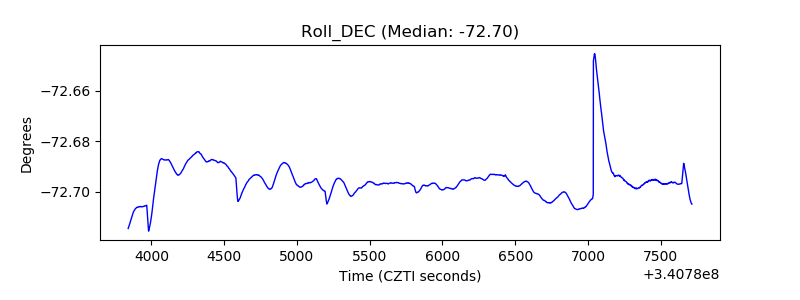 |
| _Roll_RA |  |
| Veto Counter | 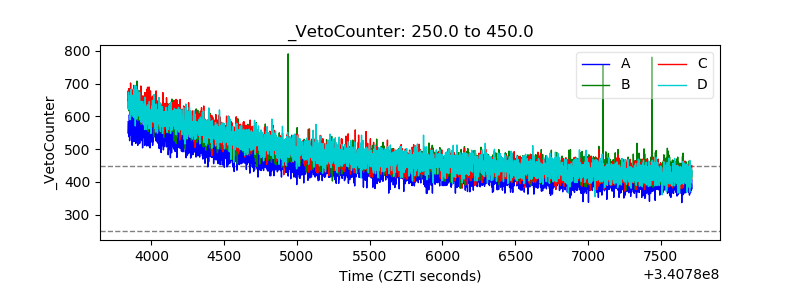 |