| Param | Original file | Final file |
|---|---|---|
| Filename | modeM0/AS1A09_038T12_9000003926_27356cztM0_level2.evt | modeM0/AS1A09_038T12_9000003926_27356cztM0_level2_quad_clean.evt |
| Size (bytes) | 172,175,040 | 37,298,880 |
| Size | 164.2 MB | 35.6 MB |
| Events in quadrant A | 984,824 | 264,976 |
| Events in quadrant B | 982,558 | 270,682 |
| Events in quadrant C | 1,232,872 | 248,052 |
| Events in quadrant D | 1,904,362 | 228,669 |
| Mode M9 | |||
|---|---|---|---|
| Quadrant | BADHDUFLAG | Total packets | Discarded packets |
| A | 0 | 13 | 0 |
| B | 0 | 13 | 0 |
| C | 0 | 13 | 0 |
| D | 0 | 13 | 0 |
| Mode M0 | |||
|---|---|---|---|
| Quadrant | BADHDUFLAG | Total packets | Discarded packets |
| A | 0 | 4051 | 0 |
| B | 0 | 4040 | 0 |
| C | 0 | 4886 | 0 |
| D | 0 | 6875 | 0 |
| Quadrant | Total seconds | Saturated seconds | Saturation percentage |
|---|---|---|---|
| A | 1586 | 54 | 3.404792% |
| B | 1586 | 80 | 5.044136% |
| C | 1586 | 169 | 10.655738% |
| D | 1586 | 524 | 33.039092% |
Noise dominated data is calculated using 1-second bins in cleaned event files. If a bin has >2000 counts, and if more than 50% of those come from <1% of pixels, then it is considered to be noise-dominated and hence unusable.
| Quadrant | # 1 sec bins | Bins with >0 counts | Bins with >2000 counts | High rate bins dominated by noise | Noise dominated (total time) | Noise dominated (detector-on time) | Marked lightcurve |
|---|---|---|---|---|---|---|---|
| A | 2831 | 1587 | 0 | 0 | 0.00% | 0.00% | 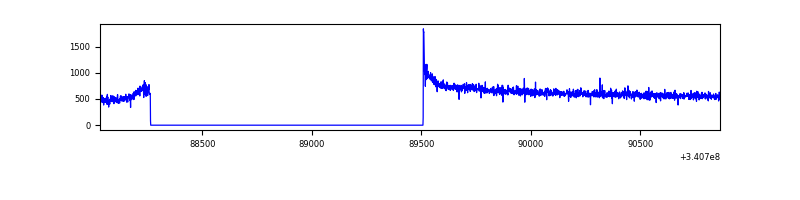 |
| B | 2831 | 1587 | 1 | 1 | 0.04% | 0.06% | 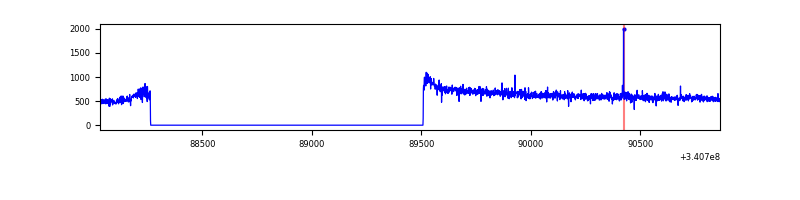 |
| C | 2831 | 1586 | 37 | 37 | 1.31% | 2.33% | 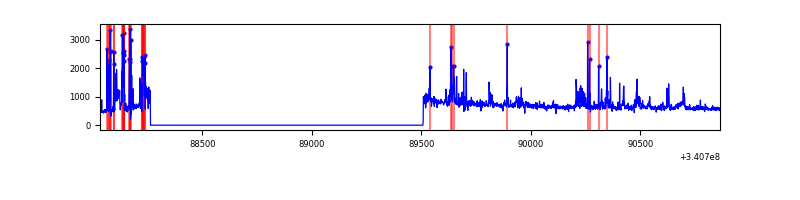 |
| D | 2831 | 1587 | 462 | 462 | 16.32% | 29.11% | 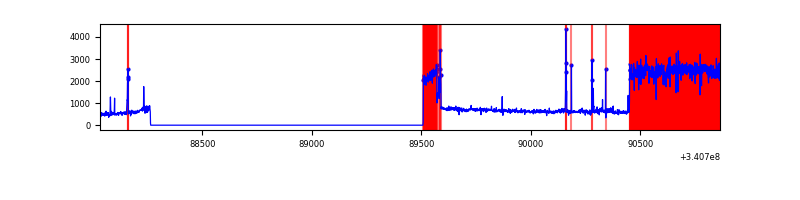 |
Top three noisy pixels from each quadrant. If the there are fewer than three noisy pixels in the level2.evt file, extra rows are filled as -1
| Pixel properties | Quadrant properties | ||||||
|---|---|---|---|---|---|---|---|
| Quadrant | DetID | PixID | Counts | Sigma | Mean | Median | Sigma |
| A | 8 | 192 | 5595 | 105.93 | 253 | 249 | 50.5 |
| A | 13 | 254 | 2379 | 42.2 | 253 | 249 | 50.5 |
| A | 0 | 226 | 2230 | 39.25 | 253 | 249 | 50.5 |
| B | 12 | 111 | 5080 | 101.57 | 250 | 245 | 47.6 |
| B | 0 | 190 | 4765 | 94.96 | 250 | 245 | 47.6 |
| B | 11 | 111 | 4597 | 91.43 | 250 | 245 | 47.6 |
| C | 2 | 16 | 205164 | 3670.09 | 241 | 244 | 55.8 |
| C | 15 | 208 | 48283 | 860.37 | 241 | 244 | 55.8 |
| C | 14 | 238 | 38821 | 690.91 | 241 | 244 | 55.8 |
| D | 1 | 52 | 1065715 | 20502.73 | 219 | 215 | 52.0 |
| D | 2 | 250 | 6765 | 126.04 | 219 | 215 | 52.0 |
| D | 2 | 234 | 4571 | 83.82 | 219 | 215 | 52.0 |
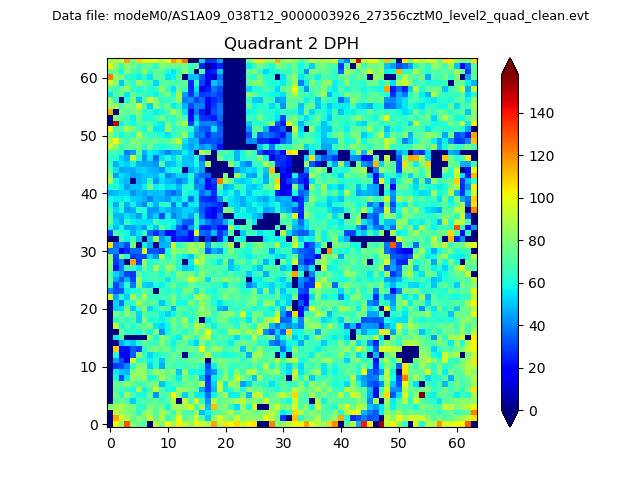
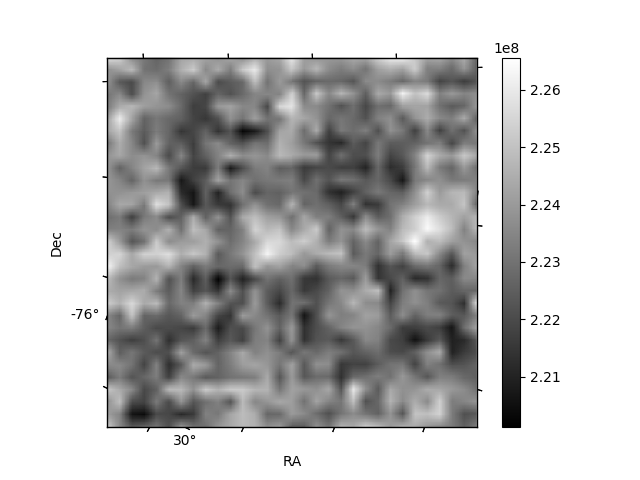
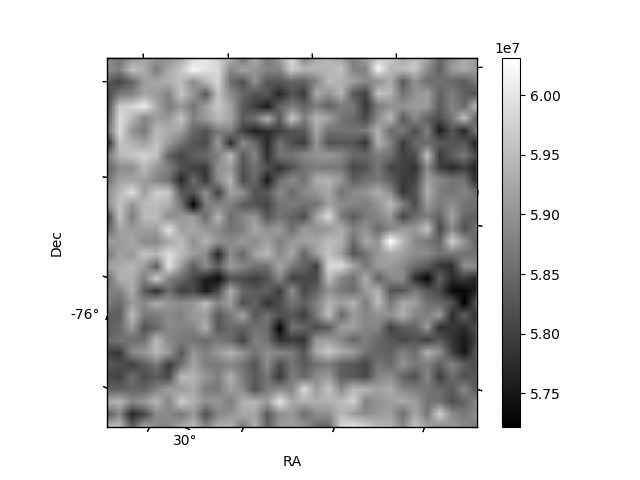
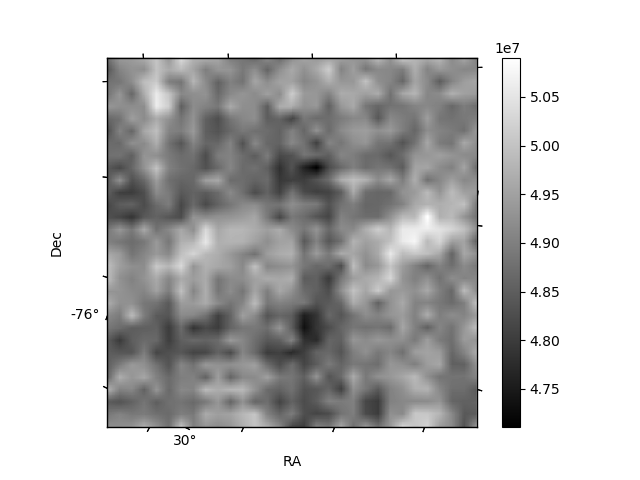
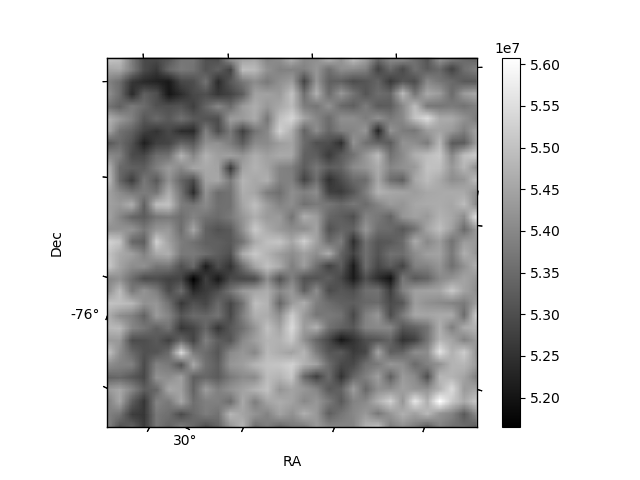
Histogram calculated using DETX and DETY for each event in the final _common_clean file
| Quadrant A | 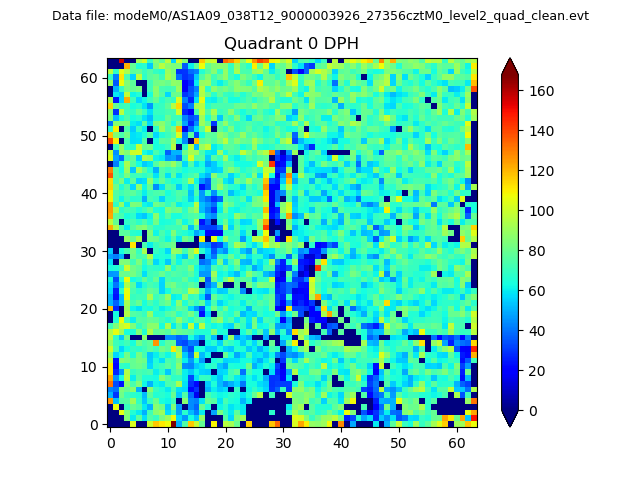 |
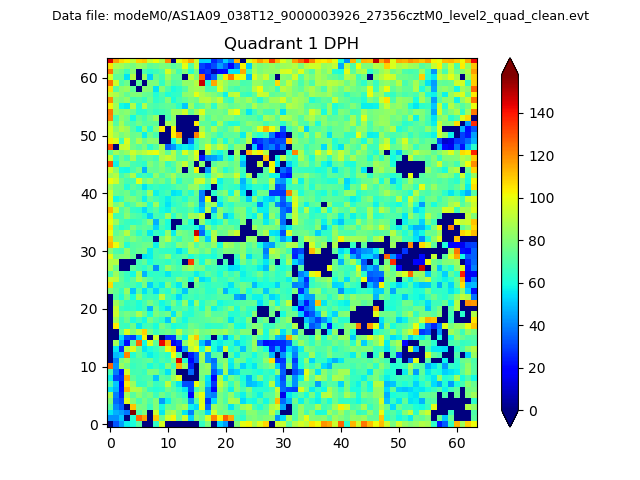 |
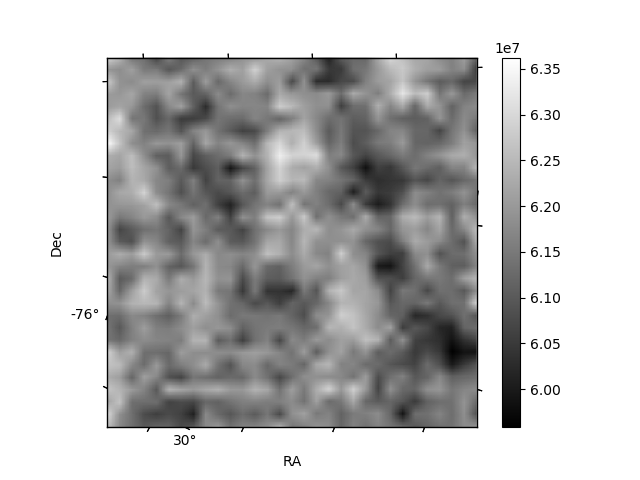
Quadrant B |
|---|---|---|---|
| Quadrant D | 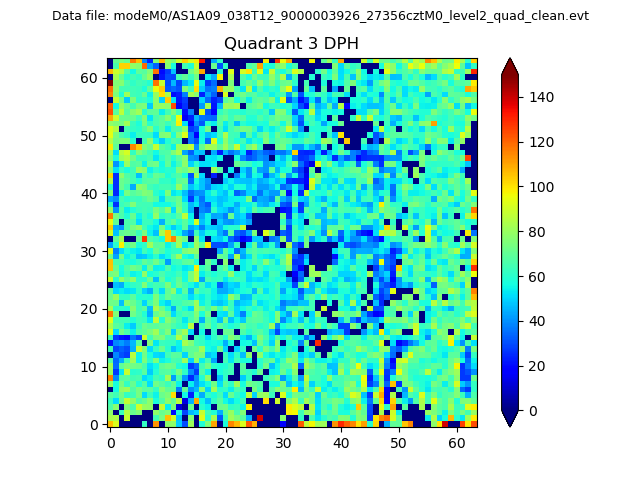 |
 |
Quadrant C |
| Plot type | Count rate plots | Images |
|---|---|---|
| Comparison with Poisson distribution Blue bars denote a histogram of data divided into 1 sec bins. Red curve is a Poisson curve with rate = median count rate of data. |
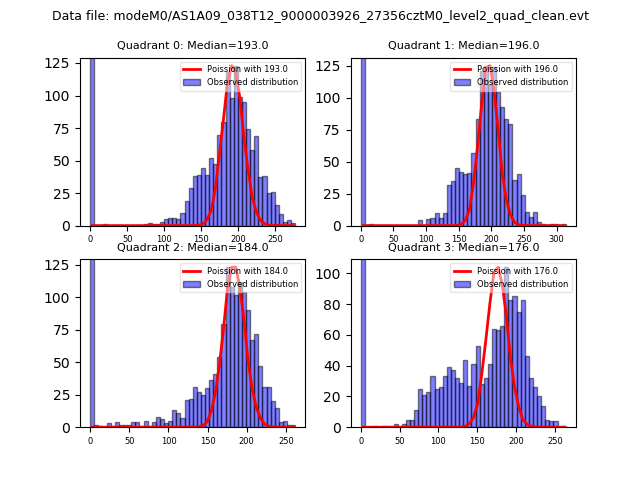 |
 |
| Quadrant-wise count rates Data is divided into 100 sec bins |
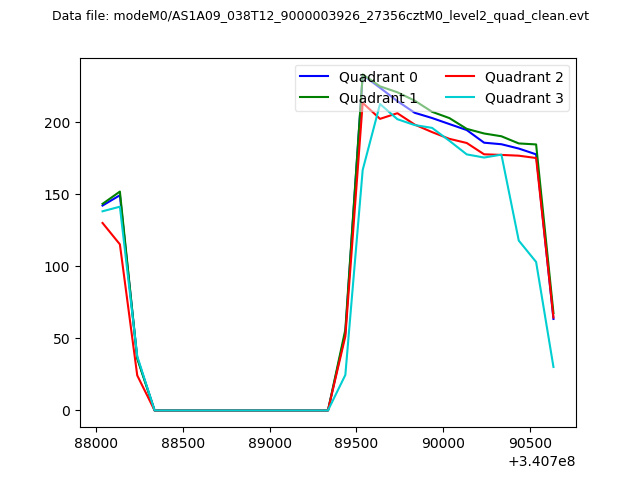 |
|
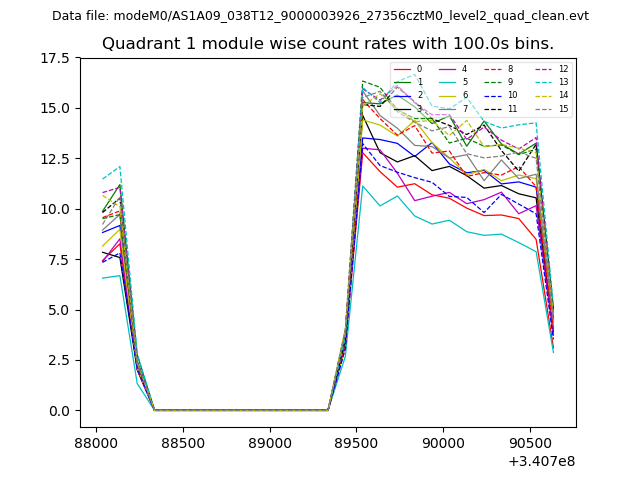
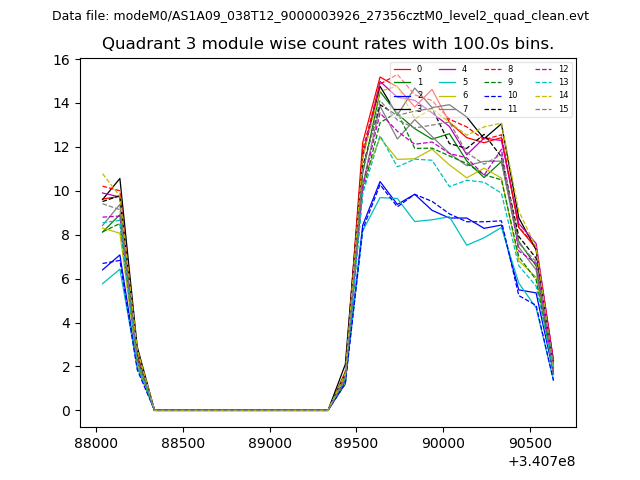
| Module-wise count rates for Quadrant A Data is divided into 100 sec bins |
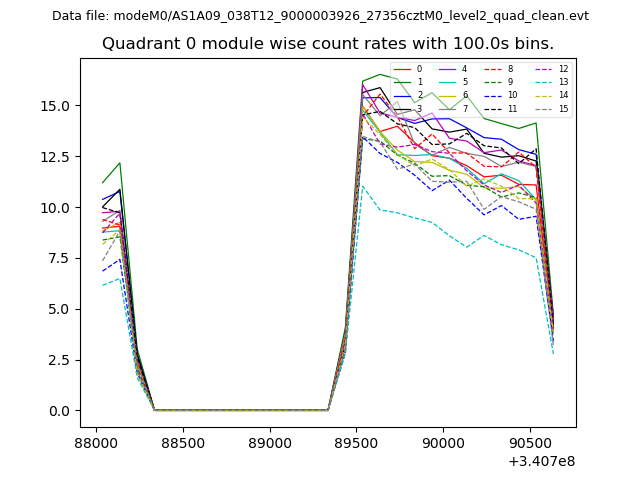 |
 |
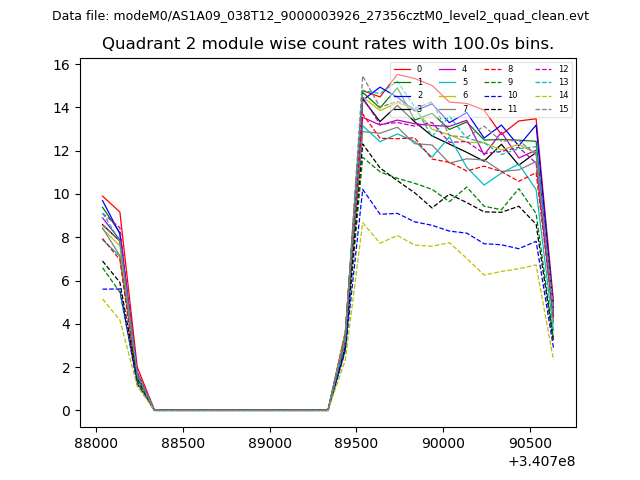
| Module-wise count rates for Quadrant B Data is divided into 100 sec bins |
 |
 |
| Module-wise count rates for Quadrant C Data is divided into 100 sec bins |
 |
 |
| Module-wise count rates for Quadrant D Data is divided into 100 sec bins |
 |
 |
| Parameter | Plot |
|---|---|
| CZT HV Monitor | 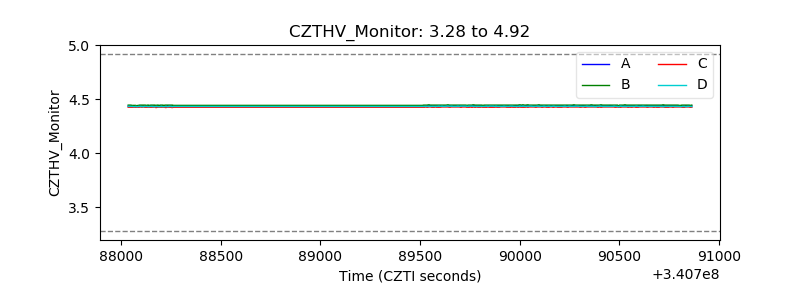 |
| D_VDD | 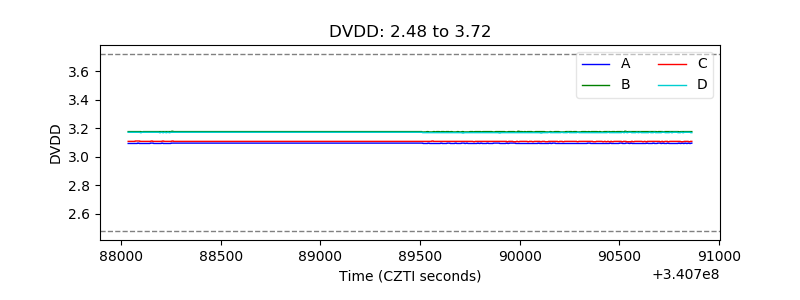 |
| Temperature 1 | 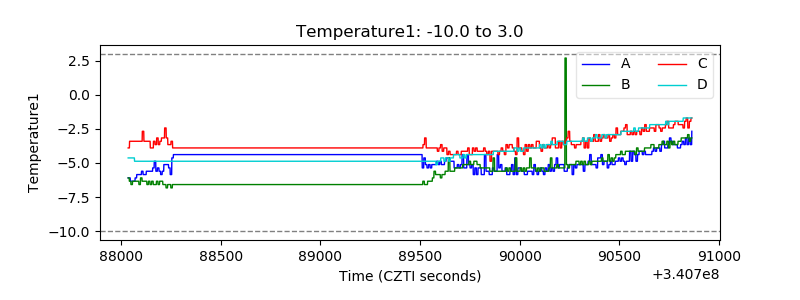 |
| Veto HV Monitor | 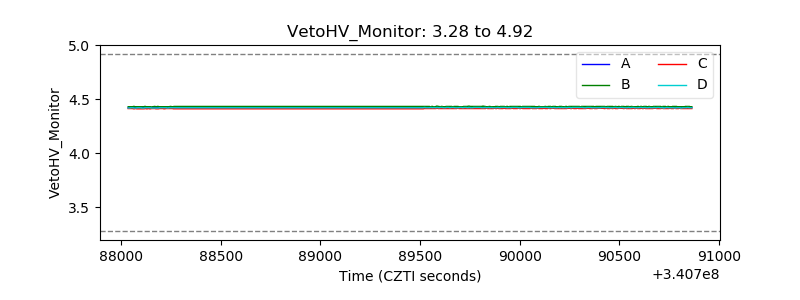 |
| Veto LLD | 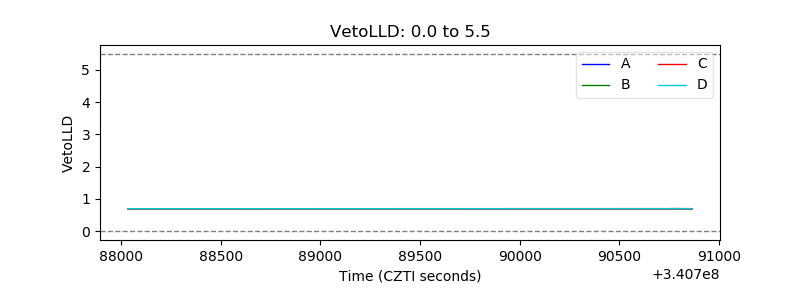 |
| Alpha Counter | 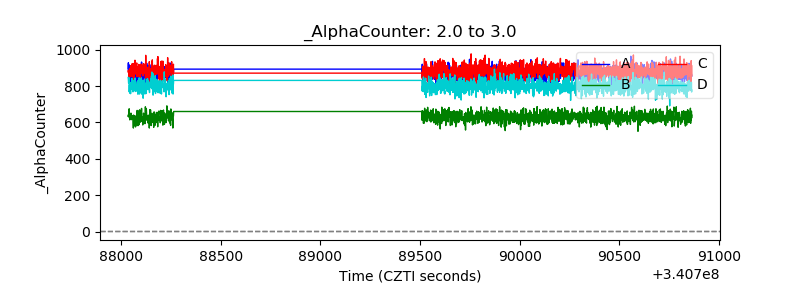 |
| _CPM_Rate | 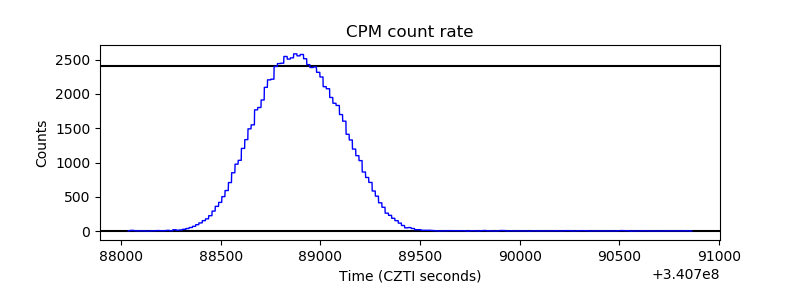 |
| CZT Counter | 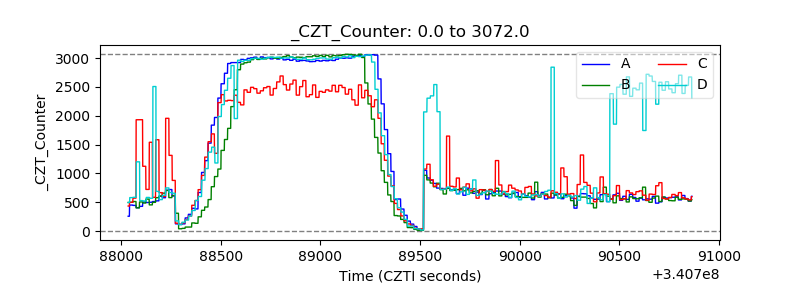 |
| +2.5 Volts monitor | 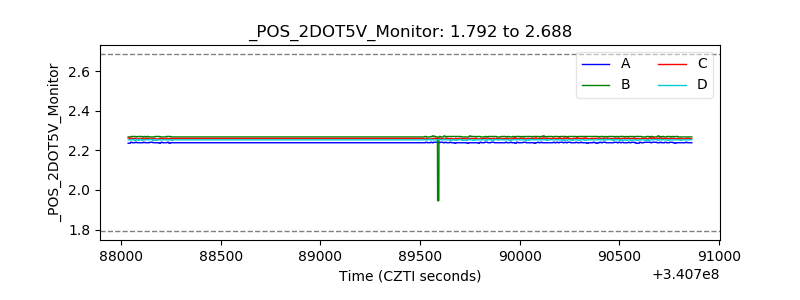 |
| +5 Volts monitor |  |
| _ROLL_ROT | 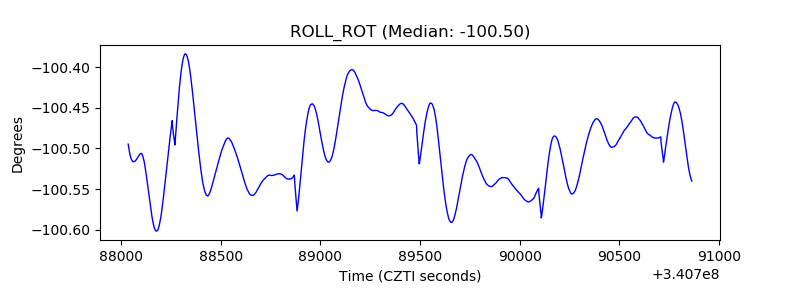 |
| _Roll_DEC | 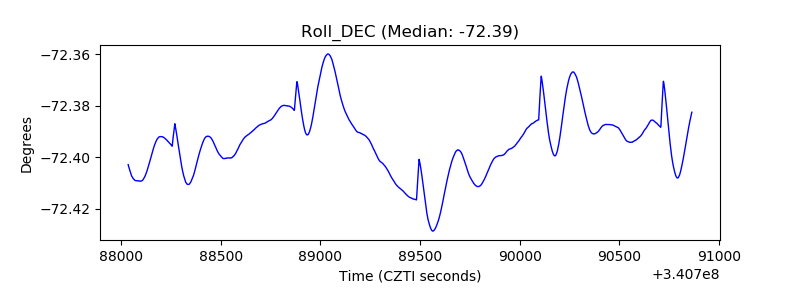 |
| _Roll_RA | 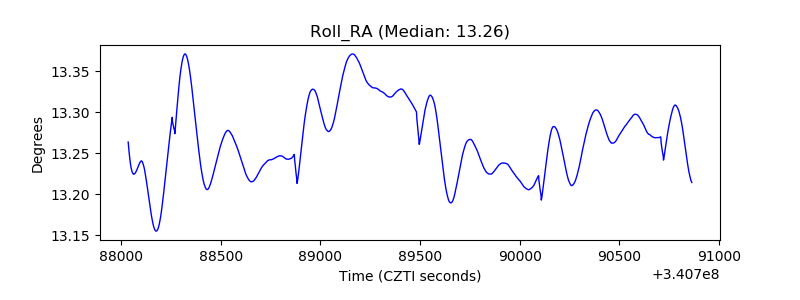 |
| Veto Counter | 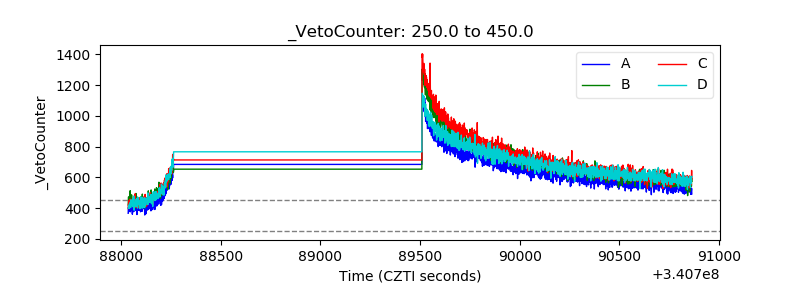 |