| Param | Original file | Final file |
|---|---|---|
| Filename | modeM0/AS1A09_038T12_9000003926_27357cztM0_level2.evt | modeM0/AS1A09_038T12_9000003926_27357cztM0_level2_quad_clean.evt |
| Size (bytes) | 513,656,640 | 113,777,280 |
| Size | 489.9 MB | 108.5 MB |
| Events in quadrant A | 2,971,005 | 789,977 |
| Events in quadrant B | 3,050,756 | 802,966 |
| Events in quadrant C | 3,482,175 | 761,904 |
| Events in quadrant D | 5,678,072 | 704,849 |
| Mode M9 | |||
|---|---|---|---|
| Quadrant | BADHDUFLAG | Total packets | Discarded packets |
| A | 0 | 12 | 0 |
| B | 0 | 12 | 0 |
| C | 0 | 12 | 0 |
| D | 0 | 12 | 0 |
| Mode M0 | |||
|---|---|---|---|
| Quadrant | BADHDUFLAG | Total packets | Discarded packets |
| A | 0 | 12187 | 0 |
| B | 0 | 12420 | 0 |
| C | 0 | 13980 | 0 |
| D | 0 | 20545 | 0 |
| Quadrant | Total seconds | Saturated seconds | Saturation percentage |
|---|---|---|---|
| A | 5508 | 85 | 1.543210% |
| B | 5509 | 121 | 2.196406% |
| C | 5509 | 249 | 4.519877% |
| D | 5509 | 1174 | 21.310583% |
Noise dominated data is calculated using 1-second bins in cleaned event files. If a bin has >2000 counts, and if more than 50% of those come from <1% of pixels, then it is considered to be noise-dominated and hence unusable.
| Quadrant | # 1 sec bins | Bins with >0 counts | Bins with >2000 counts | High rate bins dominated by noise | Noise dominated (total time) | Noise dominated (detector-on time) | Marked lightcurve |
|---|---|---|---|---|---|---|---|
| A | 6803 | 5508 | 0 | 0 | 0.00% | 0.00% | 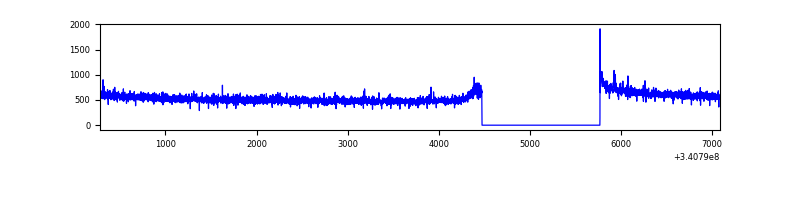 |
| B | 6804 | 5509 | 7 | 7 | 0.10% | 0.13% | 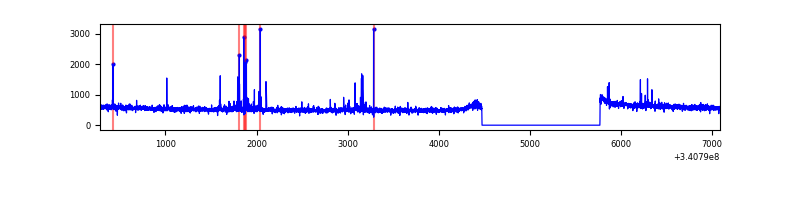 |
| C | 6804 | 5510 | 46 | 46 | 0.68% | 0.83% | 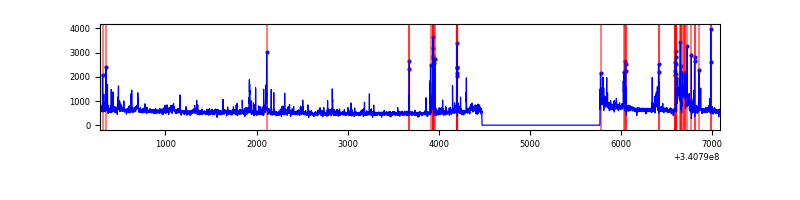 |
| D | 6804 | 5509 | 1033 | 1033 | 15.18% | 18.75% | 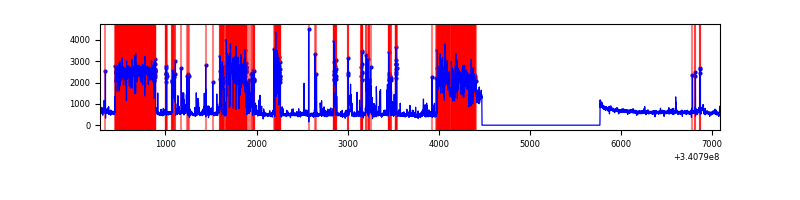 |
Top three noisy pixels from each quadrant. If the there are fewer than three noisy pixels in the level2.evt file, extra rows are filled as -1
| Pixel properties | Quadrant properties | ||||||
|---|---|---|---|---|---|---|---|
| Quadrant | DetID | PixID | Counts | Sigma | Mean | Median | Sigma |
| A | 13 | 254 | 8740 | 53.78 | 766 | 753 | 148.5 |
| A | 0 | 226 | 6698 | 40.03 | 766 | 753 | 148.5 |
| A | 3 | 137 | 6378 | 37.88 | 766 | 753 | 148.5 |
| B | 15 | 32 | 50277 | 362.24 | 754 | 738 | 136.8 |
| B | 0 | 190 | 21194 | 149.58 | 754 | 738 | 136.8 |
| B | 12 | 111 | 15595 | 108.64 | 754 | 738 | 136.8 |
| C | 2 | 16 | 491393 | 2980.16 | 726 | 732 | 164.6 |
| C | 14 | 238 | 119397 | 720.74 | 726 | 732 | 164.6 |
| C | 15 | 208 | 41583 | 248.12 | 726 | 732 | 164.6 |
| D | 1 | 52 | 2717521 | 16817.51 | 689 | 675 | 161.5 |
| D | 2 | 250 | 129450 | 797.13 | 689 | 675 | 161.5 |
| D | 10 | 103 | 110541 | 680.08 | 689 | 675 | 161.5 |
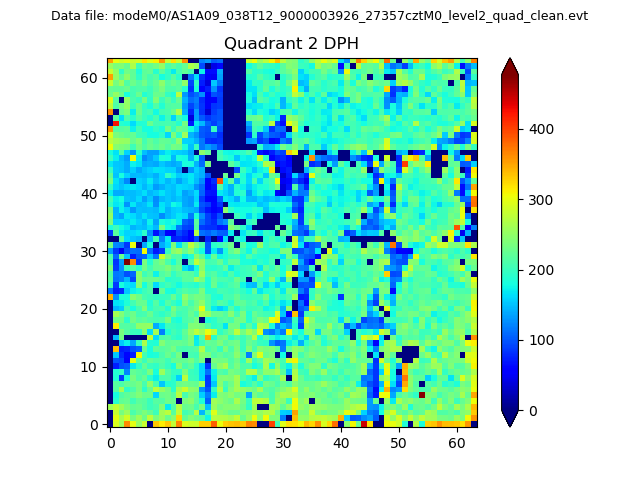
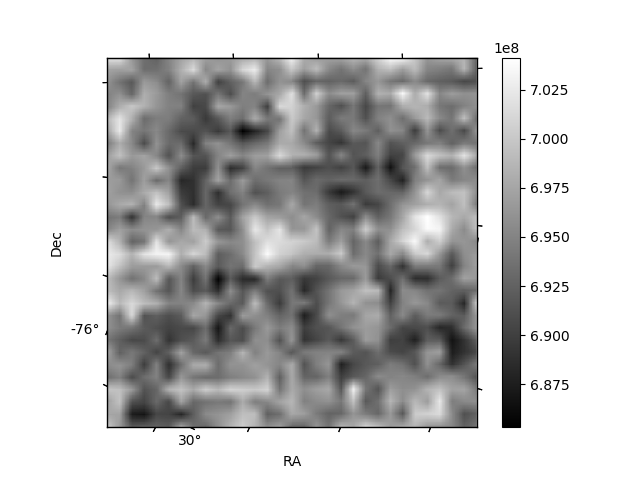
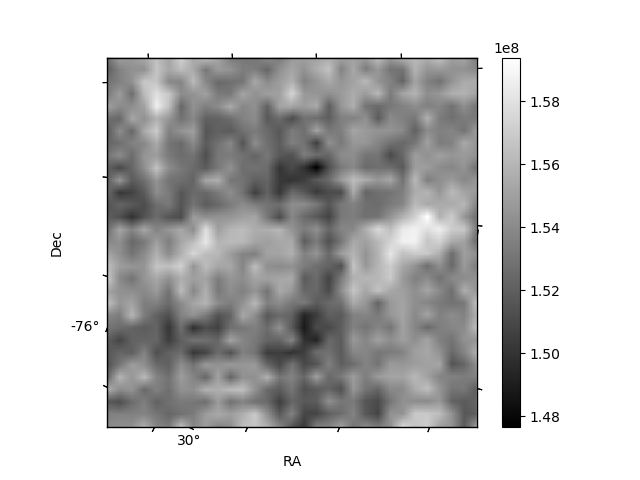
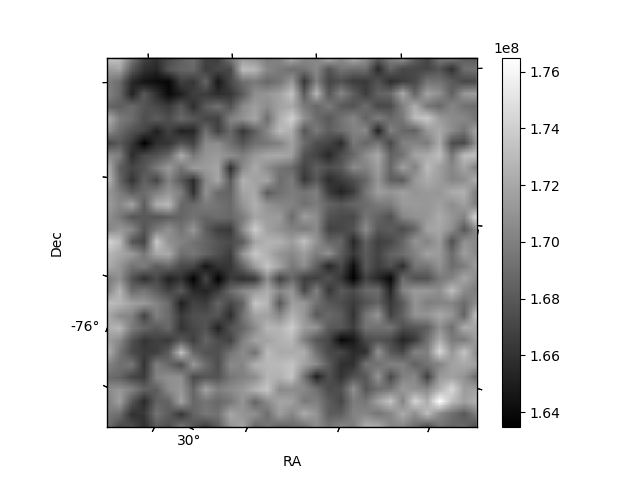
Histogram calculated using DETX and DETY for each event in the final _common_clean file
| Quadrant A | 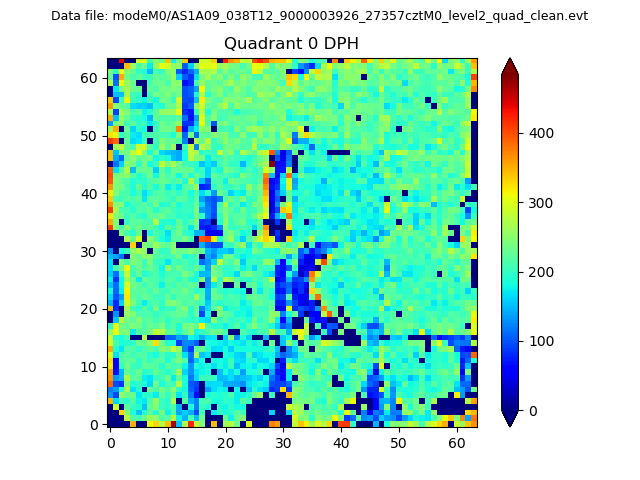 |
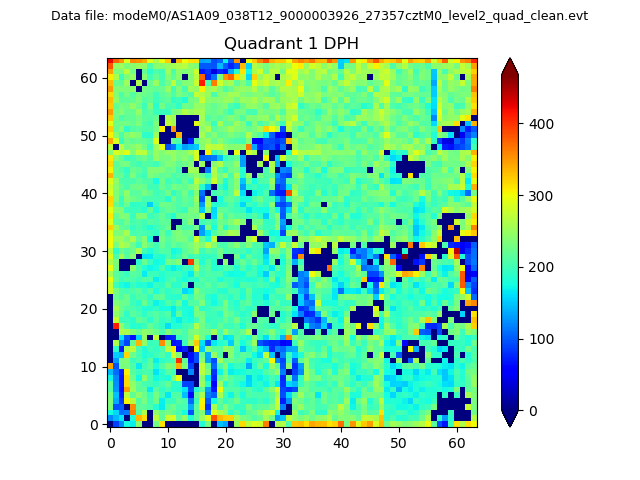 |
Quadrant B |
|---|---|---|---|
| Quadrant D | 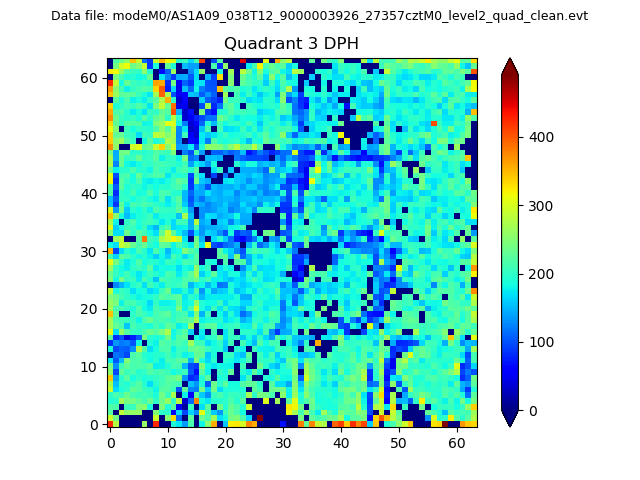 |
 |
Quadrant C |
| Plot type | Count rate plots | Images |
|---|---|---|
| Comparison with Poisson distribution Blue bars denote a histogram of data divided into 1 sec bins. Red curve is a Poisson curve with rate = median count rate of data. |
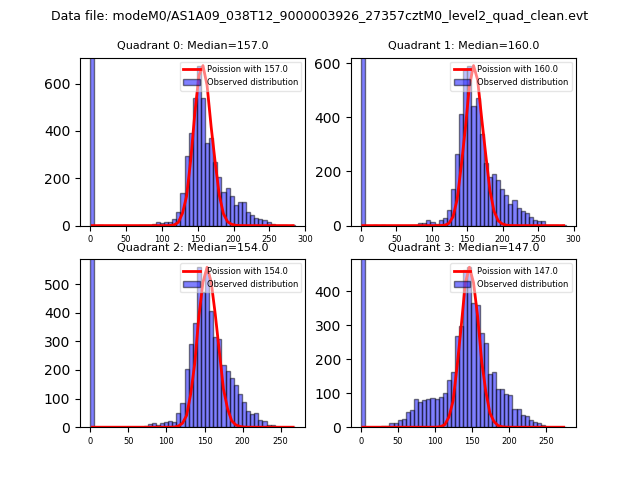 |
 |
| Quadrant-wise count rates Data is divided into 100 sec bins |
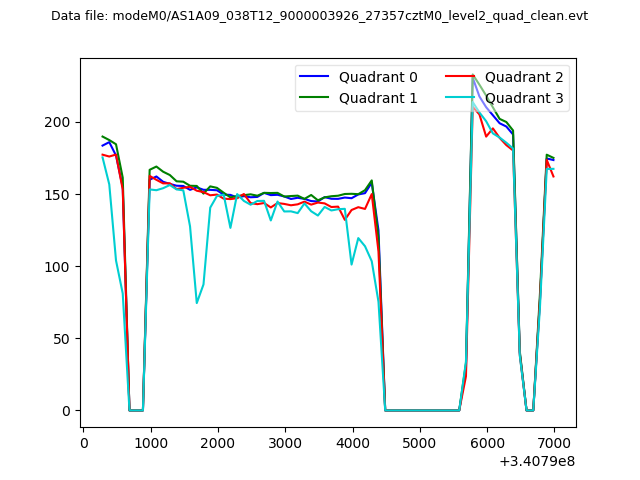 |
|
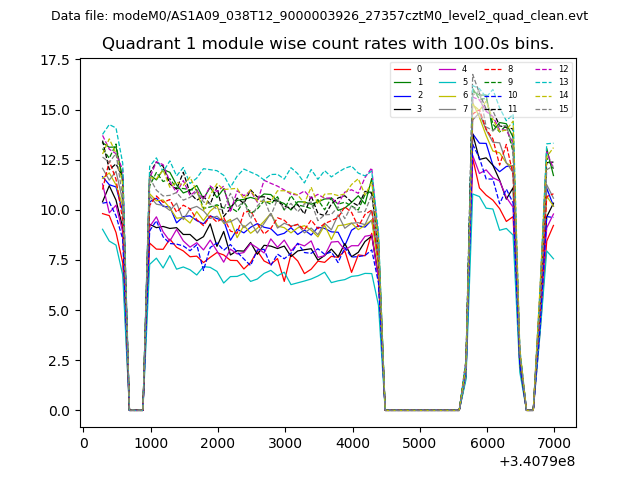
| Module-wise count rates for Quadrant A Data is divided into 100 sec bins |
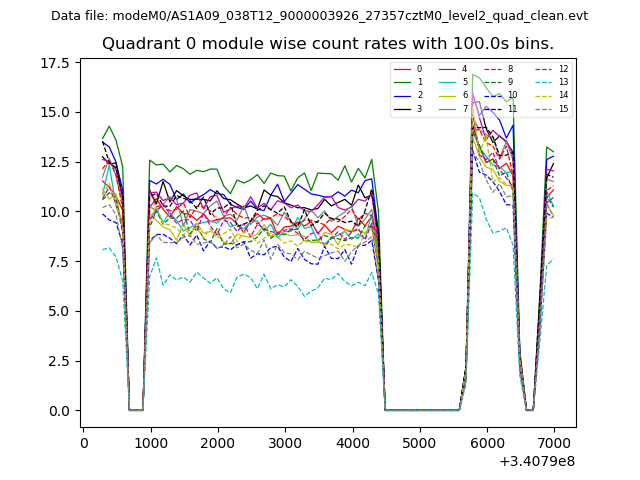 |
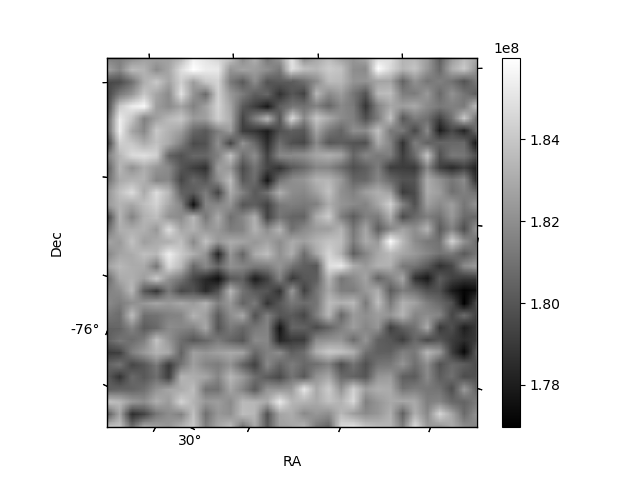 |
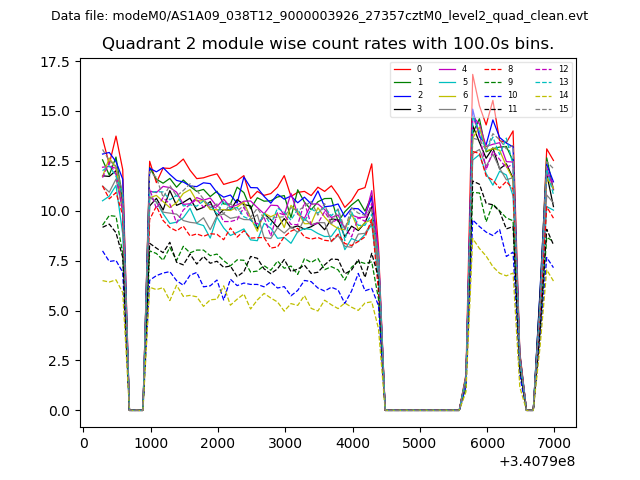
| Module-wise count rates for Quadrant B Data is divided into 100 sec bins |
 |
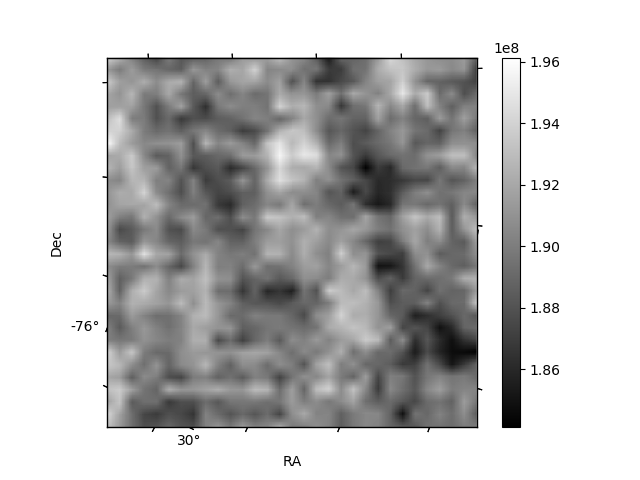 |
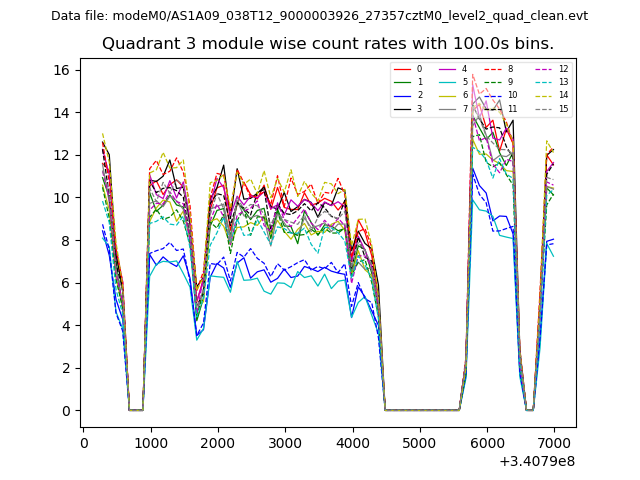
| Module-wise count rates for Quadrant C Data is divided into 100 sec bins |
 |
 |
| Module-wise count rates for Quadrant D Data is divided into 100 sec bins |
 |
 |
| Parameter | Plot |
|---|---|
| CZT HV Monitor | 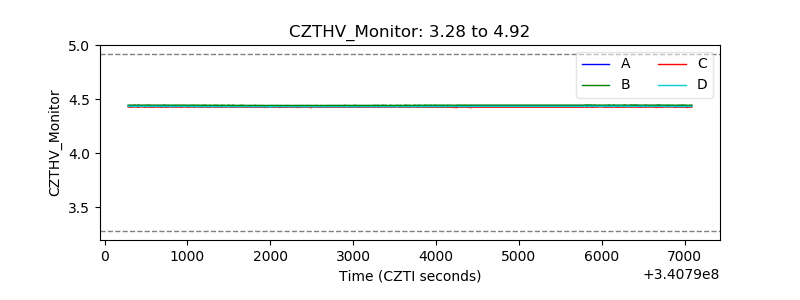 |
| D_VDD | 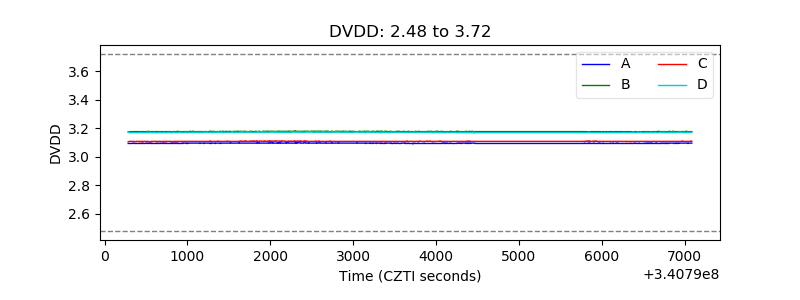 |
| Temperature 1 | 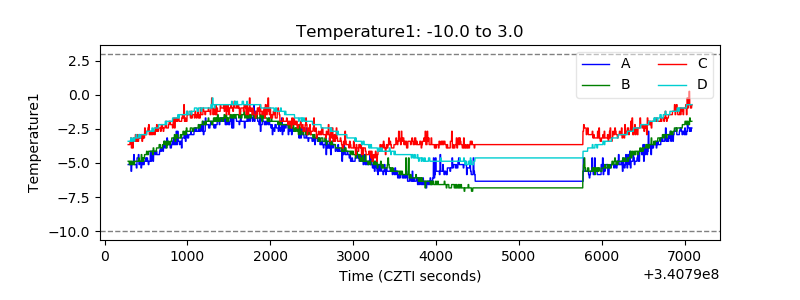 |
| Veto HV Monitor | 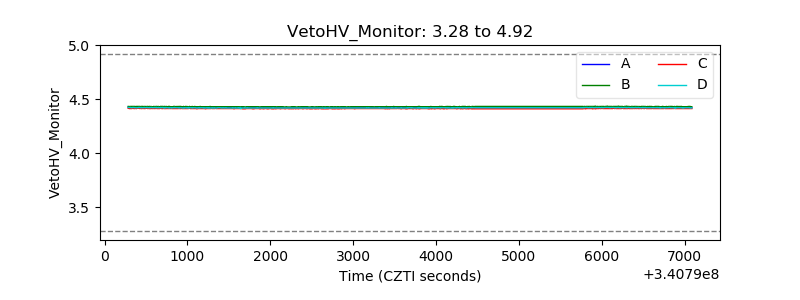 |
| Veto LLD | 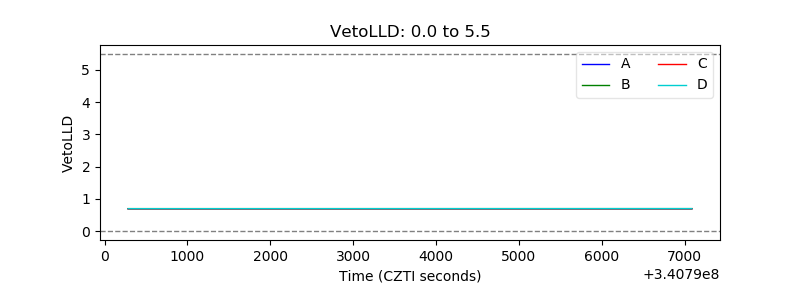 |
| Alpha Counter | 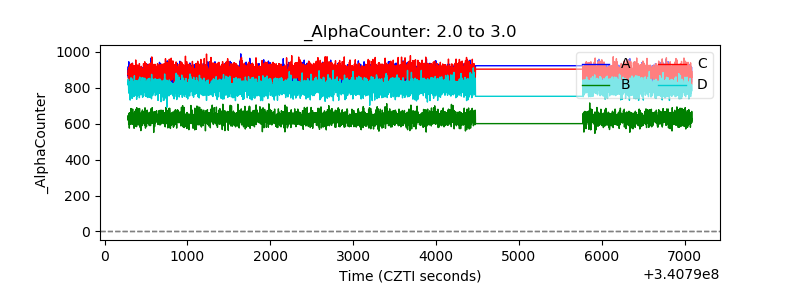 |
| _CPM_Rate | 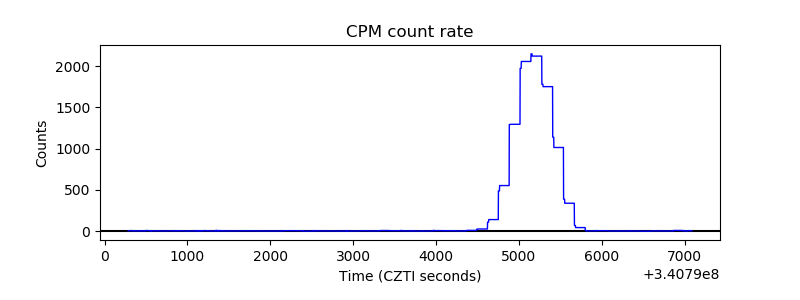 |
| CZT Counter | 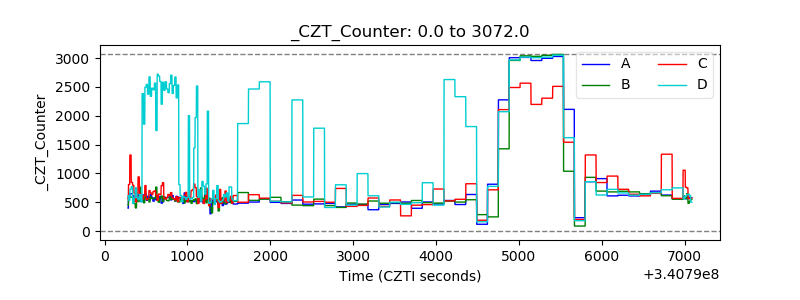 |
| +2.5 Volts monitor |  |
| +5 Volts monitor |  |
| _ROLL_ROT | 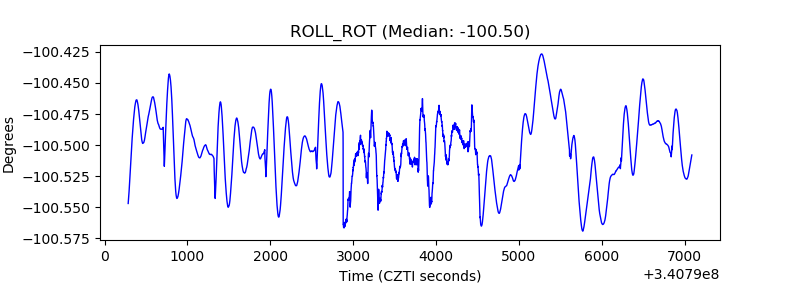 |
| _Roll_DEC | 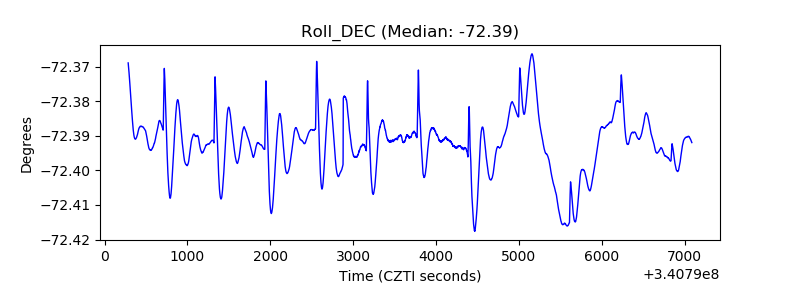 |
| _Roll_RA | 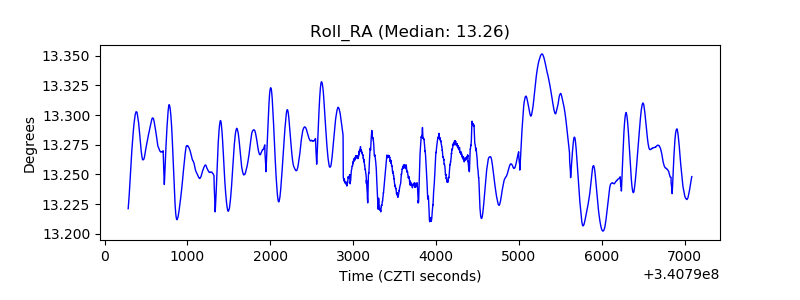 |
| Veto Counter | 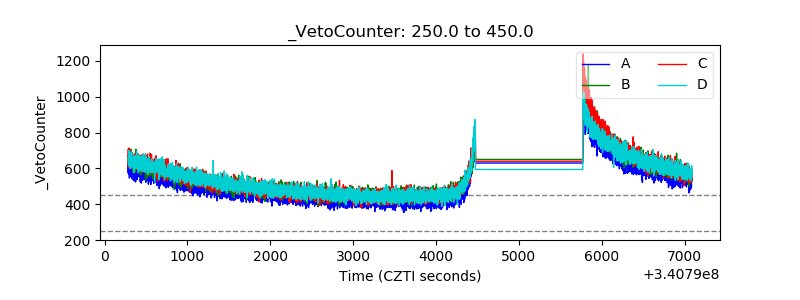 |