| Param | Original file | Final file |
|---|---|---|
| Filename | modeM0/AS1A09_038T12_9000003926_27358cztM0_level2.evt | modeM0/AS1A09_038T12_9000003926_27358cztM0_level2_quad_clean.evt |
| Size (bytes) | 269,040,960 | 66,144,960 |
| Size | 256.6 MB | 63.1 MB |
| Events in quadrant A | 1,677,997 | 458,800 |
| Events in quadrant B | 1,690,272 | 464,444 |
| Events in quadrant C | 2,547,100 | 424,984 |
| Events in quadrant D | 2,025,107 | 438,699 |
| Mode M0 | |||
|---|---|---|---|
| Quadrant | BADHDUFLAG | Total packets | Discarded packets |
| A | 0 | 6880 | 0 |
| B | 0 | 6961 | 0 |
| C | 0 | 9634 | 0 |
| D | 0 | 8140 | 0 |
| Quadrant | Total seconds | Saturated seconds | Saturation percentage |
|---|---|---|---|
| A | 3035 | 2 | 0.065898% |
| B | 3036 | 8 | 0.263505% |
| C | 3036 | 302 | 9.947299% |
| D | 3036 | 30 | 0.988142% |
Noise dominated data is calculated using 1-second bins in cleaned event files. If a bin has >2000 counts, and if more than 50% of those come from <1% of pixels, then it is considered to be noise-dominated and hence unusable.
| Quadrant | # 1 sec bins | Bins with >0 counts | Bins with >2000 counts | High rate bins dominated by noise | Noise dominated (total time) | Noise dominated (detector-on time) | Marked lightcurve |
|---|---|---|---|---|---|---|---|
| A | 3035 | 3035 | 0 | 0 | 0.00% | 0.00% |  |
| B | 3036 | 3036 | 0 | 0 | 0.00% | 0.00% |  |
| C | 3036 | 3036 | 216 | 216 | 7.11% | 7.11% | 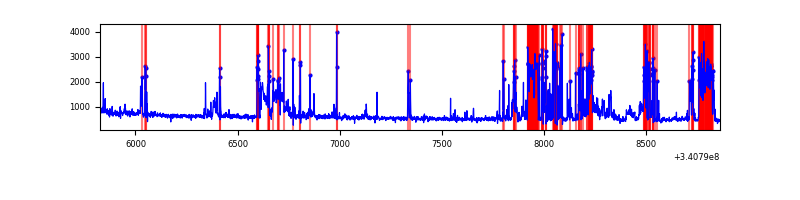 |
| D | 3036 | 3036 | 25 | 25 | 0.82% | 0.82% | 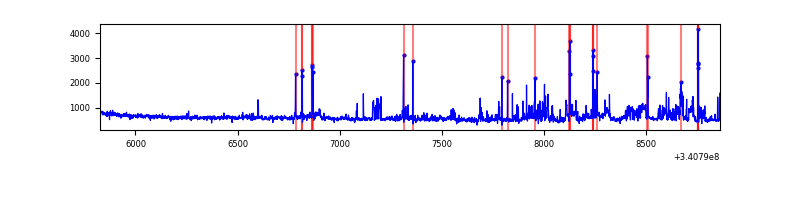 |
Top three noisy pixels from each quadrant. If the there are fewer than three noisy pixels in the level2.evt file, extra rows are filled as -1
| Pixel properties | Quadrant properties | ||||||
|---|---|---|---|---|---|---|---|
| Quadrant | DetID | PixID | Counts | Sigma | Mean | Median | Sigma |
| A | 15 | 174 | 5917 | 65.53 | 433 | 427 | 83.8 |
| A | 13 | 254 | 4761 | 51.73 | 433 | 427 | 83.8 |
| A | 0 | 226 | 3826 | 40.57 | 433 | 427 | 83.8 |
| B | 0 | 190 | 15682 | 197.47 | 422 | 414 | 77.3 |
| B | 15 | 32 | 13380 | 167.7 | 422 | 414 | 77.3 |
| B | 12 | 111 | 8416 | 103.5 | 422 | 414 | 77.3 |
| C | 2 | 16 | 924539 | 10213.53 | 396 | 400 | 90.5 |
| C | 14 | 238 | 66430 | 729.76 | 396 | 400 | 90.5 |
| C | 15 | 208 | 9833 | 104.25 | 396 | 400 | 90.5 |
| D | 1 | 52 | 411041 | 4057.7 | 415 | 407 | 101.2 |
| D | 12 | 227 | 15343 | 147.59 | 415 | 407 | 101.2 |
| D | 2 | 234 | 12167 | 116.21 | 415 | 407 | 101.2 |
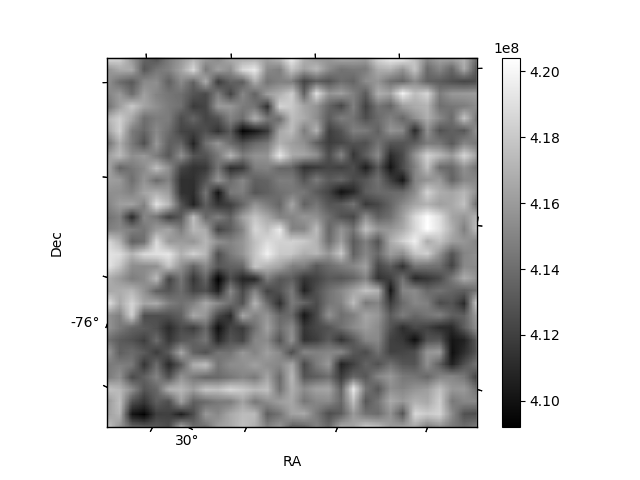
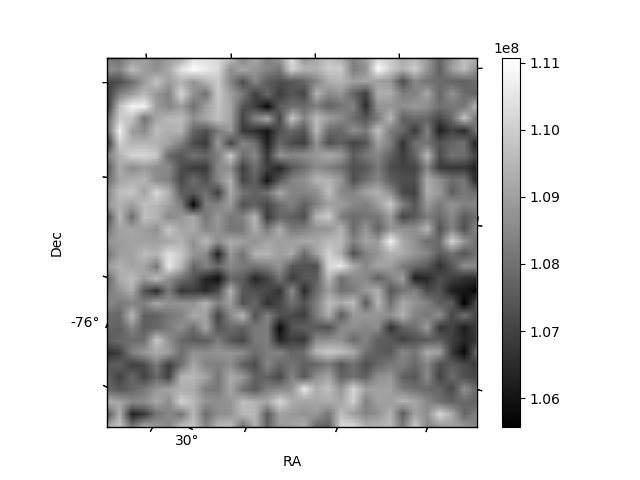
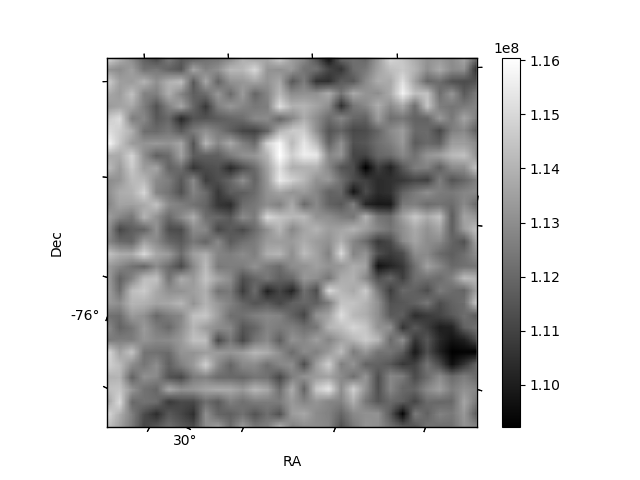
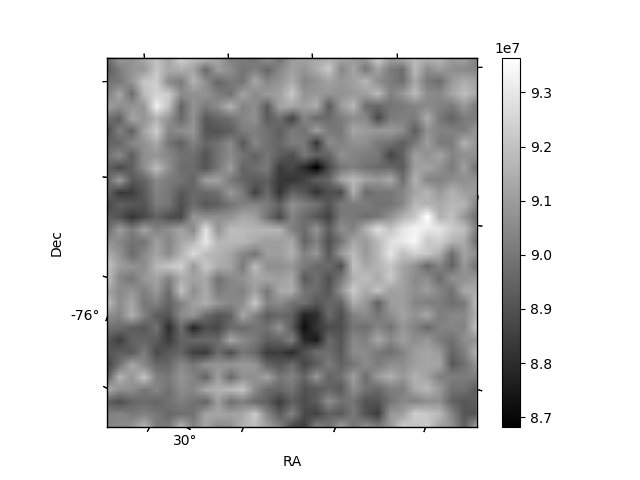
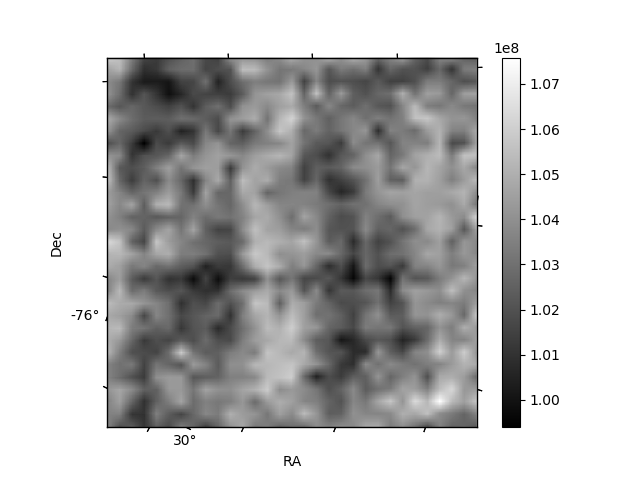
Histogram calculated using DETX and DETY for each event in the final _common_clean file
| Quadrant A |  |
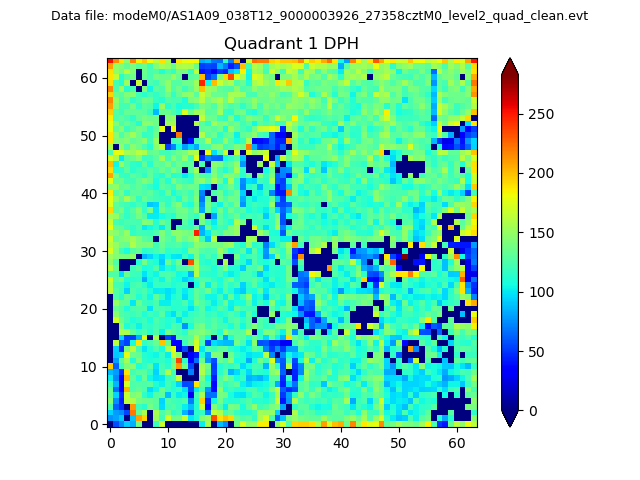 |
Quadrant B |
|---|---|---|---|
| Quadrant D | 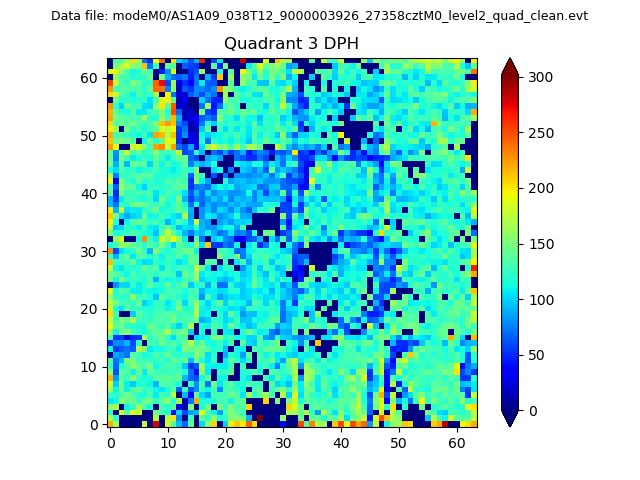 |
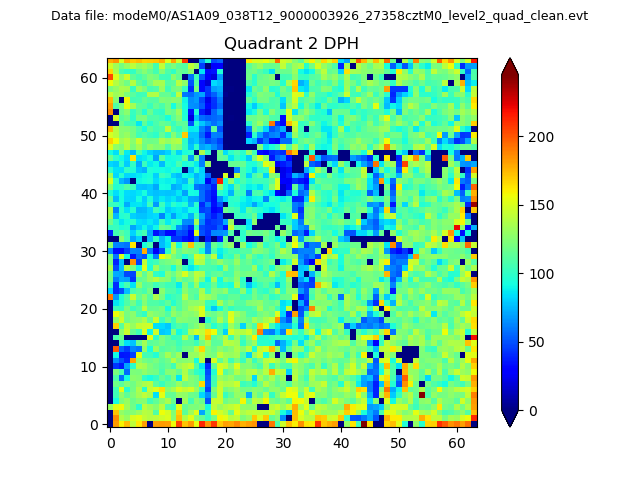 |
Quadrant C |
| Plot type | Count rate plots | Images |
|---|---|---|
| Comparison with Poisson distribution Blue bars denote a histogram of data divided into 1 sec bins. Red curve is a Poisson curve with rate = median count rate of data. |
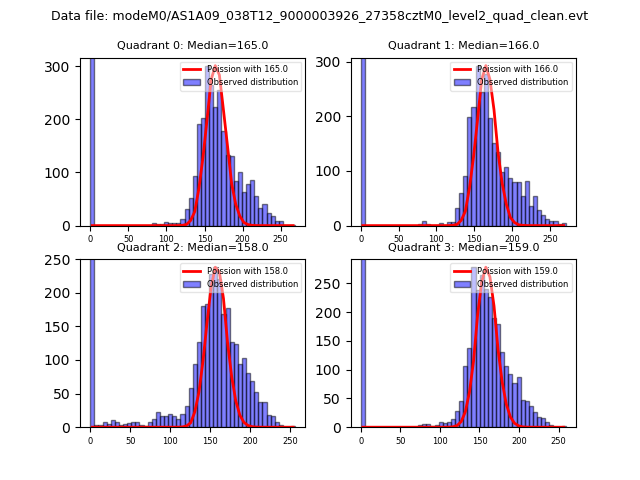 |
 |
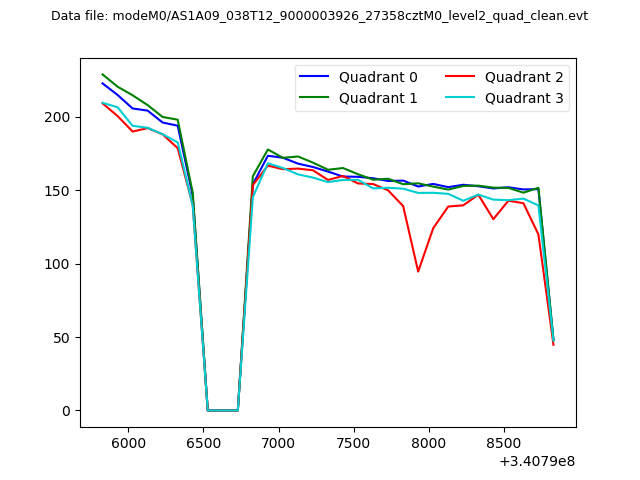
| Quadrant-wise count rates Data is divided into 100 sec bins |
 |
|
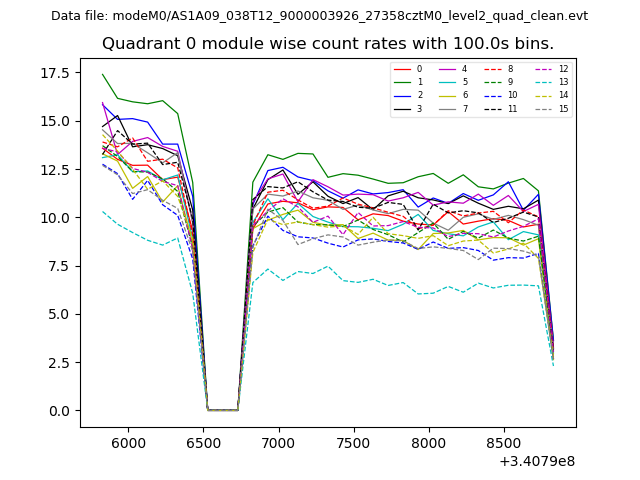
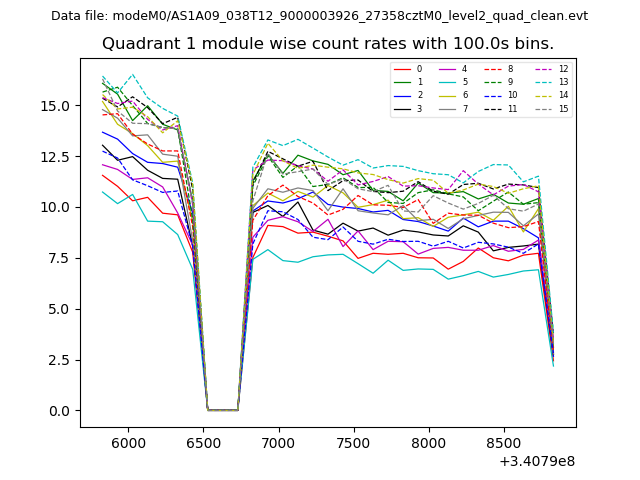
| Module-wise count rates for Quadrant A Data is divided into 100 sec bins |
 |
 |
| Module-wise count rates for Quadrant B Data is divided into 100 sec bins |
 |
 |
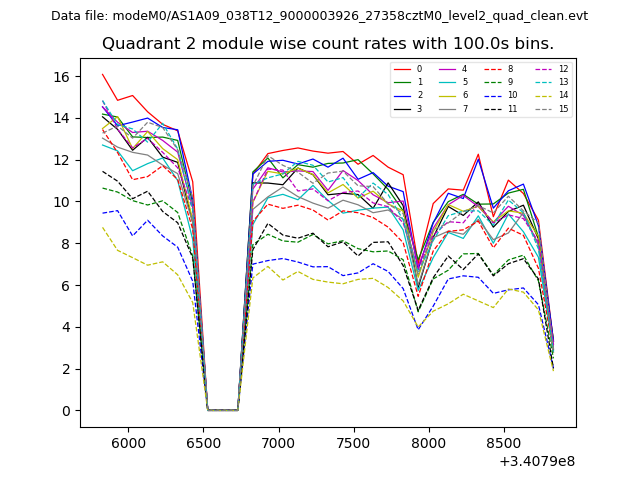
| Module-wise count rates for Quadrant C Data is divided into 100 sec bins |
 |
 |
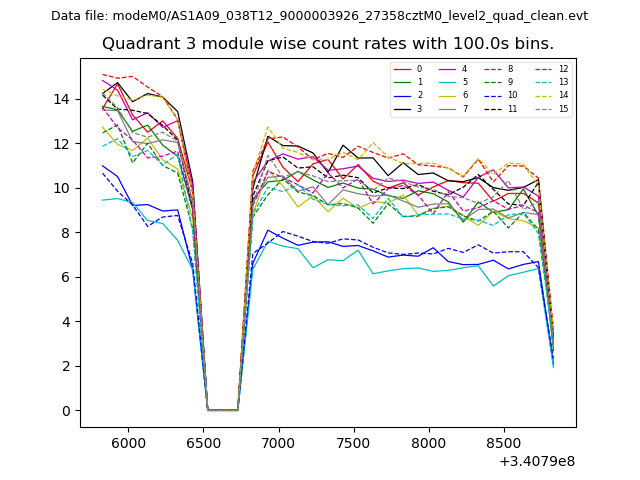
| Module-wise count rates for Quadrant D Data is divided into 100 sec bins |
 |
 |
| Parameter | Plot |
|---|---|
| CZT HV Monitor | 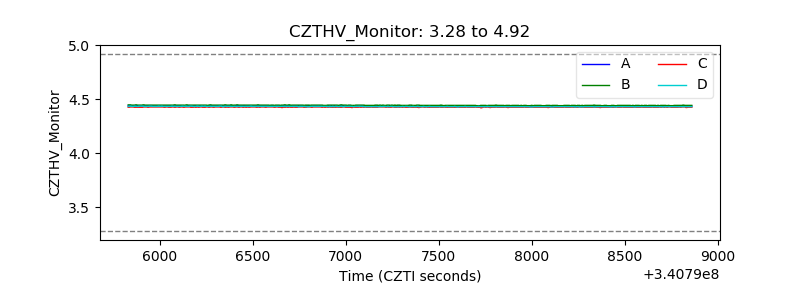 |
| D_VDD | 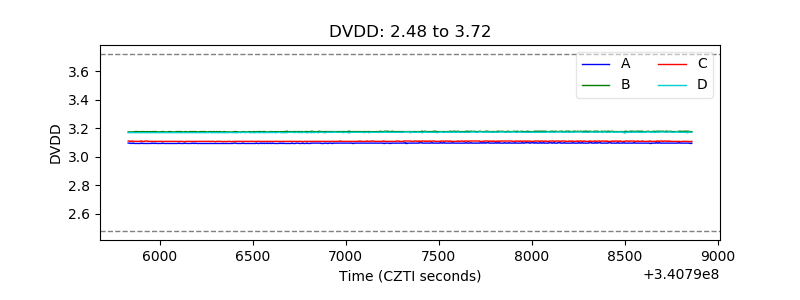 |
| Temperature 1 | 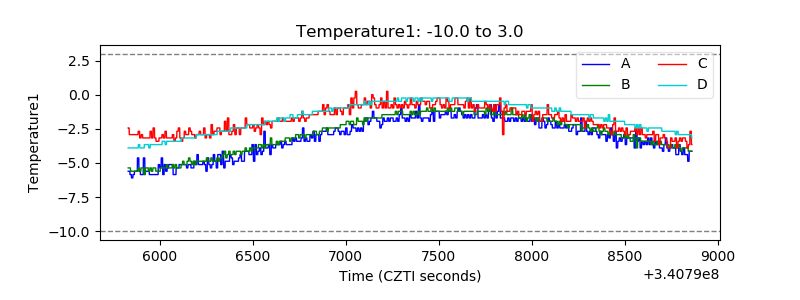 |
| Veto HV Monitor | 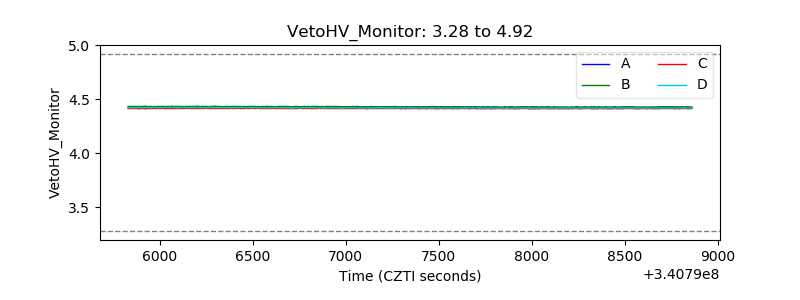 |
| Veto LLD | 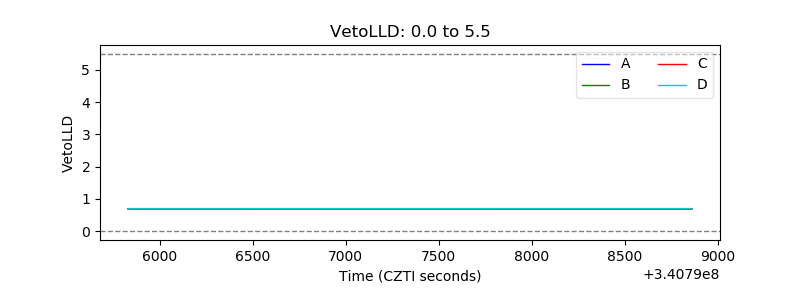 |
| Alpha Counter | 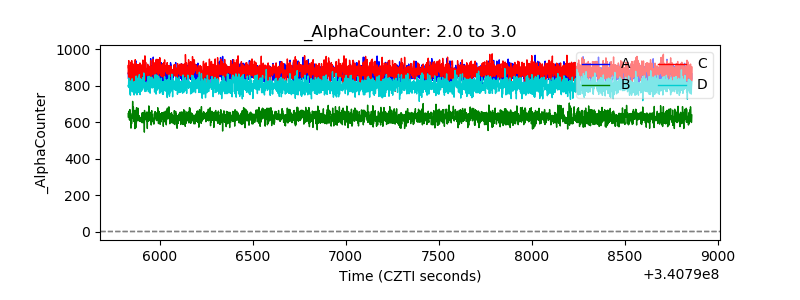 |
| _CPM_Rate | 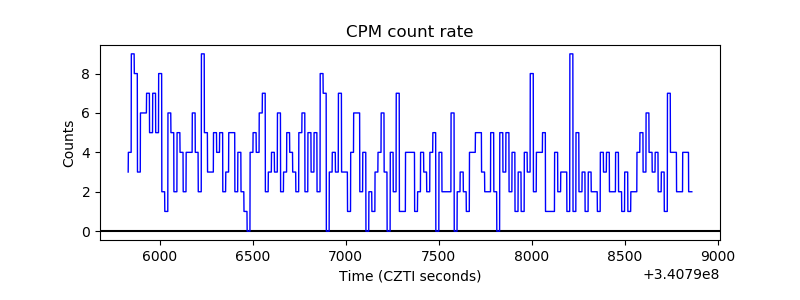 |
| CZT Counter | 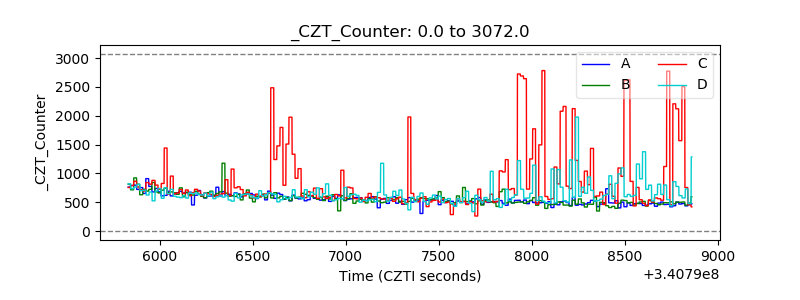 |
| +2.5 Volts monitor |  |
| +5 Volts monitor |  |
| _ROLL_ROT | 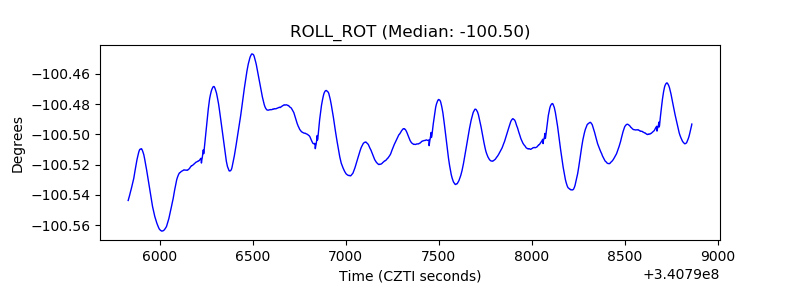 |
| _Roll_DEC | 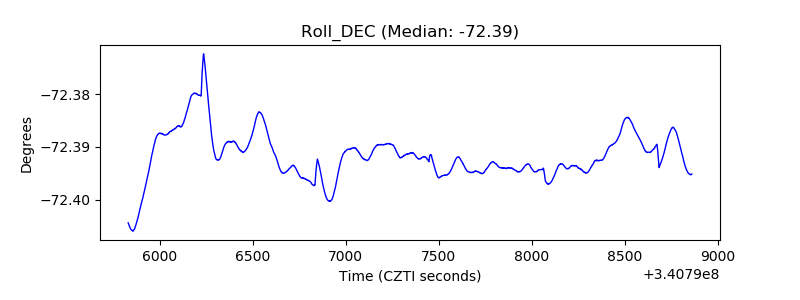 |
| _Roll_RA | 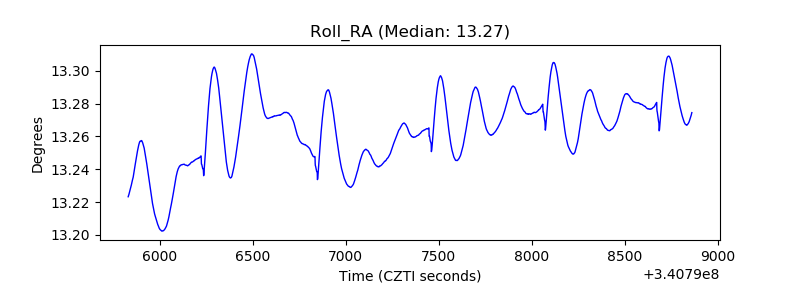 |
| Veto Counter | 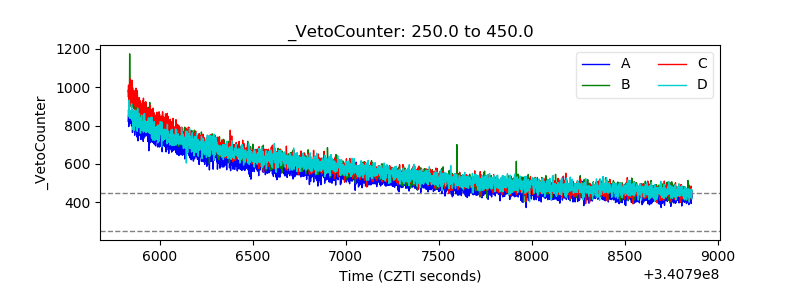 |