| Param | Original file | Final file |
|---|---|---|
| Filename | modeM0/AS1A09_038T13_9000003928cztM0_level2.fits | modeM0/AS1A09_038T13_9000003928cztM0_level2_quad_clean.evt |
| Size (bytes) | 71,850,240 | 61,824,960 |
| Size | 68.5 MB | 59.0 MB |
| Events in quadrant A | 467,450 | 379,233 |
| Events in quadrant B | 443,314 | 378,602 |
| Events in quadrant C | 407,318 | 322,737 |
| Events in quadrant D | 396,018 | 328,995 |
| Mode M0 | |||
|---|---|---|---|
| Quadrant | BADHDUFLAG | Total packets | Discarded packets |
| A | 0 | 14583 | 0 |
| B | 0 | 14426 | 0 |
| C | 0 | 22127 | 0 |
| D | 0 | 16721 | 0 |
| Mode M9 | |||
|---|---|---|---|
| Quadrant | BADHDUFLAG | Total packets | Discarded packets |
| A | 0 | 14 | 0 |
| B | 0 | 14 | 0 |
| C | 0 | 14 | 0 |
| D | 0 | 14 | 0 |
| Mode SS | |||
|---|---|---|---|
| Quadrant | BADHDUFLAG | Total packets | Discarded packets |
| A | 0 | 134 | 0 |
| B | 0 | 134 | 0 |
| C | 0 | 134 | 0 |
| D | 0 | 134 | 0 |
| Quadrant | Total seconds | Saturated seconds | Saturation percentage |
|---|---|---|---|
| A | 6628 | 209 | 3.153289% |
| B | 6628 | 234 | 3.530477% |
| C | 6628 | 1141 | 17.214846% |
| D | 6628 | 264 | 3.983102% |
Noise dominated data is calculated using 1-second bins in cleaned event files. If a bin has >2000 counts, and if more than 50% of those come from <1% of pixels, then it is considered to be noise-dominated and hence unusable.
| Quadrant | # 1 sec bins | Bins with >0 counts | Bins with >2000 counts | High rate bins dominated by noise | Noise dominated (total time) | Noise dominated (detector-on time) | Marked lightcurve |
|---|---|---|---|---|---|---|---|
| A | 7917 | 6626 | 0 | 0 | 0.00% | 0.00% |  |
| B | 7917 | 6626 | 0 | 0 | 0.00% | 0.00% |  |
| C | 7917 | 6614 | 0 | 0 | 0.00% | 0.00% |  |
| D | 7917 | 6627 | 0 | 0 | 0.00% | 0.00% |  |
Top three noisy pixels from each quadrant. If the there are fewer than three noisy pixels in the level2.evt file, extra rows are filled as -1
| Pixel properties | Quadrant properties | ||||||
|---|---|---|---|---|---|---|---|
| Quadrant | DetID | PixID | Counts | Sigma | Mean | Median | Sigma |
| A | 0 | 29 | 478 | 11.86 | 122 | 116 | 30.5 |
| A | 9 | 19 | 375 | 8.49 | 122 | 116 | 30.5 |
| A | 7 | 110 | 364 | 8.13 | 122 | 116 | 30.5 |
| B | 2 | 9 | 339 | 9.15 | 117 | 113 | 24.7 |
| B | 3 | 80 | 296 | 7.41 | 117 | 113 | 24.7 |
| B | 5 | 255 | 291 | 7.2 | 117 | 113 | 24.7 |
| C | 1 | 80 | 317 | 7.39 | 107 | 101 | 29.2 |
| C | 1 | 81 | 316 | 7.36 | 107 | 101 | 29.2 |
| C | 3 | 187 | 295 | 6.64 | 107 | 101 | 29.2 |
| D | 10 | 189 | 309 | 6.59 | 113 | 104 | 31.1 |
| D | 6 | 38 | 295 | 6.14 | 113 | 104 | 31.1 |
| D | 1 | 3 | 272 | 5.4 | 113 | 104 | 31.1 |
Histogram calculated using DETX and DETY for each event in the final _common_clean file
| Quadrant A |  |
 |
Quadrant B |
|---|---|---|---|
| Quadrant D | 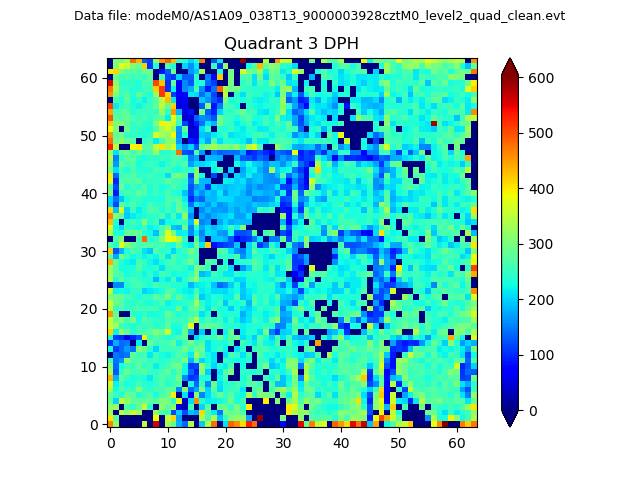 |
 |
Quadrant C |
| Plot type | Count rate plots | Images |
|---|---|---|
| Comparison with Poisson distribution Blue bars denote a histogram of data divided into 1 sec bins. Red curve is a Poisson curve with rate = median count rate of data. |
 |
 |
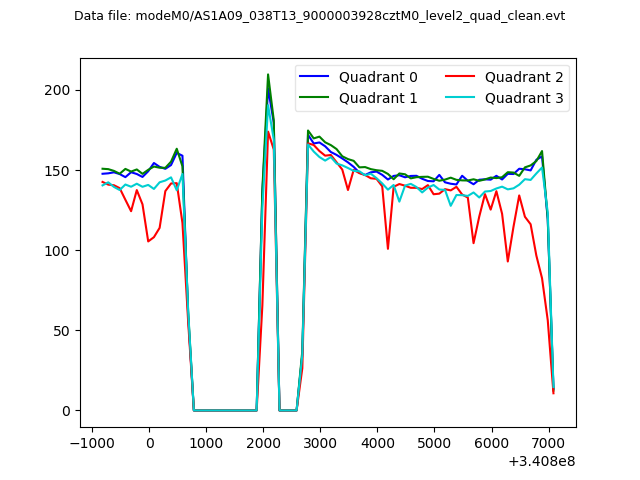
| Quadrant-wise count rates Data is divided into 100 sec bins |
 |
|
| Module-wise count rates for Quadrant A Data is divided into 100 sec bins |
 |
 |
| Module-wise count rates for Quadrant B Data is divided into 100 sec bins |
 |
 |
| Module-wise count rates for Quadrant C Data is divided into 100 sec bins |
 |
 |
| Module-wise count rates for Quadrant D Data is divided into 100 sec bins |
 |
 |
| Parameter | Plot |
|---|---|
| CZT HV Monitor |  |
| D_VDD | 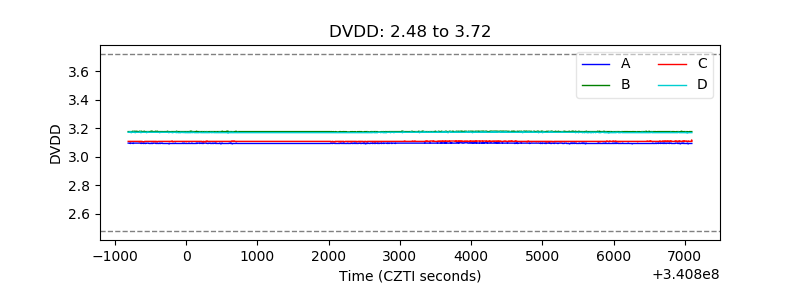 |
| Temperature 1 | 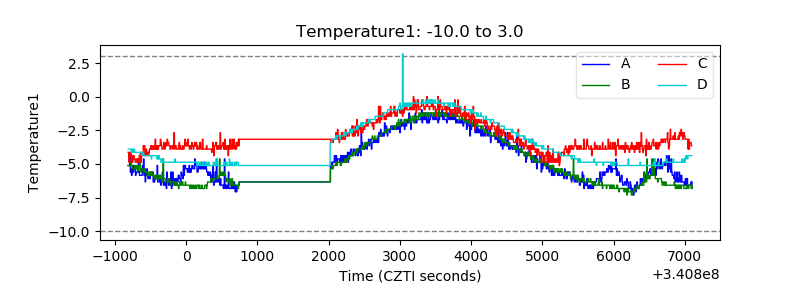 |
| Veto HV Monitor |  |
| Veto LLD |  |
| Alpha Counter |  |
| _CPM_Rate | 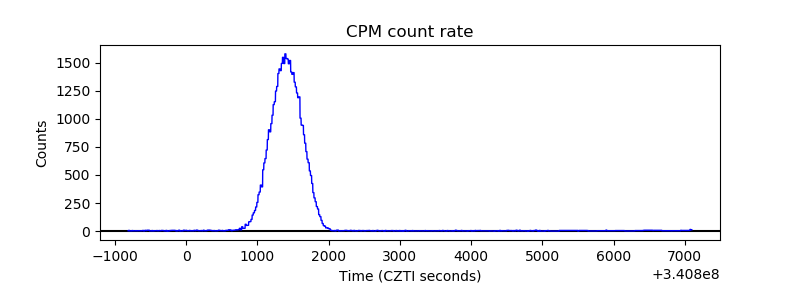 |
| CZT Counter |  |
| +2.5 Volts monitor |  |
| +5 Volts monitor |  |
| _ROLL_ROT |  |
| _Roll_DEC |  |
| _Roll_RA |  |
| Veto Counter |  |