| Param | Original file | Final file |
|---|---|---|
| Filename | modeM0/AS1A09_038T13_9000003928_27358cztM0_level2.evt | modeM0/AS1A09_038T13_9000003928_27358cztM0_level2_quad_clean.evt |
| Size (bytes) | 257,880,960 | 55,512,000 |
| Size | 245.9 MB | 52.9 MB |
| Events in quadrant A | 1,594,008 | 384,137 |
| Events in quadrant B | 1,616,967 | 389,157 |
| Events in quadrant C | 2,496,872 | 337,835 |
| Events in quadrant D | 1,902,996 | 362,086 |
| Mode M0 | |||
|---|---|---|---|
| Quadrant | BADHDUFLAG | Total packets | Discarded packets |
| A | 0 | 6621 | 0 |
| B | 0 | 6621 | 0 |
| C | 0 | 9377 | 0 |
| D | 0 | 7516 | 0 |
| Mode M9 | |||
|---|---|---|---|
| Quadrant | BADHDUFLAG | Total packets | Discarded packets |
| A | 0 | 13 | 0 |
| B | 0 | 13 | 0 |
| C | 0 | 13 | 0 |
| D | 0 | 13 | 0 |
| Quadrant | Total seconds | Saturated seconds | Saturation percentage |
|---|---|---|---|
| A | 2914 | 117 | 4.015100% |
| B | 2913 | 131 | 4.497082% |
| C | 2913 | 494 | 16.958462% |
| D | 2913 | 160 | 5.492619% |
Noise dominated data is calculated using 1-second bins in cleaned event files. If a bin has >2000 counts, and if more than 50% of those come from <1% of pixels, then it is considered to be noise-dominated and hence unusable.
| Quadrant | # 1 sec bins | Bins with >0 counts | Bins with >2000 counts | High rate bins dominated by noise | Noise dominated (total time) | Noise dominated (detector-on time) | Marked lightcurve |
|---|---|---|---|---|---|---|---|
| A | 4189 | 2914 | 0 | 0 | 0.00% | 0.00% | 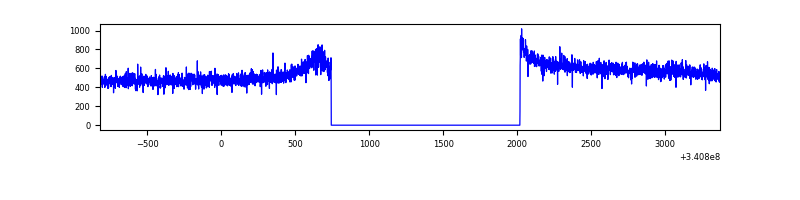 |
| B | 4188 | 2913 | 0 | 0 | 0.00% | 0.00% | 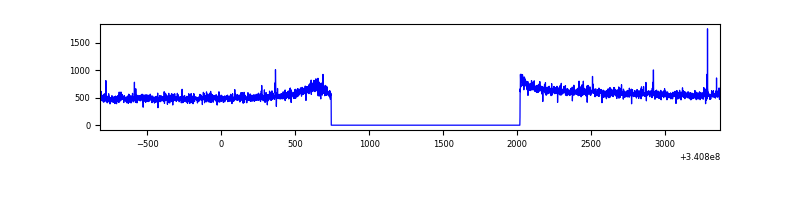 |
| C | 4188 | 2913 | 180 | 180 | 4.30% | 6.18% | 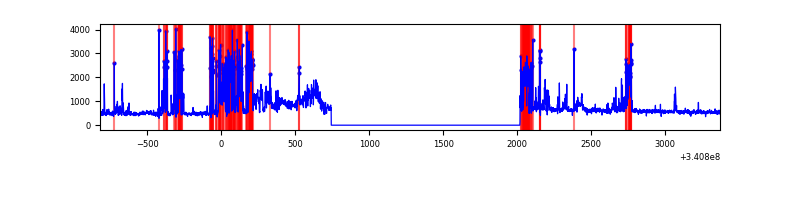 |
| D | 4188 | 2913 | 28 | 28 | 0.67% | 0.96% | 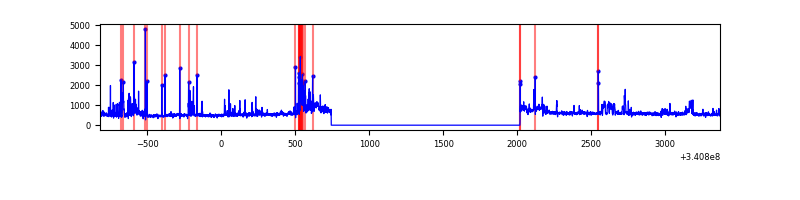 |
Top three noisy pixels from each quadrant. If the there are fewer than three noisy pixels in the level2.evt file, extra rows are filled as -1
| Pixel properties | Quadrant properties | ||||||
|---|---|---|---|---|---|---|---|
| Quadrant | DetID | PixID | Counts | Sigma | Mean | Median | Sigma |
| A | 6 | 16 | 8145 | 95.81 | 410 | 402 | 80.8 |
| A | 13 | 254 | 5129 | 58.49 | 410 | 402 | 80.8 |
| A | 3 | 137 | 3611 | 39.71 | 410 | 402 | 80.8 |
| B | 7 | 205 | 12295 | 155.61 | 406 | 397 | 76.5 |
| B | 12 | 111 | 8677 | 108.29 | 406 | 397 | 76.5 |
| B | 11 | 111 | 7704 | 95.57 | 406 | 397 | 76.5 |
| C | 2 | 16 | 984380 | 11523.03 | 370 | 372 | 85.4 |
| C | 14 | 238 | 60990 | 709.85 | 370 | 372 | 85.4 |
| C | 15 | 208 | 9452 | 106.33 | 370 | 372 | 85.4 |
| D | 1 | 52 | 271660 | 2911.33 | 395 | 385 | 93.2 |
| D | 2 | 250 | 90994 | 972.42 | 395 | 385 | 93.2 |
| D | 2 | 120 | 24489 | 258.68 | 395 | 385 | 93.2 |
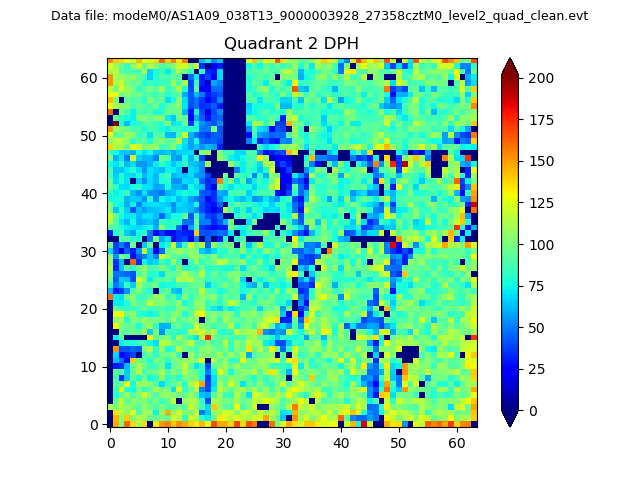
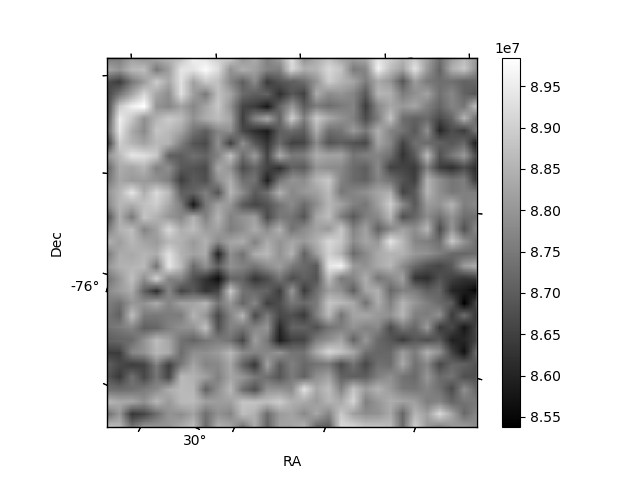
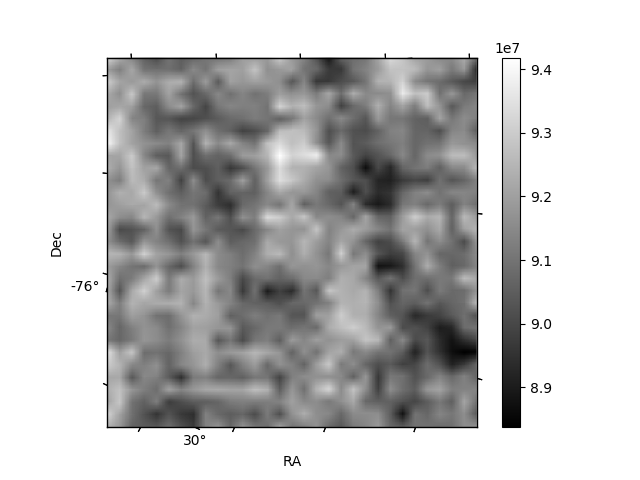
Histogram calculated using DETX and DETY for each event in the final _common_clean file
| Quadrant A | 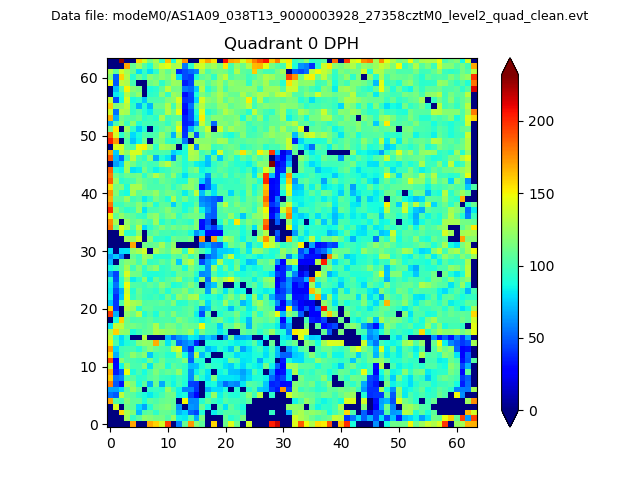 |
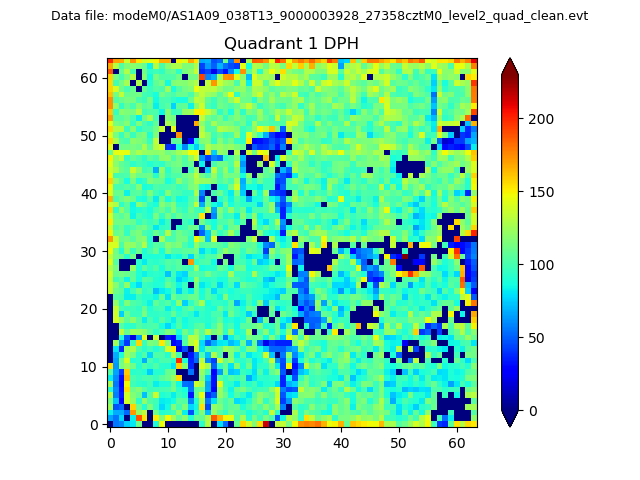 |
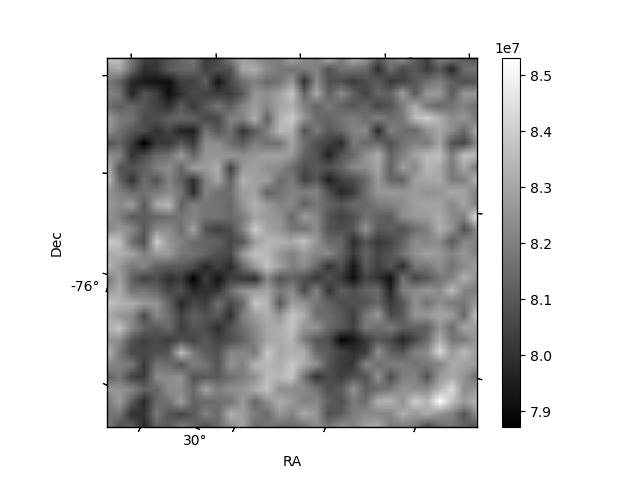
Quadrant B |
|---|---|---|---|
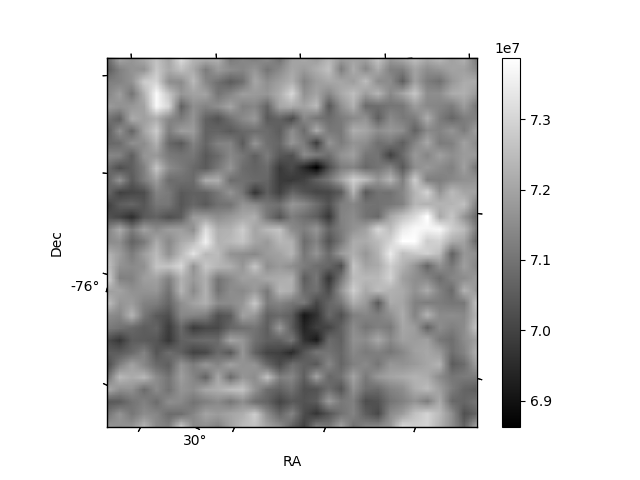
| Quadrant D | 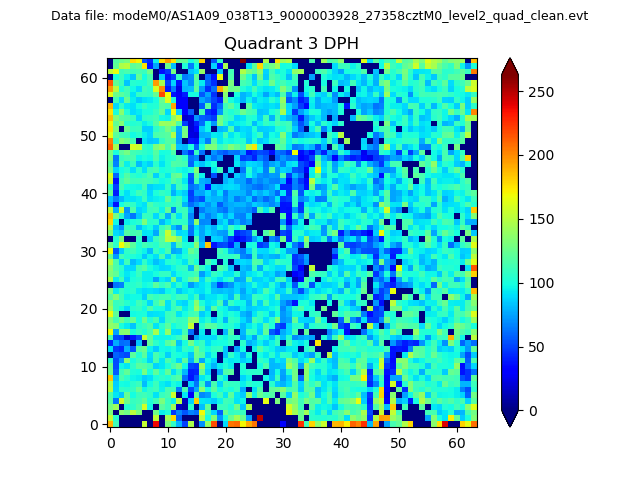 |
 |
Quadrant C |
| Plot type | Count rate plots | Images |
|---|---|---|
| Comparison with Poisson distribution Blue bars denote a histogram of data divided into 1 sec bins. Red curve is a Poisson curve with rate = median count rate of data. |
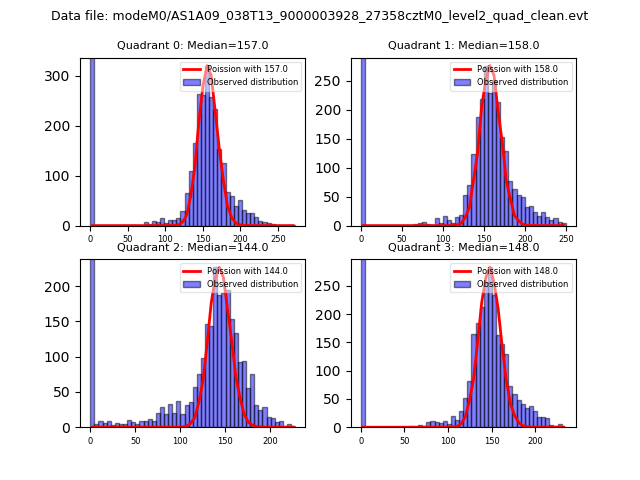 |
 |
| Quadrant-wise count rates Data is divided into 100 sec bins |
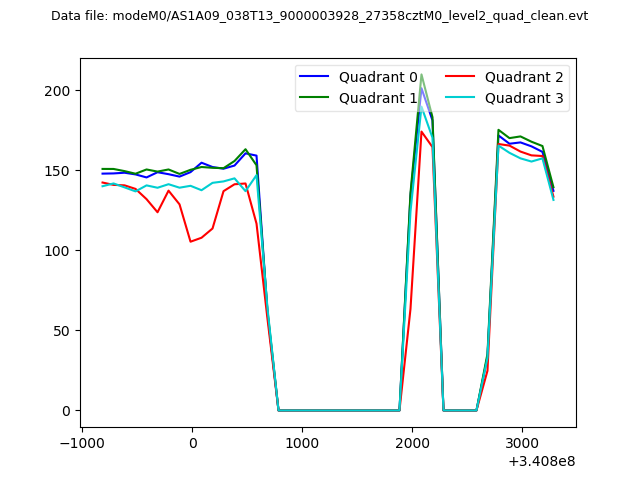 |
|
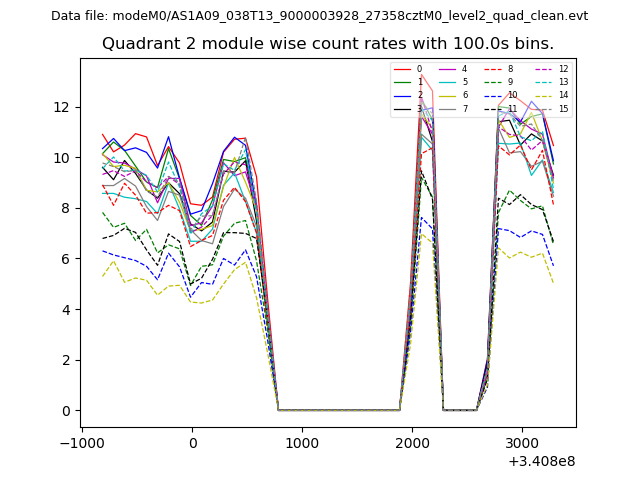
| Module-wise count rates for Quadrant A Data is divided into 100 sec bins |
 |
 |
| Module-wise count rates for Quadrant B Data is divided into 100 sec bins |
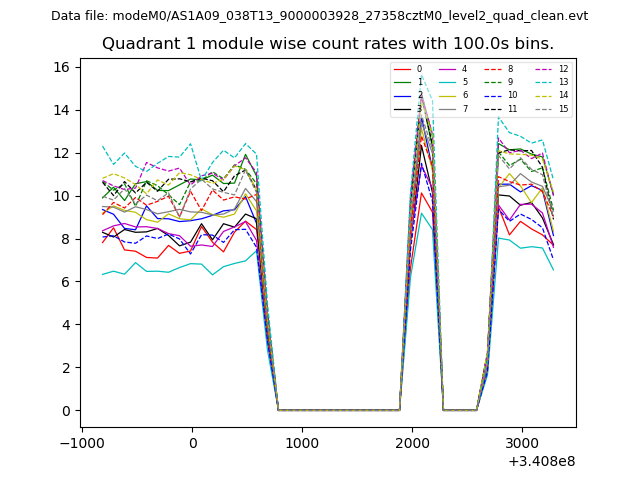 |
 |
| Module-wise count rates for Quadrant C Data is divided into 100 sec bins |
 |
 |
| Module-wise count rates for Quadrant D Data is divided into 100 sec bins |
 |
 |
| Parameter | Plot |
|---|---|
| CZT HV Monitor | 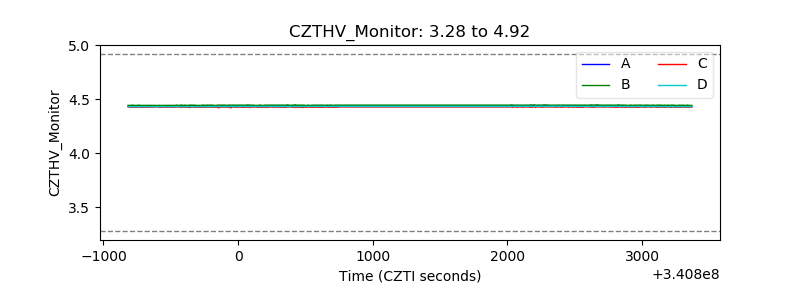 |
| D_VDD | 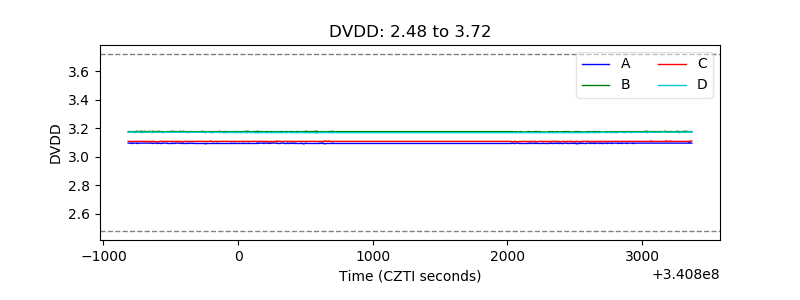 |
| Temperature 1 | 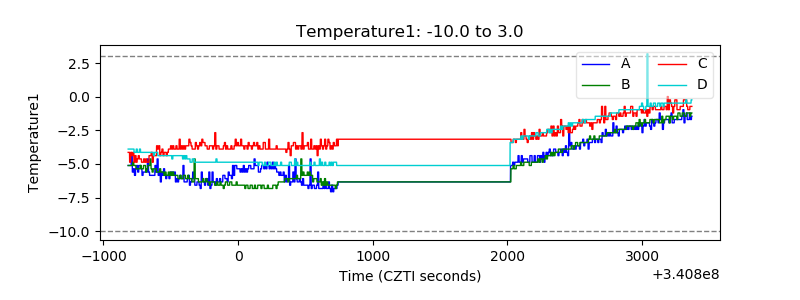 |
| Veto HV Monitor |  |
| Veto LLD | 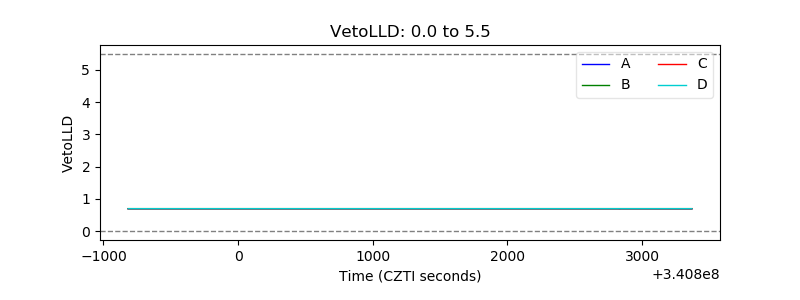 |
| Alpha Counter | 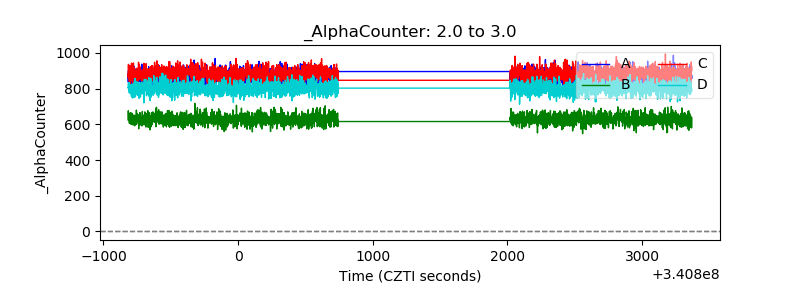 |
| _CPM_Rate | 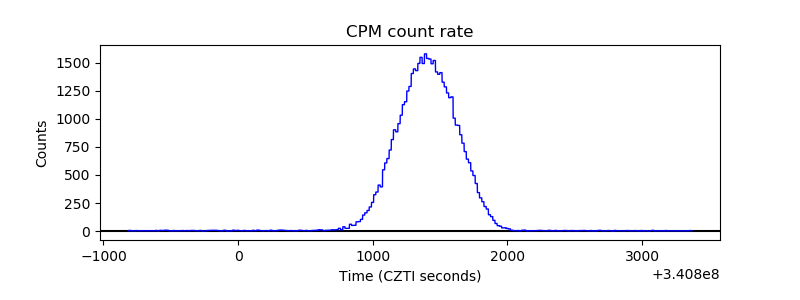 |
| CZT Counter |  |
| +2.5 Volts monitor | 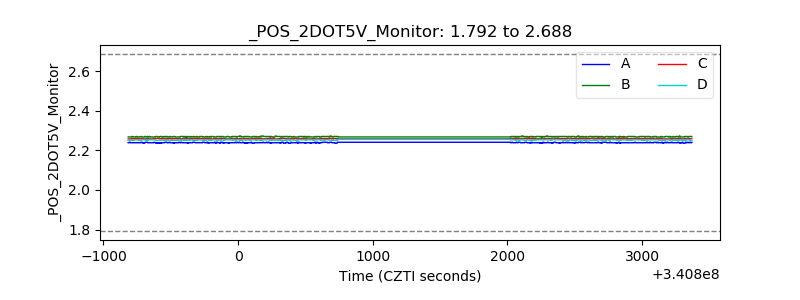 |
| +5 Volts monitor |  |
| _ROLL_ROT | 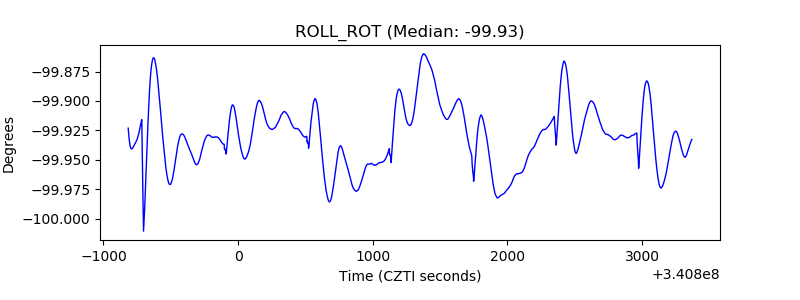 |
| _Roll_DEC |  |
| _Roll_RA |  |
| Veto Counter |  |