| Param | Original file | Final file |
|---|---|---|
| Filename | modeM0/AS1A09_038T13_9000003928_27359cztM0_level2.evt | modeM0/AS1A09_038T13_9000003928_27359cztM0_level2_quad_clean.evt |
| Size (bytes) | 401,667,840 | 93,147,840 |
| Size | 383.1 MB | 88.8 MB |
| Events in quadrant A | 2,436,359 | 645,602 |
| Events in quadrant B | 2,416,917 | 652,602 |
| Events in quadrant C | 4,098,273 | 575,980 |
| Events in quadrant D | 2,895,524 | 618,773 |
| Mode M0 | |||
|---|---|---|---|
| Quadrant | BADHDUFLAG | Total packets | Discarded packets |
| A | 0 | 10157 | 0 |
| B | 0 | 9990 | 0 |
| C | 0 | 15231 | 0 |
| D | 0 | 11611 | 0 |
| Mode M9 | |||
|---|---|---|---|
| Quadrant | BADHDUFLAG | Total packets | Discarded packets |
| A | 0 | 1 | 0 |
| B | 0 | 1 | 0 |
| C | 0 | 1 | 0 |
| D | 0 | 1 | 0 |
| Quadrant | Total seconds | Saturated seconds | Saturation percentage |
|---|---|---|---|
| A | 4671 | 94 | 2.012417% |
| B | 4671 | 103 | 2.205095% |
| C | 4671 | 685 | 14.664954% |
| D | 4672 | 107 | 2.290240% |
Noise dominated data is calculated using 1-second bins in cleaned event files. If a bin has >2000 counts, and if more than 50% of those come from <1% of pixels, then it is considered to be noise-dominated and hence unusable.
| Quadrant | # 1 sec bins | Bins with >0 counts | Bins with >2000 counts | High rate bins dominated by noise | Noise dominated (total time) | Noise dominated (detector-on time) | Marked lightcurve |
|---|---|---|---|---|---|---|---|
| A | 4685 | 4671 | 0 | 0 | 0.00% | 0.00% |  |
| B | 4685 | 4671 | 1 | 1 | 0.02% | 0.02% |  |
| C | 4685 | 4670 | 428 | 428 | 9.14% | 9.16% |  |
| D | 4686 | 4672 | 46 | 46 | 0.98% | 0.98% |  |
Top three noisy pixels from each quadrant. If the there are fewer than three noisy pixels in the level2.evt file, extra rows are filled as -1
| Pixel properties | Quadrant properties | ||||||
|---|---|---|---|---|---|---|---|
| Quadrant | DetID | PixID | Counts | Sigma | Mean | Median | Sigma |
| A | 15 | 174 | 83665 | 699.84 | 603 | 593 | 118.7 |
| A | 6 | 16 | 23658 | 194.31 | 603 | 593 | 118.7 |
| A | 13 | 254 | 8012 | 62.5 | 603 | 593 | 118.7 |
| B | 15 | 33 | 23613 | 209.27 | 598 | 586 | 110.0 |
| B | 12 | 111 | 12768 | 110.71 | 598 | 586 | 110.0 |
| B | 0 | 229 | 11642 | 100.48 | 598 | 586 | 110.0 |
| C | 2 | 16 | 1405302 | 11456.83 | 537 | 542 | 122.6 |
| C | 15 | 208 | 506712 | 4128.18 | 537 | 542 | 122.6 |
| C | 14 | 238 | 89396 | 724.67 | 537 | 542 | 122.6 |
| D | 1 | 52 | 591422 | 4234.52 | 580 | 567 | 139.5 |
| D | 2 | 250 | 70403 | 500.5 | 580 | 567 | 139.5 |
| D | 2 | 234 | 19828 | 138.04 | 580 | 567 | 139.5 |
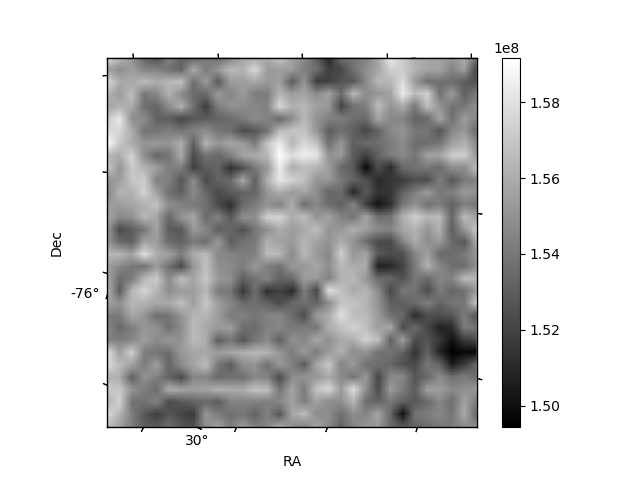
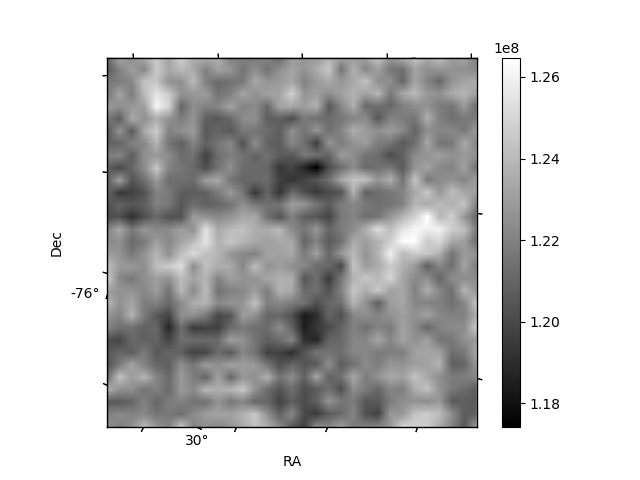
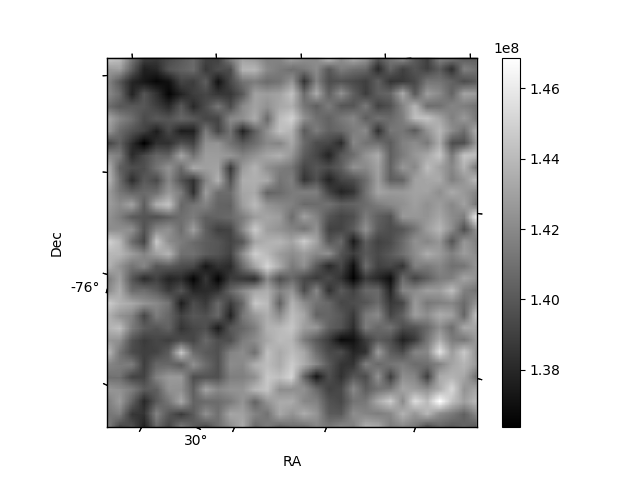
Histogram calculated using DETX and DETY for each event in the final _common_clean file
| Quadrant A | 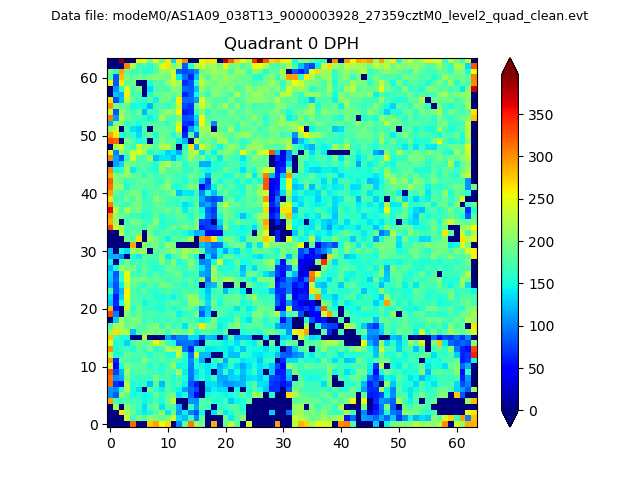 |
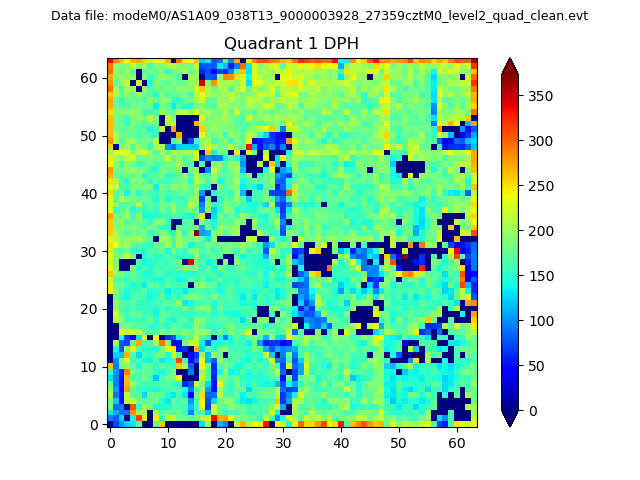 |
Quadrant B |
|---|---|---|---|
| Quadrant D | 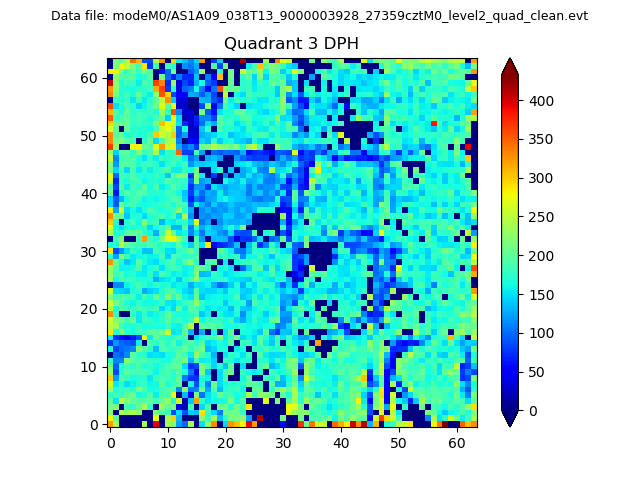 |
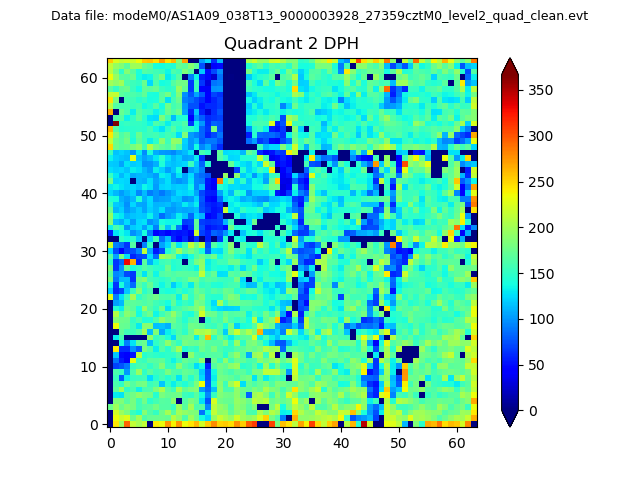 |
Quadrant C |
| Plot type | Count rate plots | Images |
|---|---|---|
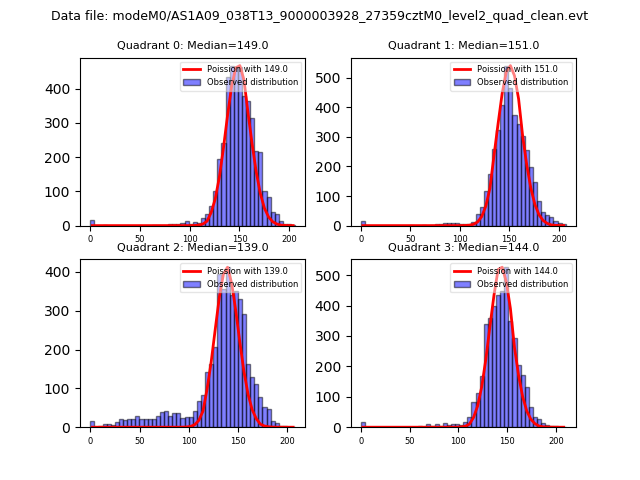
| Comparison with Poisson distribution Blue bars denote a histogram of data divided into 1 sec bins. Red curve is a Poisson curve with rate = median count rate of data. |
 |
 |
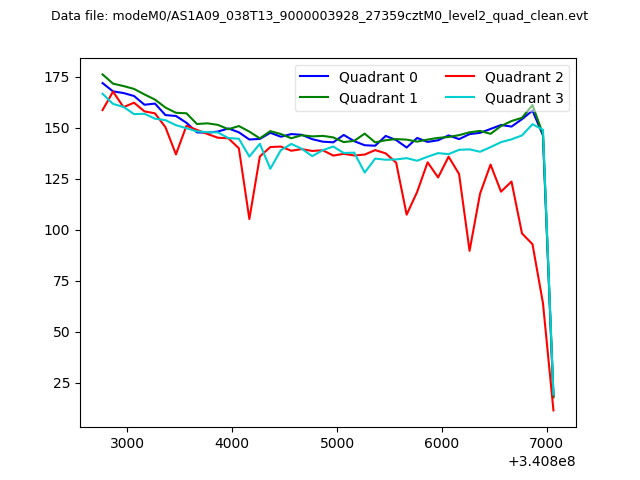
| Quadrant-wise count rates Data is divided into 100 sec bins |
 |
|
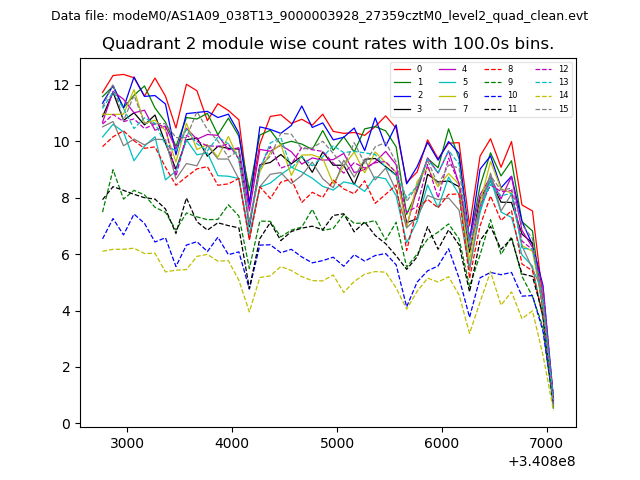
| Module-wise count rates for Quadrant A Data is divided into 100 sec bins |
 |
 |
| Module-wise count rates for Quadrant B Data is divided into 100 sec bins |
 |
 |
| Module-wise count rates for Quadrant C Data is divided into 100 sec bins |
 |
 |
| Module-wise count rates for Quadrant D Data is divided into 100 sec bins |
 |
 |
| Parameter | Plot |
|---|---|
| CZT HV Monitor |  |
| D_VDD | 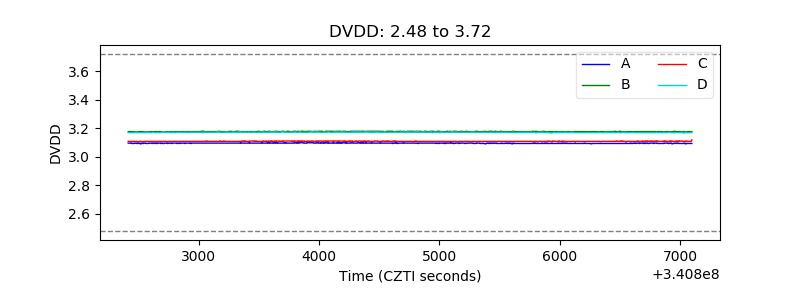 |
| Temperature 1 | 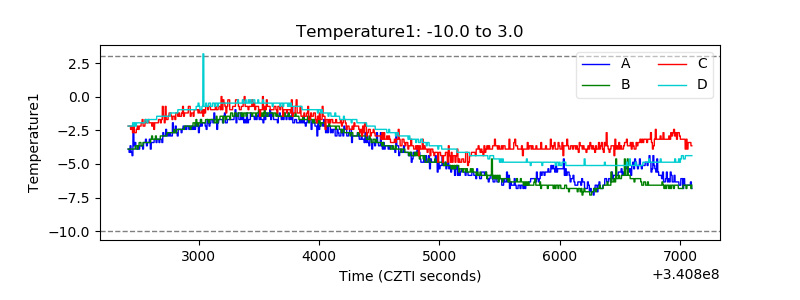 |
| Veto HV Monitor | 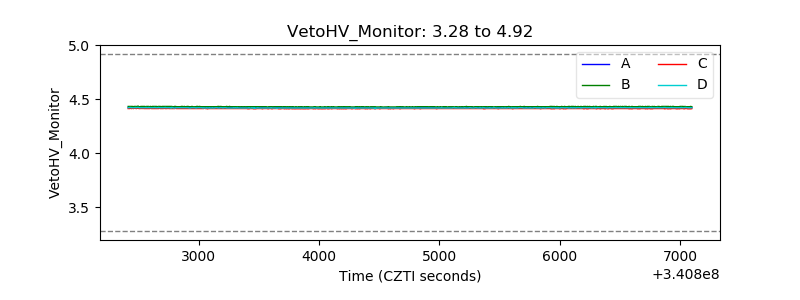 |
| Veto LLD | 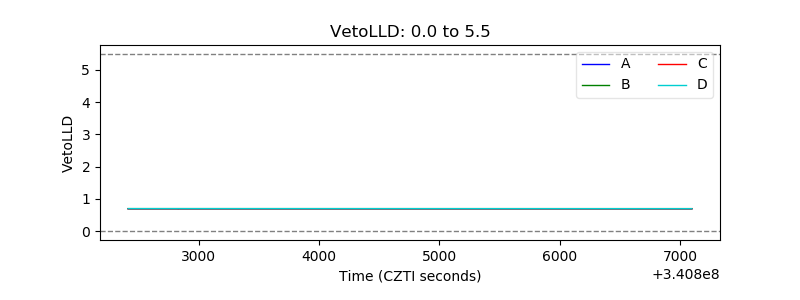 |
| Alpha Counter | 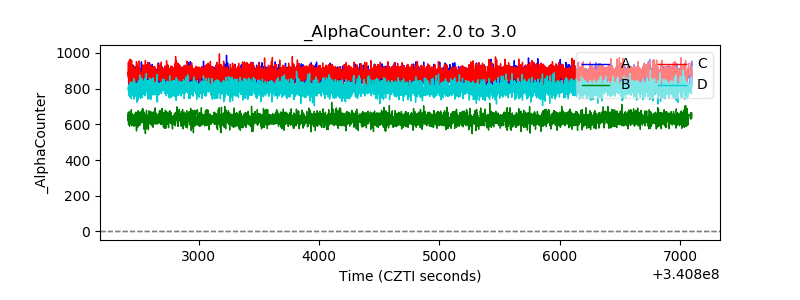 |
| _CPM_Rate | 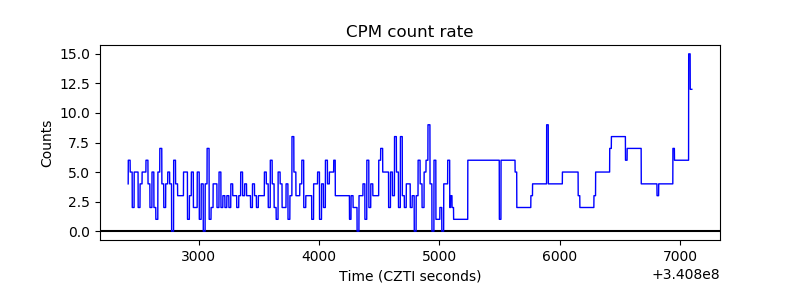 |
| CZT Counter | 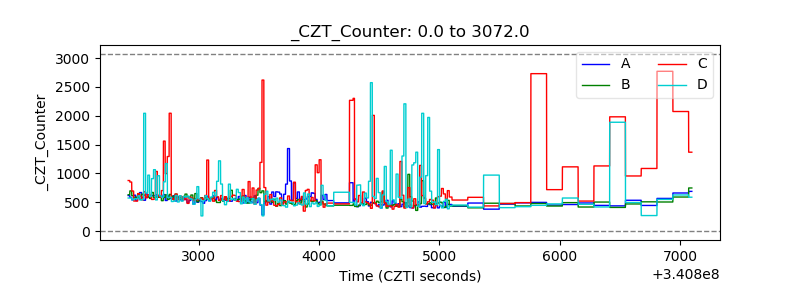 |
| +2.5 Volts monitor |  |
| +5 Volts monitor | 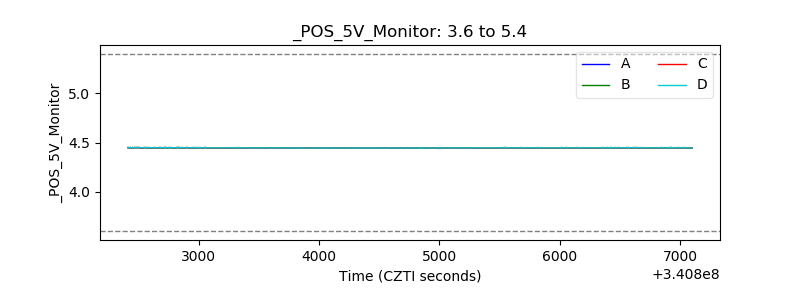 |
| _ROLL_ROT | 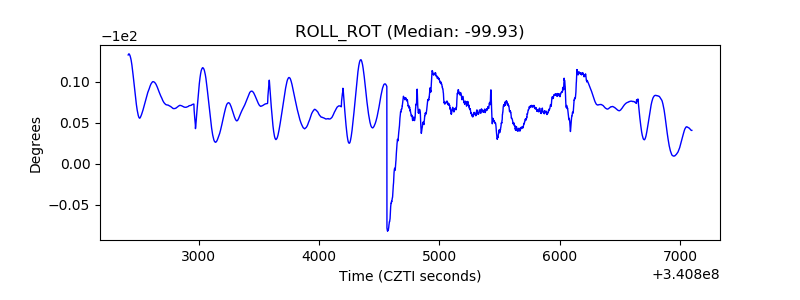 |
| _Roll_DEC | 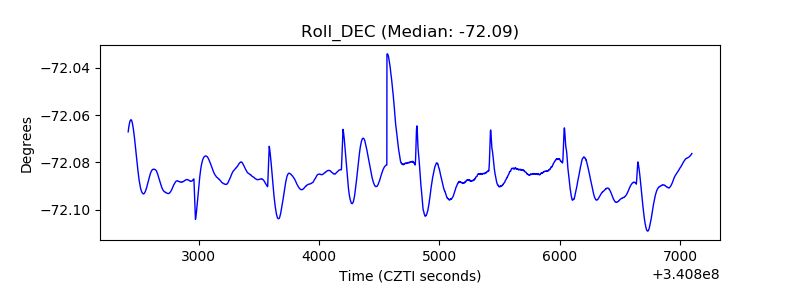 |
| _Roll_RA | 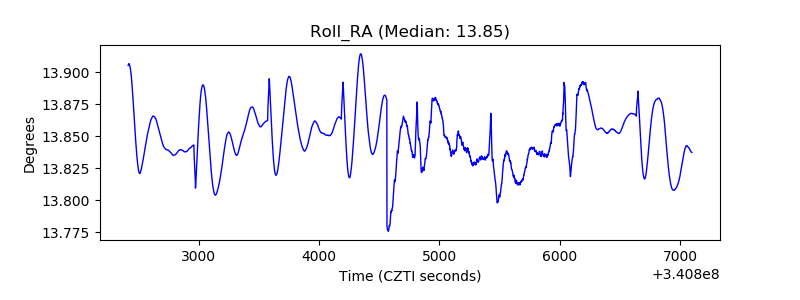 |
| Veto Counter | 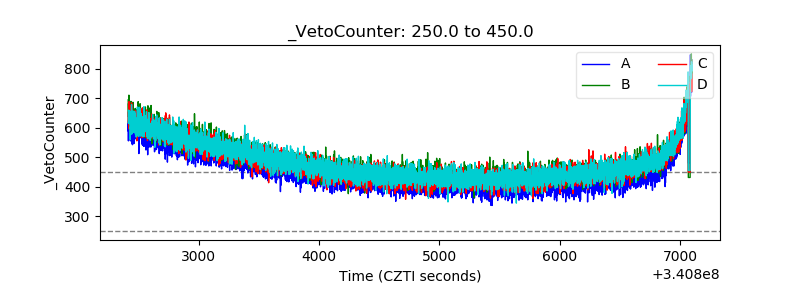 |