| Param | Original file | Final file |
|---|---|---|
| Filename | modeM0/AS1A09_038T14_9000003930cztM0_level2.fits | modeM0/AS1A09_038T14_9000003930cztM0_level2_quad_clean.evt |
| Size (bytes) | 53,596,800 | 62,087,040 |
| Size | 51.1 MB | 59.2 MB |
| Events in quadrant A | 339,992 | 399,755 |
| Events in quadrant B | 323,496 | 398,387 |
| Events in quadrant C | 308,284 | 368,834 |
| Events in quadrant D | 287,684 | 348,761 |
| Mode M9 | |||
|---|---|---|---|
| Quadrant | BADHDUFLAG | Total packets | Discarded packets |
| A | 0 | 7 | 0 |
| B | 0 | 7 | 0 |
| C | 0 | 7 | 0 |
| D | 0 | 7 | 0 |
| Mode M0 | |||
|---|---|---|---|
| Quadrant | BADHDUFLAG | Total packets | Discarded packets |
| A | 0 | 10723 | 0 |
| B | 0 | 10875 | 0 |
| C | 0 | 13340 | 0 |
| D | 0 | 12181 | 0 |
| Mode SS | |||
|---|---|---|---|
| Quadrant | BADHDUFLAG | Total packets | Discarded packets |
| A | 0 | 104 | 0 |
| B | 0 | 104 | 0 |
| C | 0 | 104 | 0 |
| D | 0 | 104 | 0 |
| Quadrant | Total seconds | Saturated seconds | Saturation percentage |
|---|---|---|---|
| A | 5193 | 18 | 0.346620% |
| B | 5193 | 24 | 0.462161% |
| C | 5193 | 351 | 6.759099% |
| D | 5193 | 22 | 0.423647% |
Noise dominated data is calculated using 1-second bins in cleaned event files. If a bin has >2000 counts, and if more than 50% of those come from <1% of pixels, then it is considered to be noise-dominated and hence unusable.
| Quadrant | # 1 sec bins | Bins with >0 counts | Bins with >2000 counts | High rate bins dominated by noise | Noise dominated (total time) | Noise dominated (detector-on time) | Marked lightcurve |
|---|---|---|---|---|---|---|---|
| A | 5192 | 5192 | 0 | 0 | 0.00% | 0.00% |  |
| B | 5192 | 5192 | 0 | 0 | 0.00% | 0.00% | 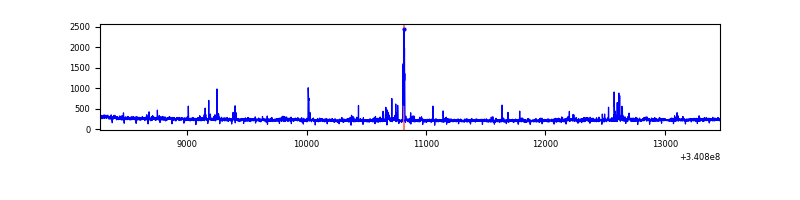 |
| C | 5192 | 5187 | 0 | 0 | 0.00% | 0.00% | 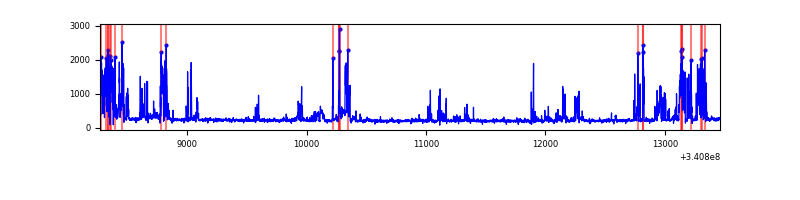 |
| D | 5192 | 5192 | 0 | 0 | 0.00% | 0.00% |  |
Top three noisy pixels from each quadrant. If the there are fewer than three noisy pixels in the level2.evt file, extra rows are filled as -1
| Pixel properties | Quadrant properties | ||||||
|---|---|---|---|---|---|---|---|
| Quadrant | DetID | PixID | Counts | Sigma | Mean | Median | Sigma |
| A | 0 | 29 | 312 | 9.81 | 88 | 84 | 23.3 |
| A | 7 | 110 | 268 | 7.91 | 88 | 84 | 23.3 |
| A | 14 | 95 | 252 | 7.23 | 88 | 84 | 23.3 |
| B | 2 | 9 | 267 | 9.87 | 85 | 82 | 18.7 |
| B | 5 | 225 | 212 | 6.94 | 85 | 82 | 18.7 |
| B | 2 | 8 | 210 | 6.83 | 85 | 82 | 18.7 |
| C | 1 | 65 | 237 | 7.01 | 81 | 77 | 22.8 |
| C | 12 | 241 | 235 | 6.92 | 81 | 77 | 22.8 |
| C | 9 | 242 | 220 | 6.27 | 81 | 77 | 22.8 |
| D | 4 | 246 | 226 | 6.41 | 81 | 75 | 23.5 |
| D | 6 | 231 | 223 | 6.29 | 81 | 75 | 23.5 |
| D | 10 | 113 | 214 | 5.9 | 81 | 75 | 23.5 |
Histogram calculated using DETX and DETY for each event in the final _common_clean file
| Quadrant A | 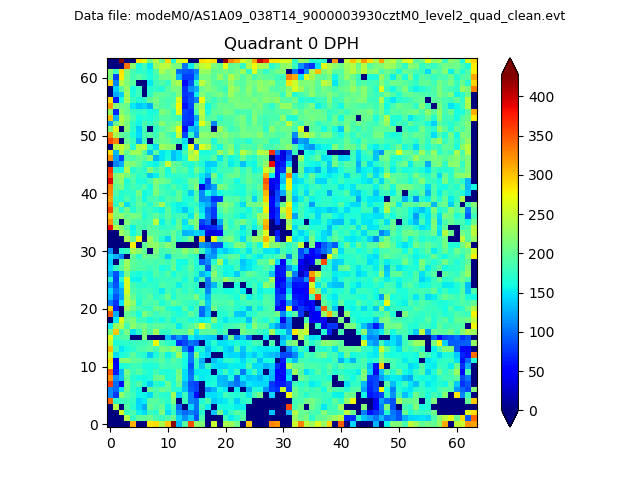 |
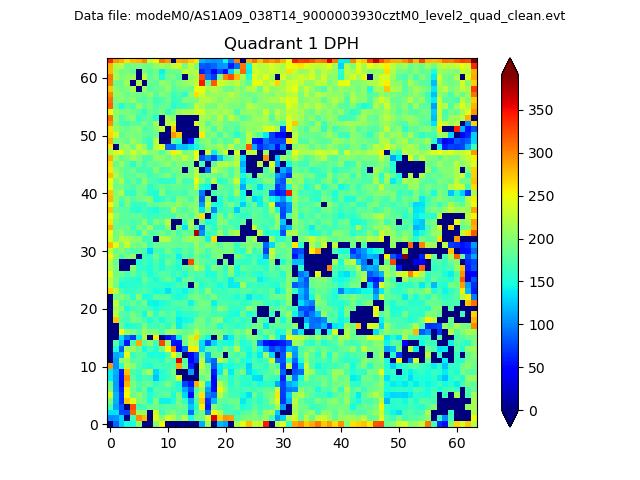 |
Quadrant B |
|---|---|---|---|
| Quadrant D | 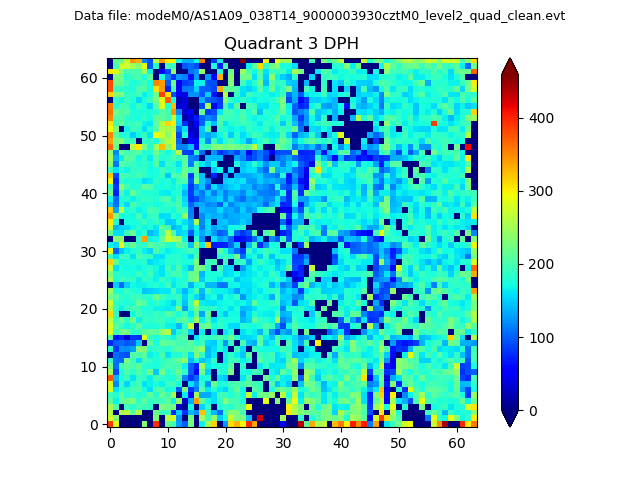 |
 |
Quadrant C |
| Plot type | Count rate plots | Images |
|---|---|---|
| Comparison with Poisson distribution Blue bars denote a histogram of data divided into 1 sec bins. Red curve is a Poisson curve with rate = median count rate of data. |
 |
 |
| Quadrant-wise count rates Data is divided into 100 sec bins |
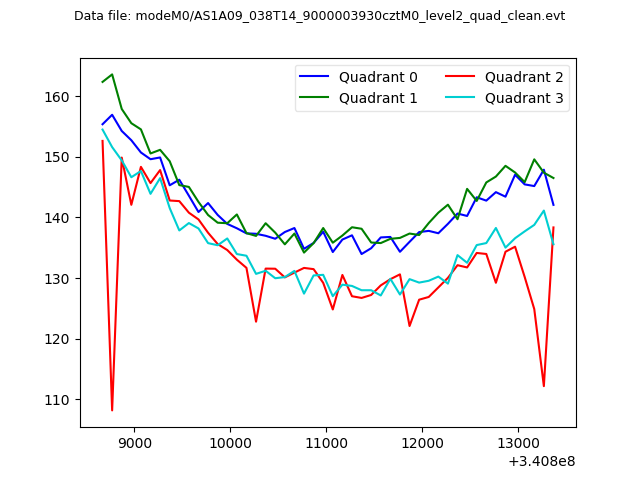 |
|
| Module-wise count rates for Quadrant A Data is divided into 100 sec bins |
 |
 |
| Module-wise count rates for Quadrant B Data is divided into 100 sec bins |
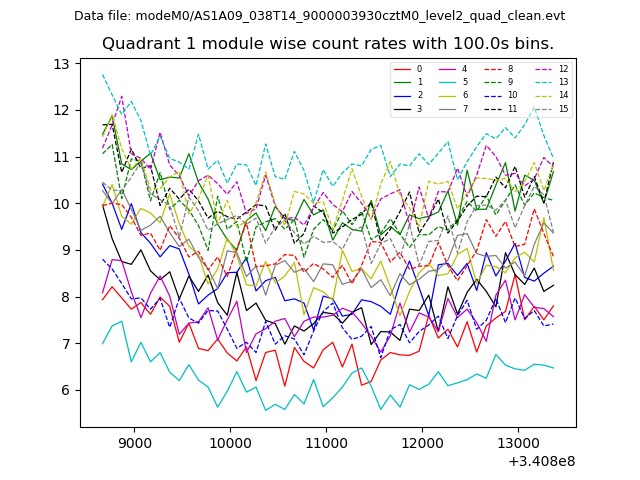 |
 |
| Module-wise count rates for Quadrant C Data is divided into 100 sec bins |
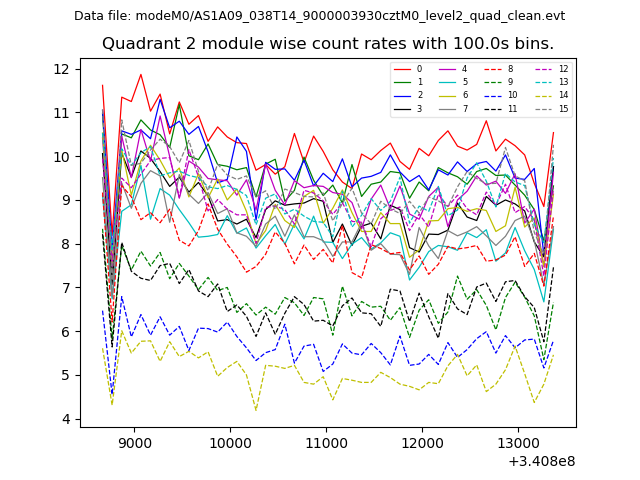 |
 |
| Module-wise count rates for Quadrant D Data is divided into 100 sec bins |
 |
 |
| Parameter | Plot |
|---|---|
| CZT HV Monitor |  |
| D_VDD |  |
| Temperature 1 |  |
| Veto HV Monitor |  |
| Veto LLD |  |
| Alpha Counter |  |
| _CPM_Rate | 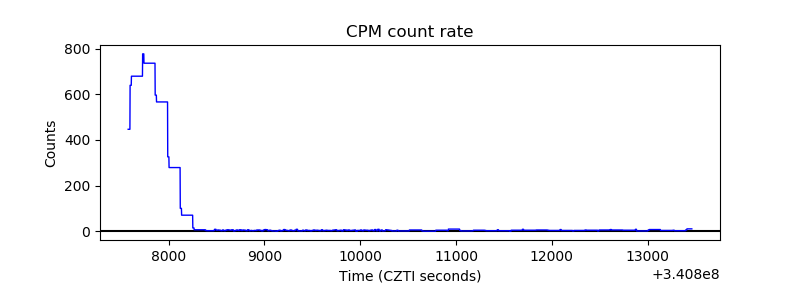 |
| CZT Counter |  |
| +2.5 Volts monitor |  |
| +5 Volts monitor |  |
| _ROLL_ROT |  |
| _Roll_DEC |  |
| _Roll_RA |  |
| Veto Counter |  |