| Param | Original file | Final file |
|---|---|---|
| Filename | modeM0/AS1A09_038T14_9000003930_27359cztM0_level2.evt | modeM0/AS1A09_038T14_9000003930_27359cztM0_level2_quad_clean.evt |
| Size (bytes) | 137,848,320 | 28,471,680 |
| Size | 131.5 MB | 27.2 MB |
| Events in quadrant A | 887,942 | 187,749 |
| Events in quadrant B | 891,829 | 190,894 |
| Events in quadrant C | 1,275,739 | 178,598 |
| Events in quadrant D | 1,003,457 | 181,885 |
| Mode M9 | |||
|---|---|---|---|
| Quadrant | BADHDUFLAG | Total packets | Discarded packets |
| A | 0 | 7 | 0 |
| B | 0 | 7 | 0 |
| C | 0 | 7 | 0 |
| D | 0 | 7 | 0 |
| Mode M0 | |||
|---|---|---|---|
| Quadrant | BADHDUFLAG | Total packets | Discarded packets |
| A | 0 | 3567 | 0 |
| B | 0 | 3599 | 0 |
| C | 0 | 4811 | 0 |
| D | 0 | 4031 | 0 |
| Quadrant | Total seconds | Saturated seconds | Saturation percentage |
|---|---|---|---|
| A | 1664 | 15 | 0.901442% |
| B | 1663 | 16 | 0.962117% |
| C | 1663 | 209 | 12.567649% |
| D | 1663 | 11 | 0.661455% |
Noise dominated data is calculated using 1-second bins in cleaned event files. If a bin has >2000 counts, and if more than 50% of those come from <1% of pixels, then it is considered to be noise-dominated and hence unusable.
| Quadrant | # 1 sec bins | Bins with >0 counts | Bins with >2000 counts | High rate bins dominated by noise | Noise dominated (total time) | Noise dominated (detector-on time) | Marked lightcurve |
|---|---|---|---|---|---|---|---|
| A | 1664 | 1664 | 0 | 0 | 0.00% | 0.00% | 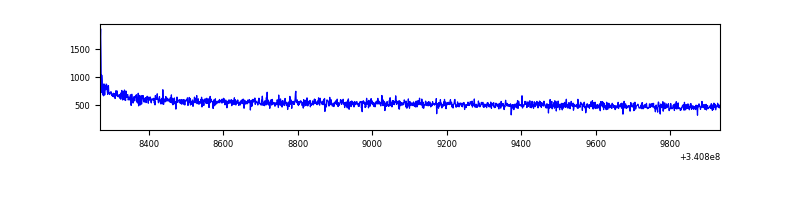 |
| B | 1663 | 1663 | 0 | 0 | 0.00% | 0.00% | 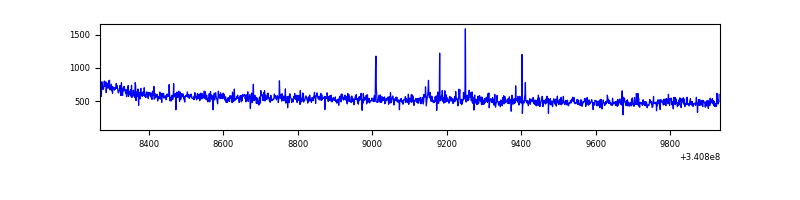 |
| C | 1663 | 1663 | 137 | 137 | 8.24% | 8.24% | 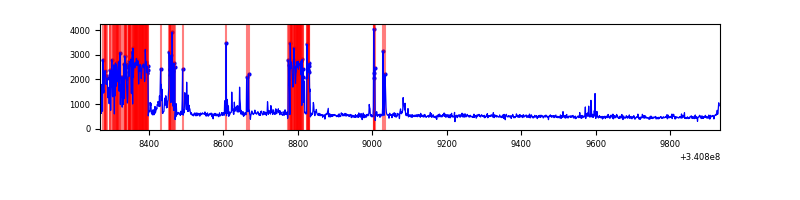 |
| D | 1663 | 1663 | 5 | 5 | 0.30% | 0.30% | 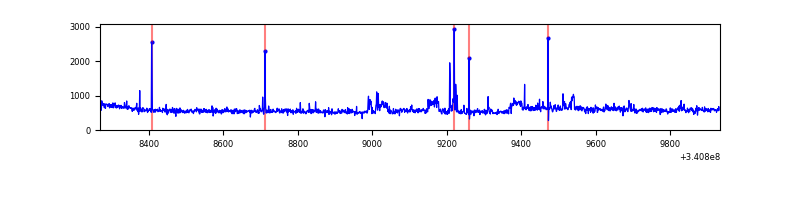 |
Top three noisy pixels from each quadrant. If the there are fewer than three noisy pixels in the level2.evt file, extra rows are filled as -1
| Pixel properties | Quadrant properties | ||||||
|---|---|---|---|---|---|---|---|
| Quadrant | DetID | PixID | Counts | Sigma | Mean | Median | Sigma |
| A | 8 | 192 | 4605 | 93.39 | 228 | 223 | 46.9 |
| A | 13 | 254 | 2734 | 53.51 | 228 | 223 | 46.9 |
| A | 0 | 226 | 1996 | 37.78 | 228 | 223 | 46.9 |
| B | 12 | 111 | 4904 | 107.79 | 224 | 218 | 43.5 |
| B | 11 | 111 | 4429 | 96.86 | 224 | 218 | 43.5 |
| B | 15 | 33 | 4109 | 89.5 | 224 | 218 | 43.5 |
| C | 2 | 16 | 443862 | 9325.21 | 200 | 201 | 47.6 |
| C | 14 | 238 | 32776 | 684.69 | 200 | 201 | 47.6 |
| C | 15 | 208 | 13228 | 273.81 | 200 | 201 | 47.6 |
| D | 10 | 0 | 97477 | 1765.2 | 221 | 216 | 55.1 |
| D | 1 | 52 | 44261 | 799.38 | 221 | 216 | 55.1 |
| D | 2 | 250 | 13438 | 239.97 | 221 | 216 | 55.1 |
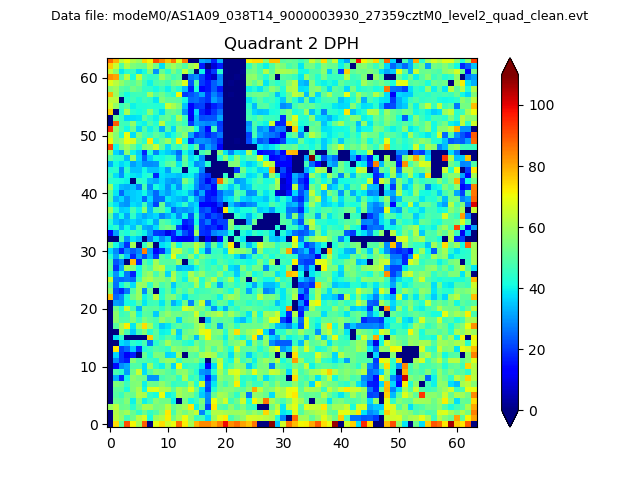
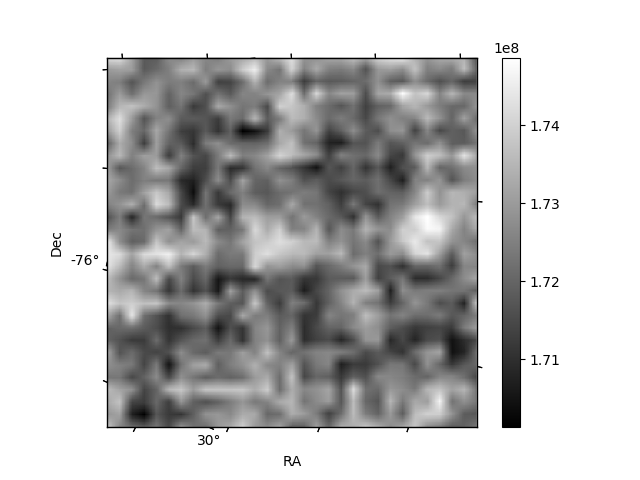
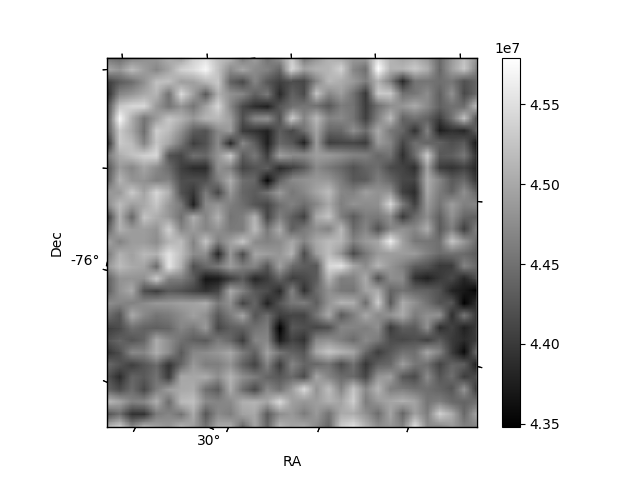
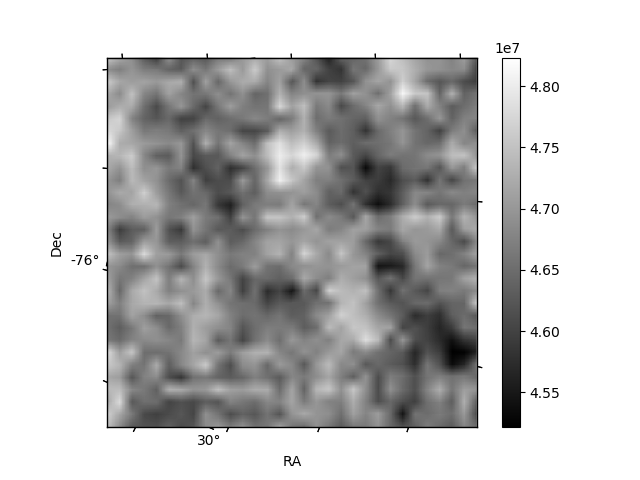
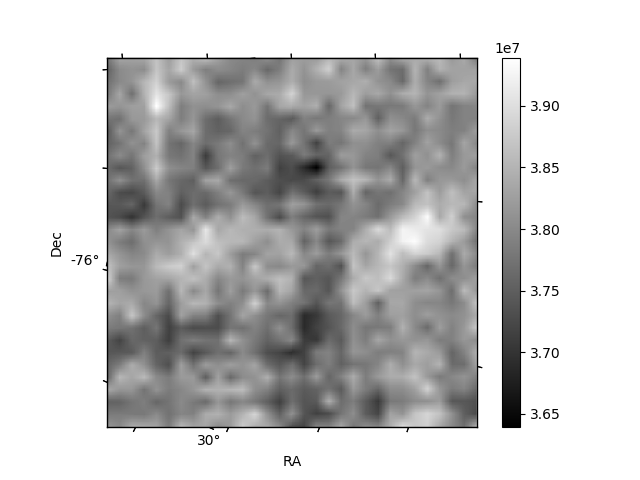
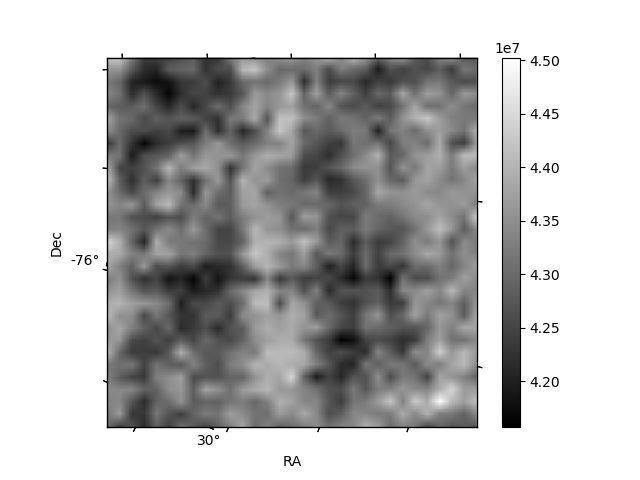
Histogram calculated using DETX and DETY for each event in the final _common_clean file
| Quadrant A | 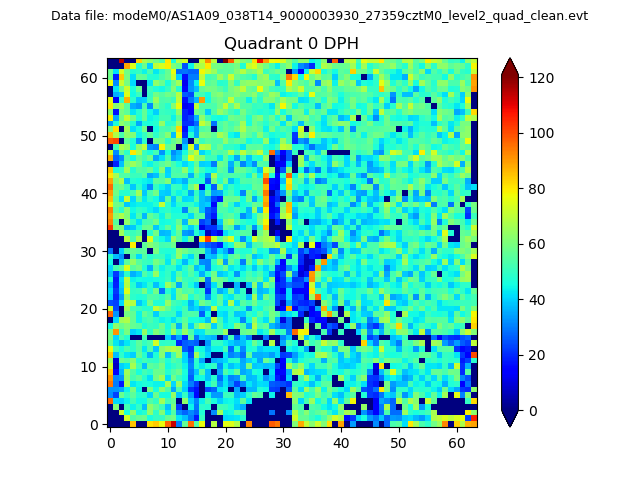 |
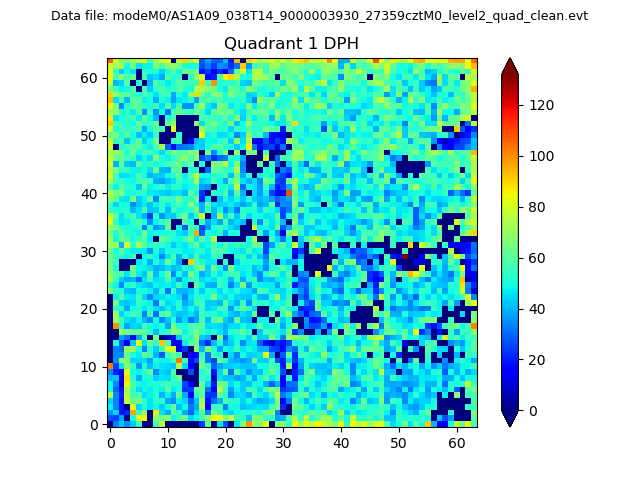 |
Quadrant B |
|---|---|---|---|
| Quadrant D | 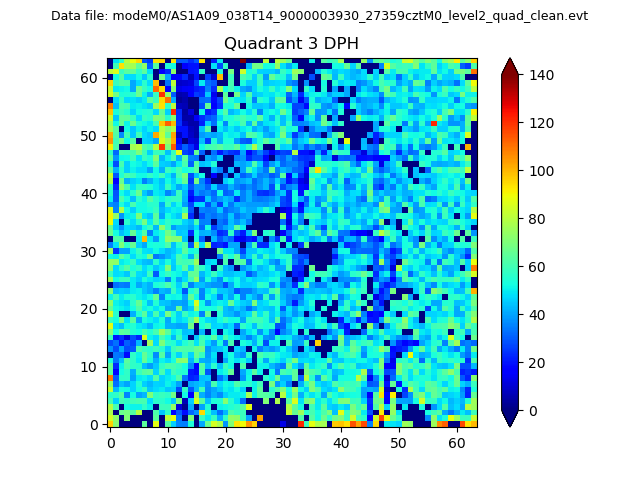 |
 |
Quadrant C |
| Plot type | Count rate plots | Images |
|---|---|---|
| Comparison with Poisson distribution Blue bars denote a histogram of data divided into 1 sec bins. Red curve is a Poisson curve with rate = median count rate of data. |
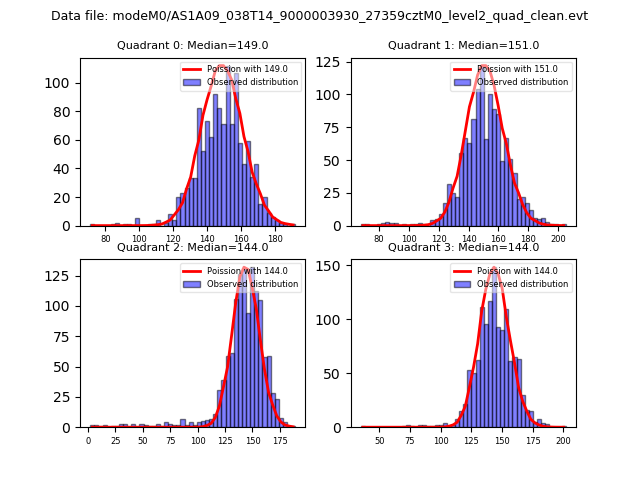 |
 |
| Quadrant-wise count rates Data is divided into 100 sec bins |
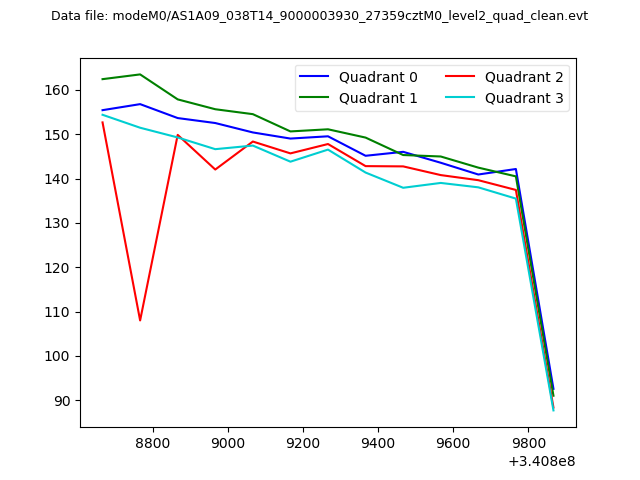 |
|
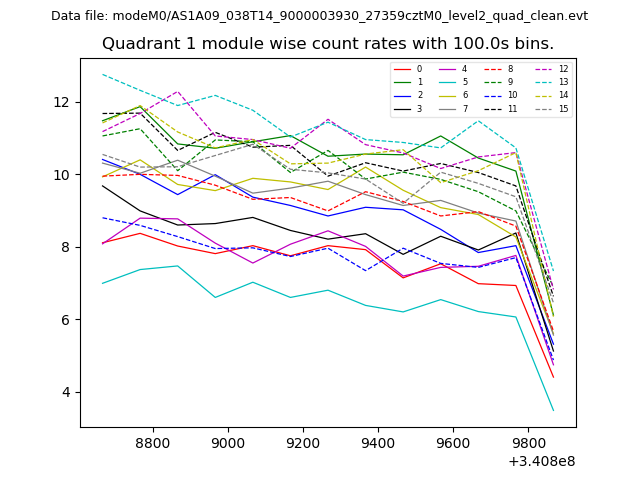
| Module-wise count rates for Quadrant A Data is divided into 100 sec bins |
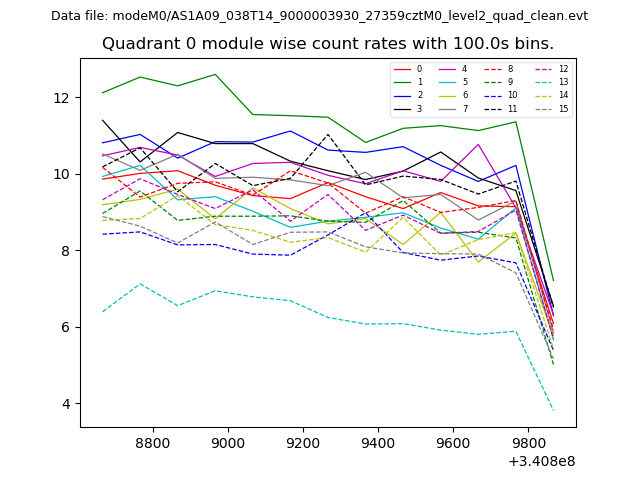 |
 |
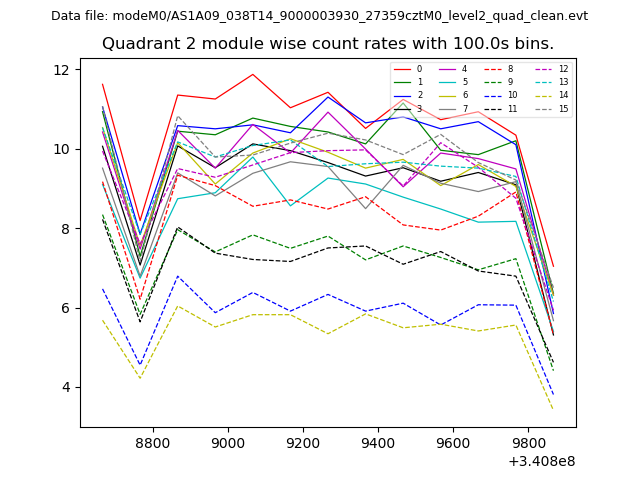
| Module-wise count rates for Quadrant B Data is divided into 100 sec bins |
 |
 |
| Module-wise count rates for Quadrant C Data is divided into 100 sec bins |
 |
 |
| Module-wise count rates for Quadrant D Data is divided into 100 sec bins |
 |
 |
| Parameter | Plot |
|---|---|
| CZT HV Monitor | 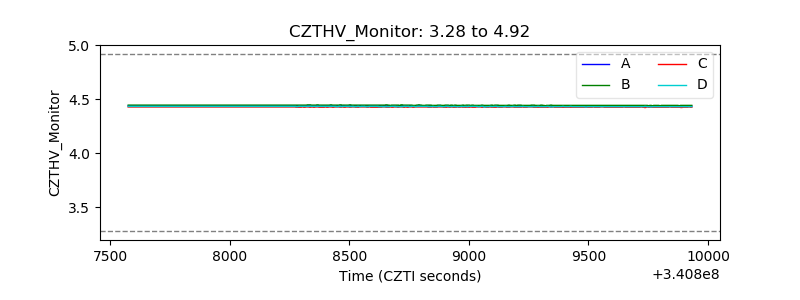 |
| D_VDD | 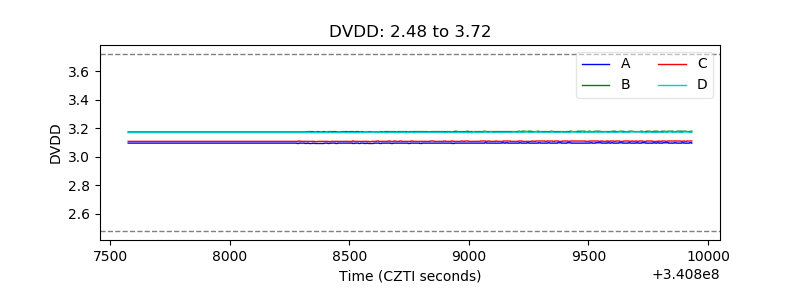 |
| Temperature 1 | 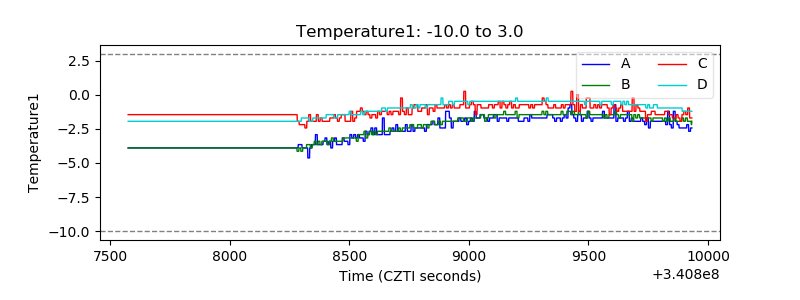 |
| Veto HV Monitor | 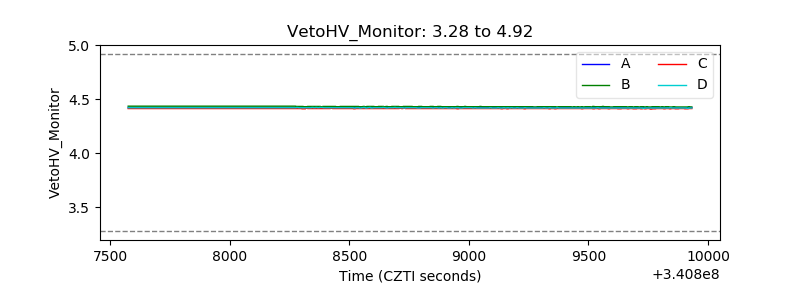 |
| Veto LLD | 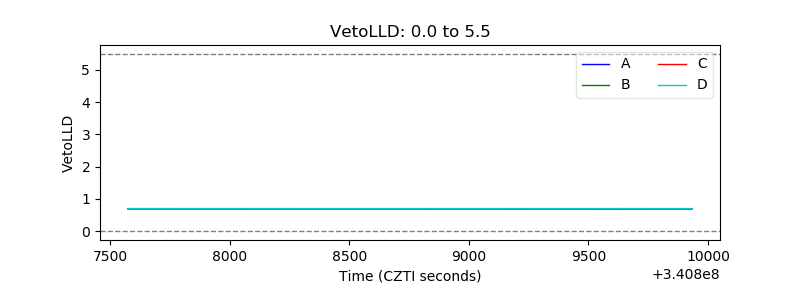 |
| Alpha Counter | 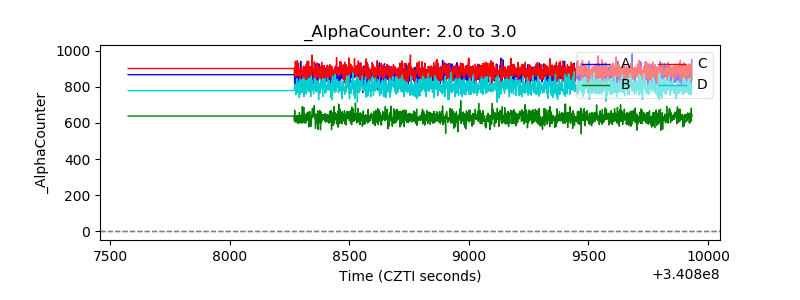 |
| _CPM_Rate | 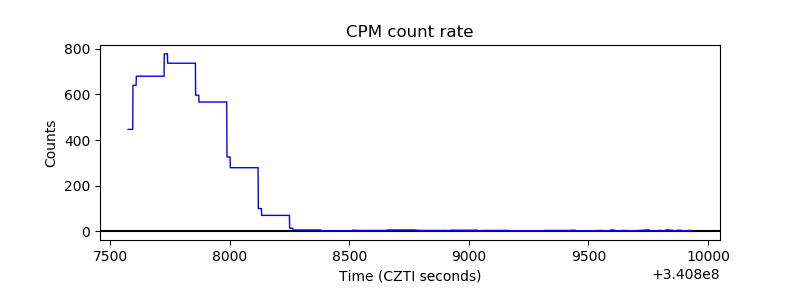 |
| CZT Counter | 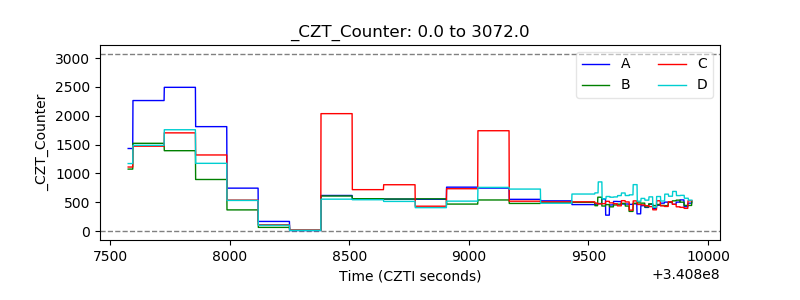 |
| +2.5 Volts monitor |  |
| +5 Volts monitor | 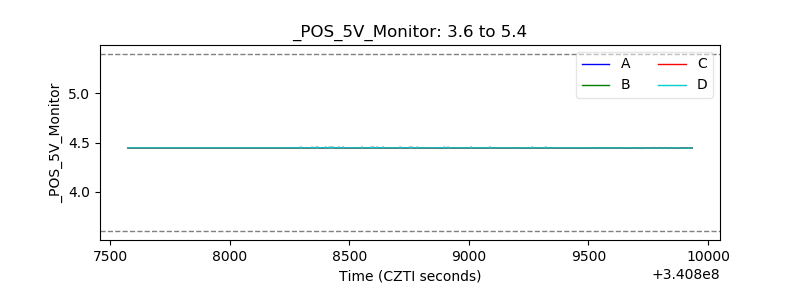 |
| _ROLL_ROT |  |
| _Roll_DEC | 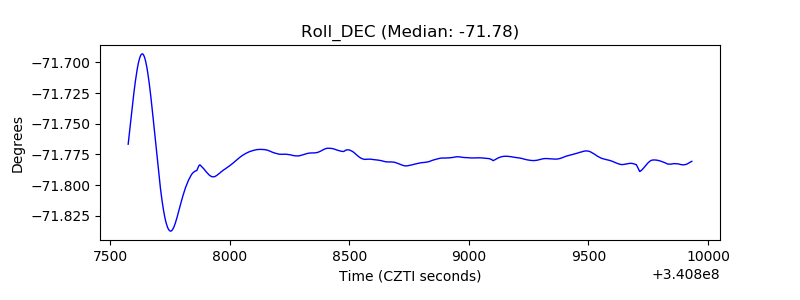 |
| _Roll_RA | 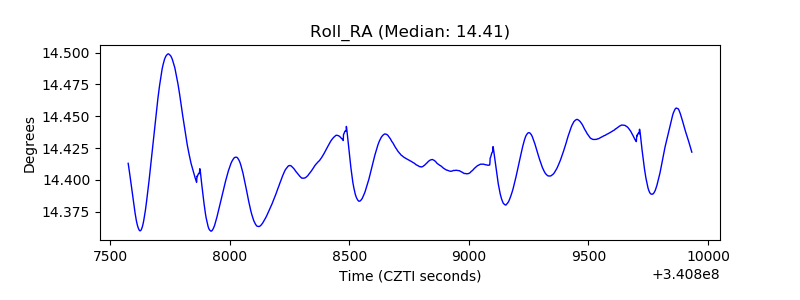 |
| Veto Counter |  |