| Param | Original file | Final file |
|---|---|---|
| Filename | modeM0/AS1A09_038T14_9000003930_27360cztM0_level2.evt | modeM0/AS1A09_038T14_9000003930_27360cztM0_level2_quad_clean.evt |
| Size (bytes) | 314,136,000 | 89,700,480 |
| Size | 299.6 MB | 85.5 MB |
| Events in quadrant A | 2,055,406 | 616,776 |
| Events in quadrant B | 2,125,948 | 621,257 |
| Events in quadrant C | 2,516,150 | 581,503 |
| Events in quadrant D | 2,516,391 | 587,831 |
| Mode M0 | |||
|---|---|---|---|
| Quadrant | BADHDUFLAG | Total packets | Discarded packets |
| A | 0 | 8901 | 0 |
| B | 0 | 9055 | 0 |
| C | 0 | 10319 | 0 |
| D | 0 | 10325 | 0 |
| Quadrant | Total seconds | Saturated seconds | Saturation percentage |
|---|---|---|---|
| A | 4394 | 4 | 0.091033% |
| B | 4395 | 10 | 0.227531% |
| C | 4395 | 149 | 3.390216% |
| D | 4395 | 15 | 0.341297% |
Noise dominated data is calculated using 1-second bins in cleaned event files. If a bin has >2000 counts, and if more than 50% of those come from <1% of pixels, then it is considered to be noise-dominated and hence unusable.
| Quadrant | # 1 sec bins | Bins with >0 counts | Bins with >2000 counts | High rate bins dominated by noise | Noise dominated (total time) | Noise dominated (detector-on time) | Marked lightcurve |
|---|---|---|---|---|---|---|---|
| A | 4394 | 4394 | 3 | 3 | 0.07% | 0.07% | 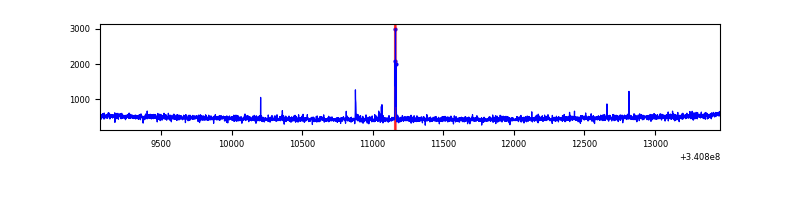 |
| B | 4395 | 4395 | 4 | 4 | 0.09% | 0.09% | 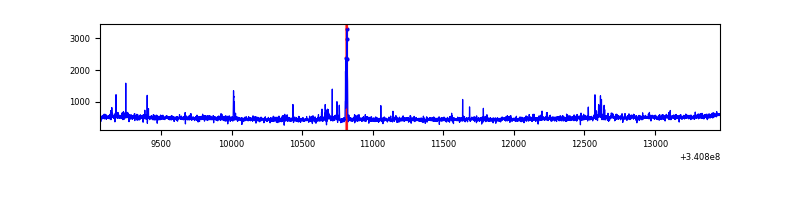 |
| C | 4395 | 4395 | 83 | 83 | 1.89% | 1.89% | 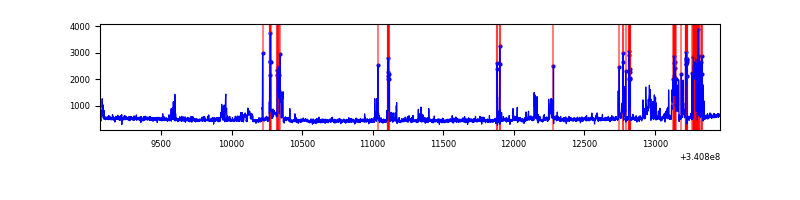 |
| D | 4395 | 4395 | 17 | 17 | 0.39% | 0.39% | 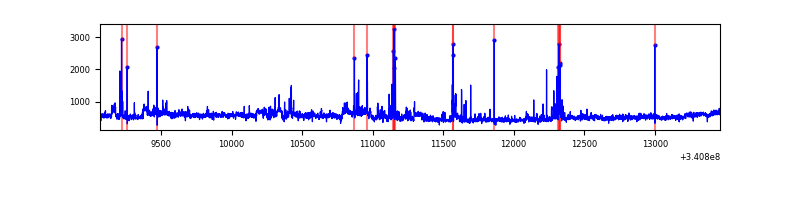 |
Top three noisy pixels from each quadrant. If the there are fewer than three noisy pixels in the level2.evt file, extra rows are filled as -1
| Pixel properties | Quadrant properties | ||||||
|---|---|---|---|---|---|---|---|
| Quadrant | DetID | PixID | Counts | Sigma | Mean | Median | Sigma |
| A | 6 | 16 | 24055 | 224.51 | 526 | 517 | 104.8 |
| A | 13 | 254 | 7696 | 68.47 | 526 | 517 | 104.8 |
| A | 3 | 137 | 4542 | 38.39 | 526 | 517 | 104.8 |
| B | 0 | 190 | 25850 | 259.17 | 524 | 511 | 97.8 |
| B | 10 | 245 | 17841 | 177.25 | 524 | 511 | 97.8 |
| B | 15 | 32 | 14370 | 141.75 | 524 | 511 | 97.8 |
| C | 2 | 16 | 500650 | 4358.37 | 494 | 498 | 114.8 |
| C | 14 | 238 | 81137 | 702.7 | 494 | 498 | 114.8 |
| C | 7 | 247 | 4334 | 33.43 | 494 | 498 | 114.8 |
| D | 10 | 0 | 327229 | 2699.43 | 503 | 492 | 121.0 |
| D | 1 | 52 | 176201 | 1451.67 | 503 | 492 | 121.0 |
| D | 2 | 250 | 65411 | 536.35 | 503 | 492 | 121.0 |
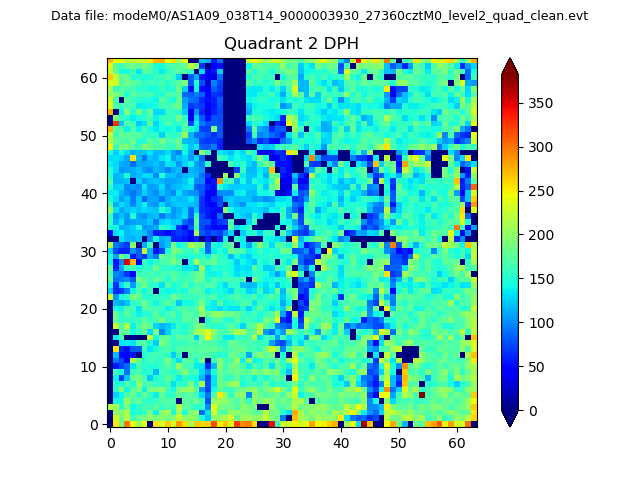
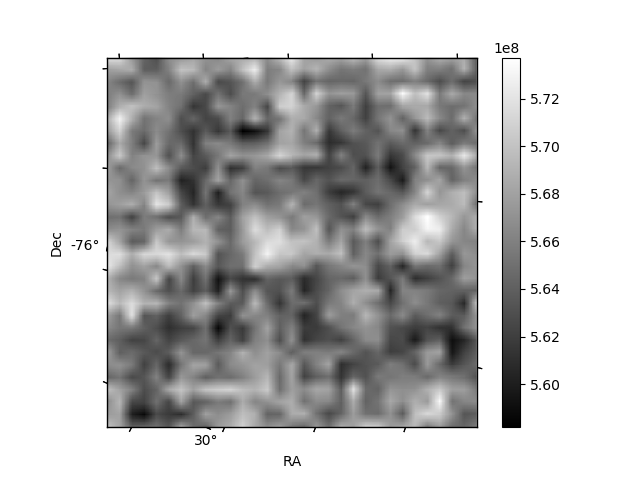
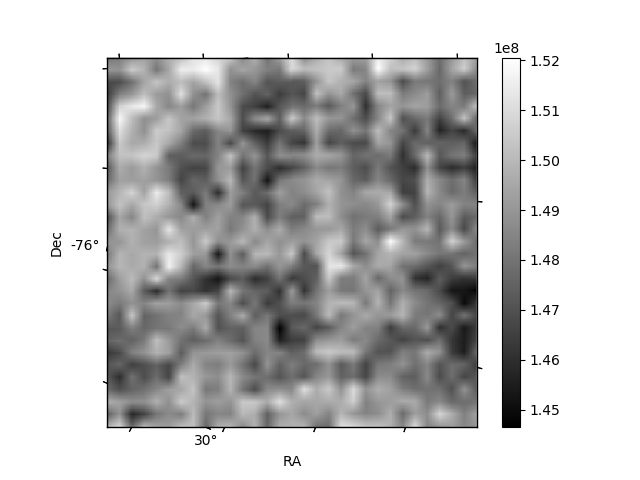
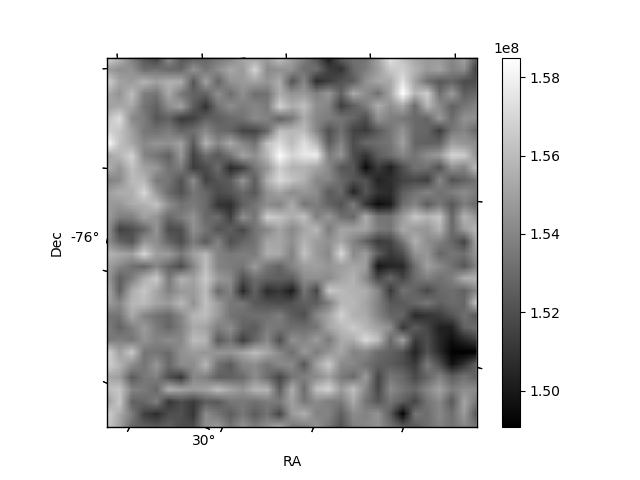
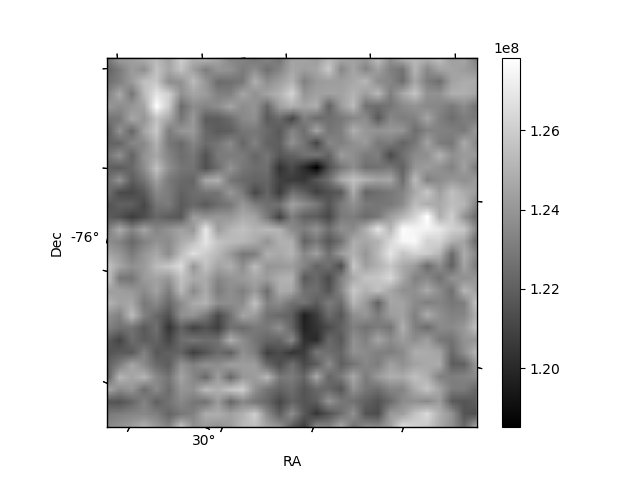
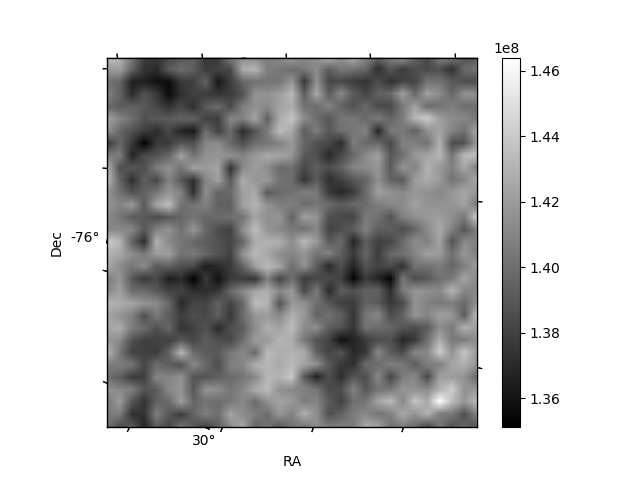
Histogram calculated using DETX and DETY for each event in the final _common_clean file
| Quadrant A | 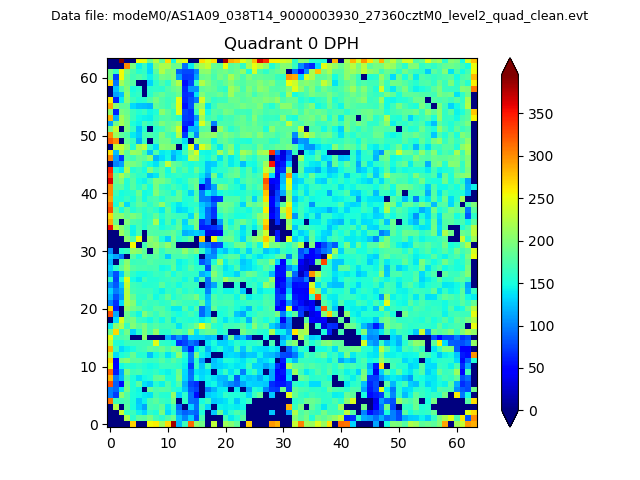 |
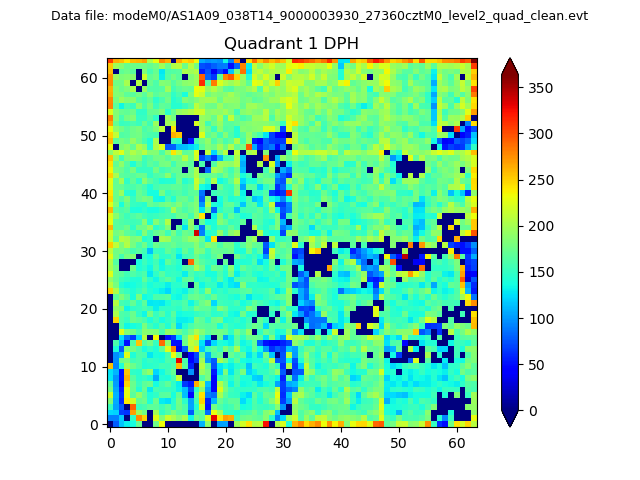 |
Quadrant B |
|---|---|---|---|
| Quadrant D | 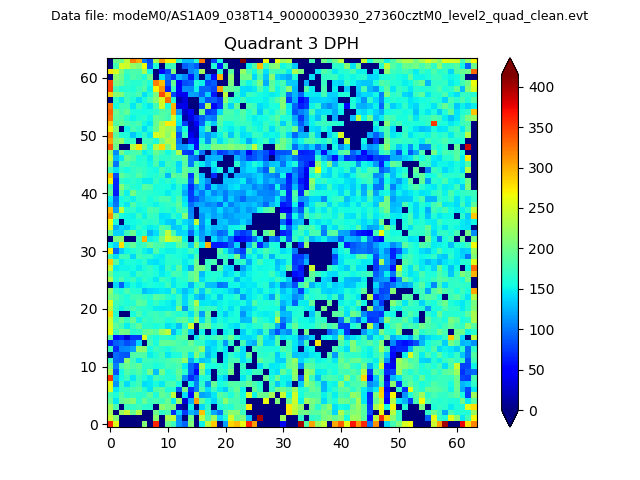 |
 |
Quadrant C |
| Plot type | Count rate plots | Images |
|---|---|---|
| Comparison with Poisson distribution Blue bars denote a histogram of data divided into 1 sec bins. Red curve is a Poisson curve with rate = median count rate of data. |
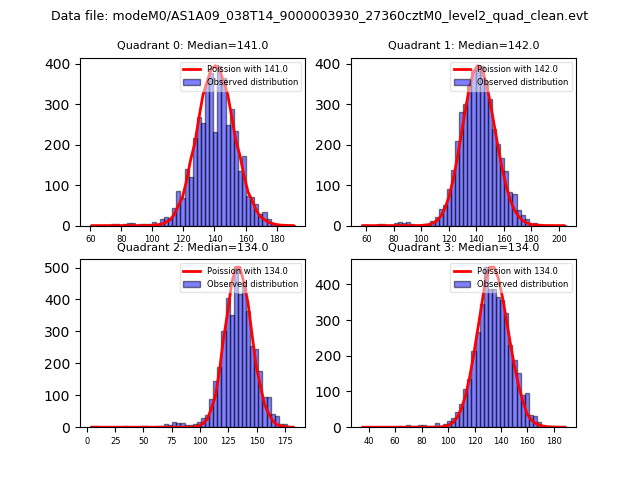 |
 |
| Quadrant-wise count rates Data is divided into 100 sec bins |
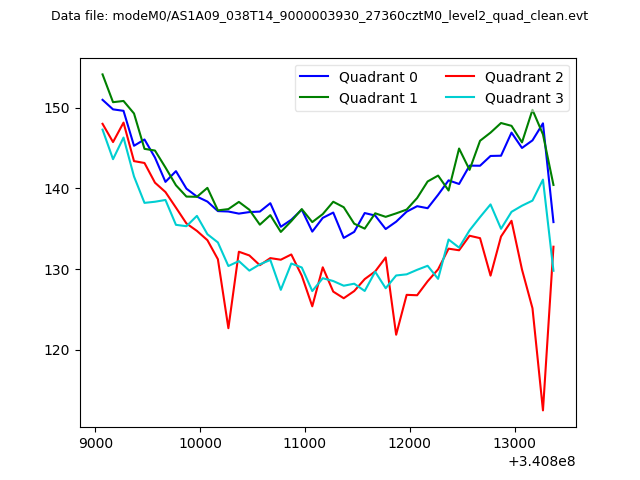 |
|
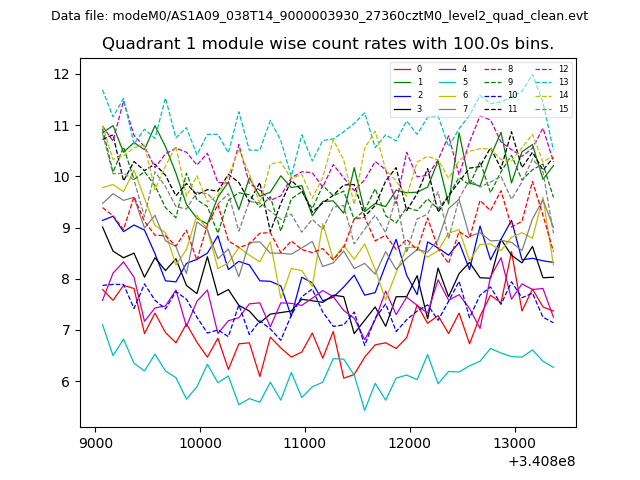
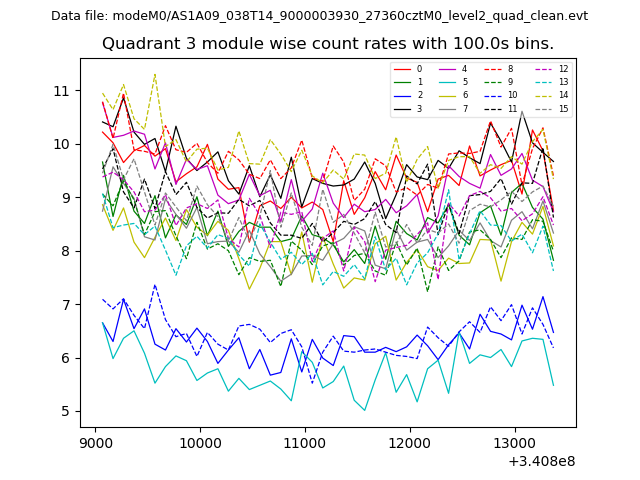
| Module-wise count rates for Quadrant A Data is divided into 100 sec bins |
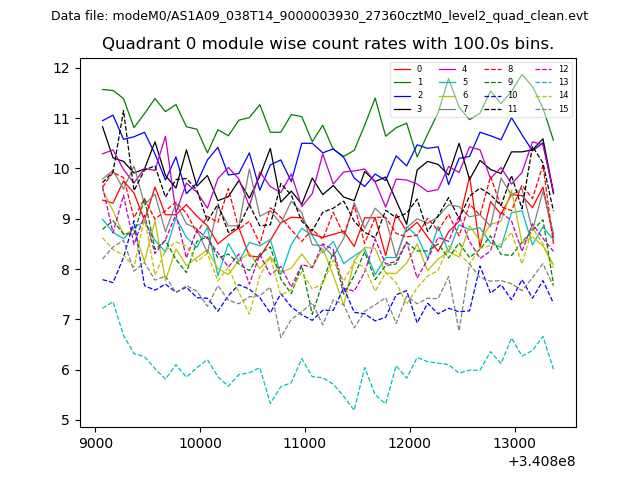 |
 |
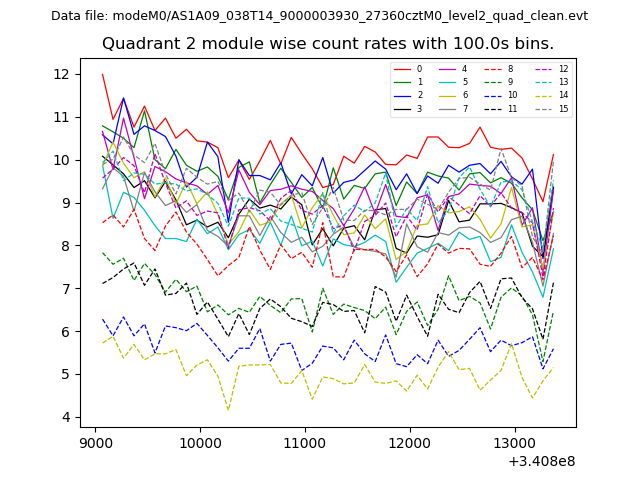
| Module-wise count rates for Quadrant B Data is divided into 100 sec bins |
 |
 |
| Module-wise count rates for Quadrant C Data is divided into 100 sec bins |
 |
 |
| Module-wise count rates for Quadrant D Data is divided into 100 sec bins |
 |
 |
| Parameter | Plot |
|---|---|
| CZT HV Monitor | 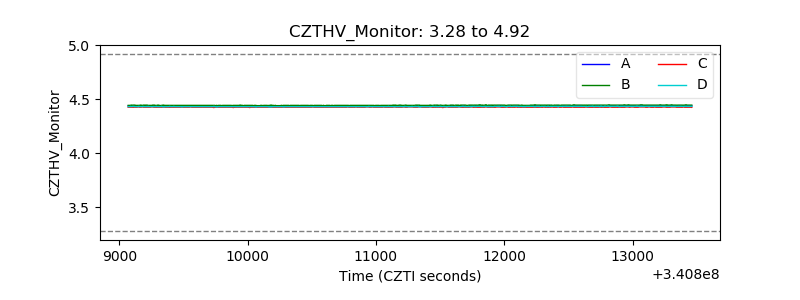 |
| D_VDD | 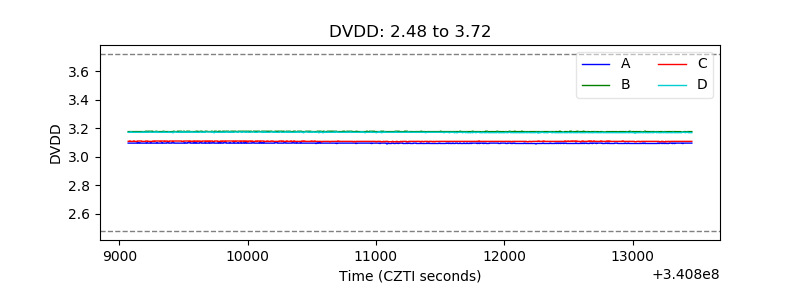 |
| Temperature 1 | 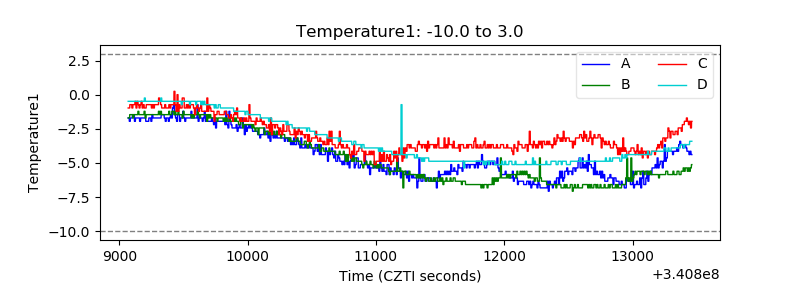 |
| Veto HV Monitor |  |
| Veto LLD | 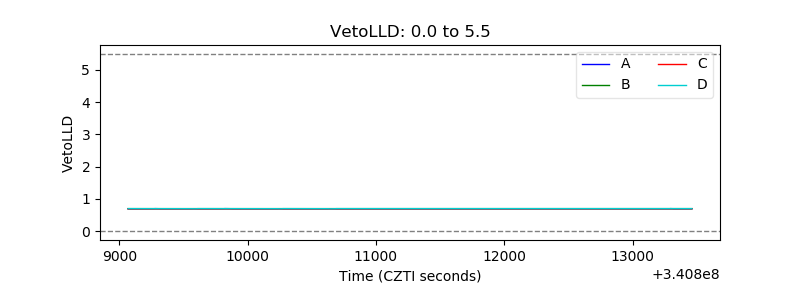 |
| Alpha Counter | 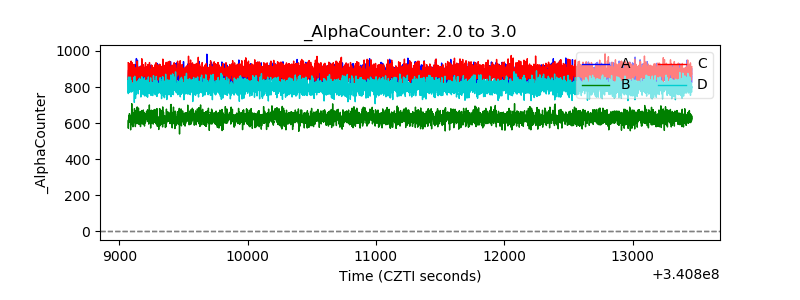 |
| _CPM_Rate |  |
| CZT Counter | 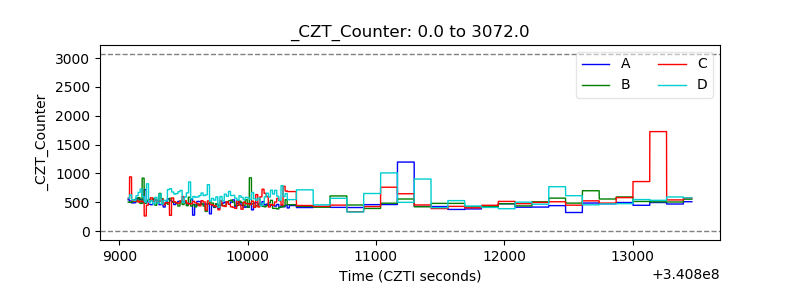 |
| +2.5 Volts monitor | 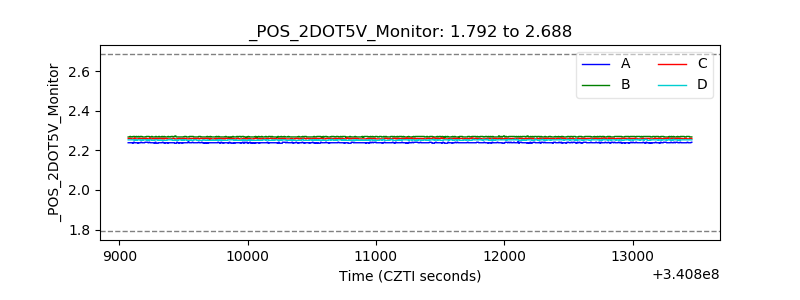 |
| +5 Volts monitor |  |
| _ROLL_ROT | 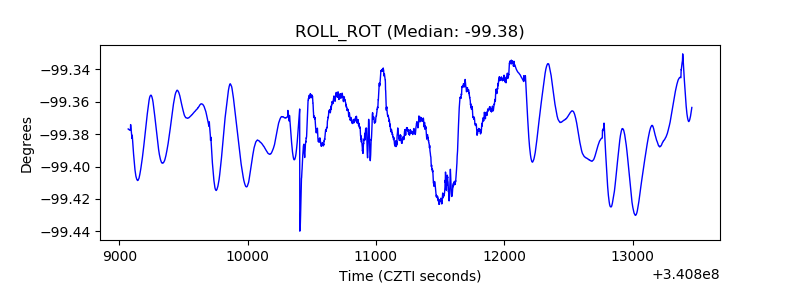 |
| _Roll_DEC | 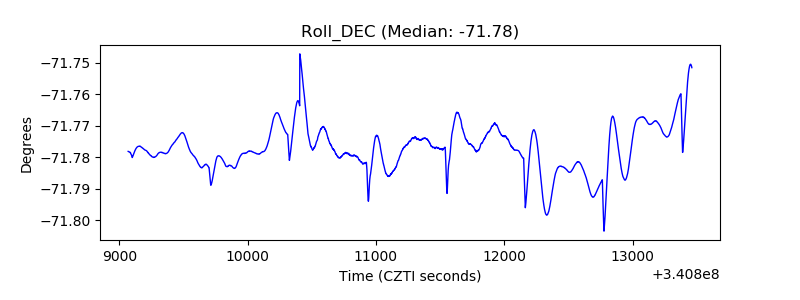 |
| _Roll_RA | 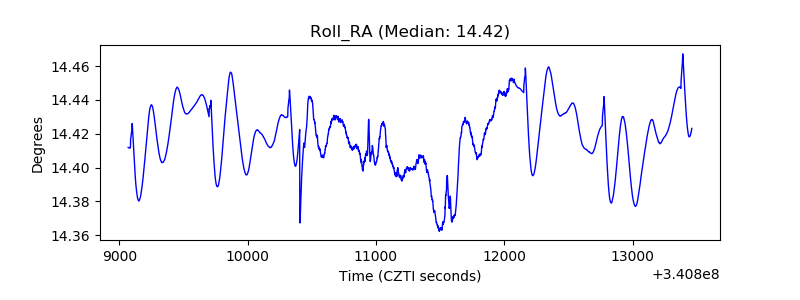 |
| Veto Counter | 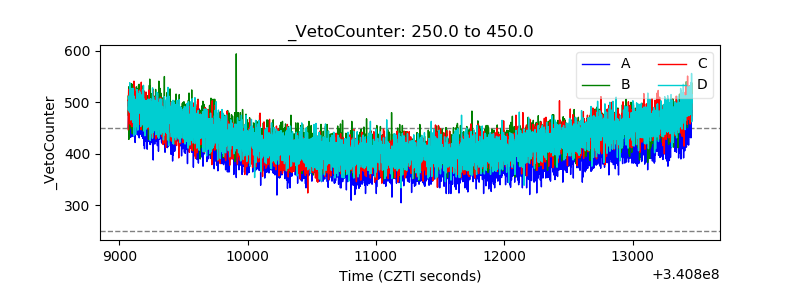 |