| Param | Original file | Final file |
|---|---|---|
| Filename | modeM0/AS1A09_038T15_9000003932cztM0_level2.fits | modeM0/AS1A09_038T15_9000003932cztM0_level2_quad_clean.evt |
| Size (bytes) | 50,529,600 | 72,443,520 |
| Size | 48.2 MB | 69.1 MB |
| Events in quadrant A | 316,432 | 493,141 |
| Events in quadrant B | 304,954 | 492,870 |
| Events in quadrant C | 271,446 | 412,213 |
| Events in quadrant D | 269,304 | 427,165 |
| Mode M9 | |||
|---|---|---|---|
| Quadrant | BADHDUFLAG | Total packets | Discarded packets |
| A | 0 | 7 | 0 |
| B | 0 | 7 | 0 |
| C | 0 | 7 | 0 |
| D | 0 | 7 | 0 |
| Mode M0 | |||
|---|---|---|---|
| Quadrant | BADHDUFLAG | Total packets | Discarded packets |
| A | 0 | 10661 | 0 |
| B | 0 | 11016 | 0 |
| C | 0 | 16105 | 0 |
| D | 0 | 13151 | 0 |
| Mode SS | |||
|---|---|---|---|
| Quadrant | BADHDUFLAG | Total packets | Discarded packets |
| A | 0 | 104 | 0 |
| B | 0 | 104 | 0 |
| C | 0 | 104 | 0 |
| D | 0 | 104 | 0 |
| Quadrant | Total seconds | Saturated seconds | Saturation percentage |
|---|---|---|---|
| A | 5258 | 7 | 0.133130% |
| B | 5258 | 22 | 0.418410% |
| C | 5258 | 823 | 15.652339% |
| D | 5258 | 68 | 1.293267% |
Noise dominated data is calculated using 1-second bins in cleaned event files. If a bin has >2000 counts, and if more than 50% of those come from <1% of pixels, then it is considered to be noise-dominated and hence unusable.
| Quadrant | # 1 sec bins | Bins with >0 counts | Bins with >2000 counts | High rate bins dominated by noise | Noise dominated (total time) | Noise dominated (detector-on time) | Marked lightcurve |
|---|---|---|---|---|---|---|---|
| A | 5257 | 5257 | 0 | 0 | 0.00% | 0.00% |  |
| B | 5257 | 5257 | 0 | 0 | 0.00% | 0.00% |  |
| C | 5257 | 5193 | 0 | 0 | 0.00% | 0.00% |  |
| D | 5257 | 5252 | 0 | 0 | 0.00% | 0.00% |  |
Top three noisy pixels from each quadrant. If the there are fewer than three noisy pixels in the level2.evt file, extra rows are filled as -1
| Pixel properties | Quadrant properties | ||||||
|---|---|---|---|---|---|---|---|
| Quadrant | DetID | PixID | Counts | Sigma | Mean | Median | Sigma |
| A | 0 | 29 | 317 | 10.8 | 82 | 78 | 22.1 |
| A | 0 | 30 | 249 | 7.73 | 82 | 78 | 22.1 |
| A | 9 | 19 | 246 | 7.59 | 82 | 78 | 22.1 |
| B | 5 | 255 | 209 | 7.39 | 80 | 77 | 17.9 |
| B | 2 | 9 | 208 | 7.34 | 80 | 77 | 17.9 |
| B | 3 | 17 | 204 | 7.11 | 80 | 77 | 17.9 |
| C | 12 | 241 | 208 | 7.17 | 71 | 67 | 19.7 |
| C | 4 | 254 | 197 | 6.61 | 71 | 67 | 19.7 |
| C | 3 | 187 | 196 | 6.56 | 71 | 67 | 19.7 |
| D | 7 | 3 | 217 | 6.64 | 76 | 70 | 22.1 |
| D | 10 | 189 | 215 | 6.55 | 76 | 70 | 22.1 |
| D | 3 | 14 | 211 | 6.37 | 76 | 70 | 22.1 |
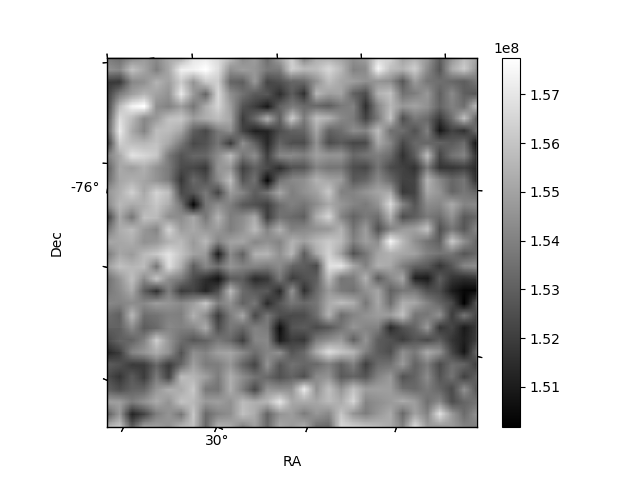
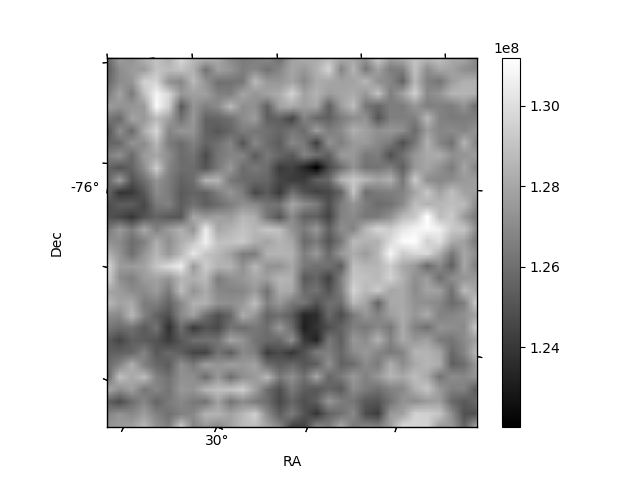
Histogram calculated using DETX and DETY for each event in the final _common_clean file
| Quadrant A |  |
 |
Quadrant B |
|---|---|---|---|
| Quadrant D |  |
 |
Quadrant C |
| Plot type | Count rate plots | Images |
|---|---|---|
| Comparison with Poisson distribution Blue bars denote a histogram of data divided into 1 sec bins. Red curve is a Poisson curve with rate = median count rate of data. |
 |
 |
| Quadrant-wise count rates Data is divided into 100 sec bins |
 |
|
| Module-wise count rates for Quadrant A Data is divided into 100 sec bins |
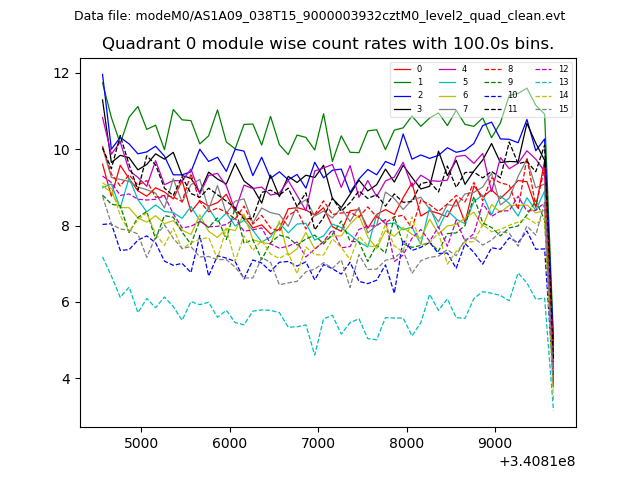 |
 |
| Module-wise count rates for Quadrant B Data is divided into 100 sec bins |
 |
 |
| Module-wise count rates for Quadrant C Data is divided into 100 sec bins |
 |
 |
| Module-wise count rates for Quadrant D Data is divided into 100 sec bins |
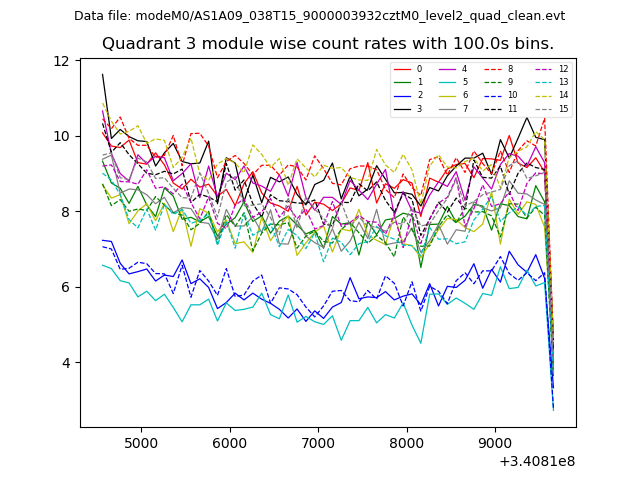 |
 |
| Parameter | Plot |
|---|---|
| CZT HV Monitor |  |
| D_VDD | 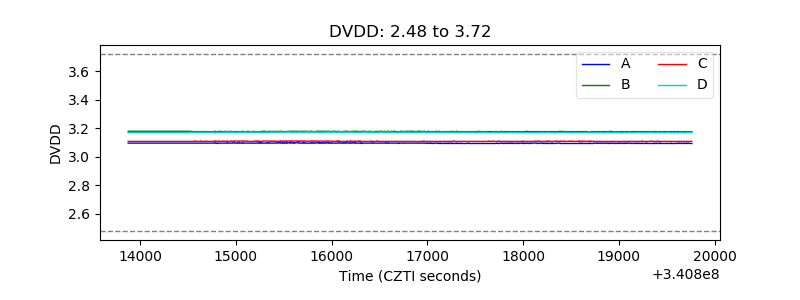 |
| Temperature 1 |  |
| Veto HV Monitor |  |
| Veto LLD |  |
| Alpha Counter |  |
| _CPM_Rate |  |
| CZT Counter |  |
| +2.5 Volts monitor |  |
| +5 Volts monitor | 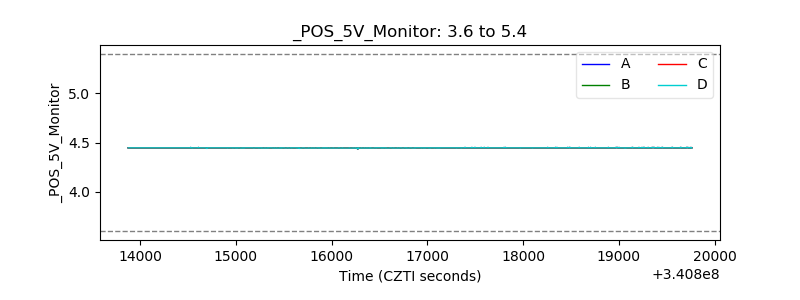 |
| _ROLL_ROT |  |
| _Roll_DEC |  |
| _Roll_RA | 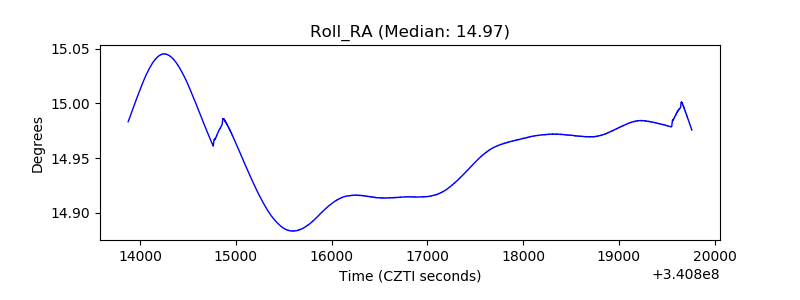 |
| Veto Counter |  |