| Param | Original file | Final file |
|---|---|---|
| Filename | modeM0/AS1A09_038T15_9000003932_27360cztM0_level2.evt | modeM0/AS1A09_038T15_9000003932_27360cztM0_level2_quad_clean.evt |
| Size (bytes) | 137,200,320 | 30,286,080 |
| Size | 130.8 MB | 28.9 MB |
| Events in quadrant A | 775,033 | 206,296 |
| Events in quadrant B | 875,806 | 209,507 |
| Events in quadrant C | 1,376,431 | 187,865 |
| Events in quadrant D | 1,020,064 | 198,550 |
| Mode M9 | |||
|---|---|---|---|
| Quadrant | BADHDUFLAG | Total packets | Discarded packets |
| A | 0 | 7 | 0 |
| B | 0 | 7 | 0 |
| C | 0 | 7 | 0 |
| D | 0 | 7 | 0 |
| Mode M0 | |||
|---|---|---|---|
| Quadrant | BADHDUFLAG | Total packets | Discarded packets |
| A | 0 | 3219 | 0 |
| B | 0 | 3528 | 0 |
| C | 0 | 5109 | 0 |
| D | 0 | 4017 | 0 |
| Quadrant | Total seconds | Saturated seconds | Saturation percentage |
|---|---|---|---|
| A | 1551 | 7 | 0.451322% |
| B | 1551 | 15 | 0.967118% |
| C | 1550 | 282 | 18.193548% |
| D | 1550 | 21 | 1.354839% |
Noise dominated data is calculated using 1-second bins in cleaned event files. If a bin has >2000 counts, and if more than 50% of those come from <1% of pixels, then it is considered to be noise-dominated and hence unusable.
| Quadrant | # 1 sec bins | Bins with >0 counts | Bins with >2000 counts | High rate bins dominated by noise | Noise dominated (total time) | Noise dominated (detector-on time) | Marked lightcurve |
|---|---|---|---|---|---|---|---|
| A | 1551 | 1551 | 0 | 0 | 0.00% | 0.00% | 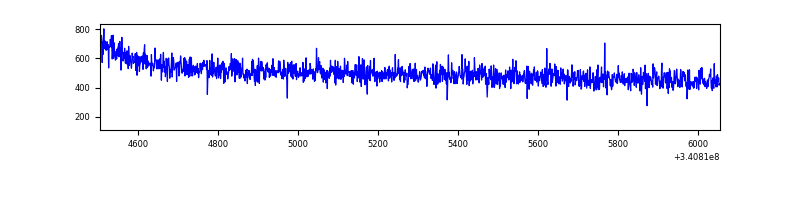 |
| B | 1551 | 1551 | 0 | 0 | 0.00% | 0.00% | 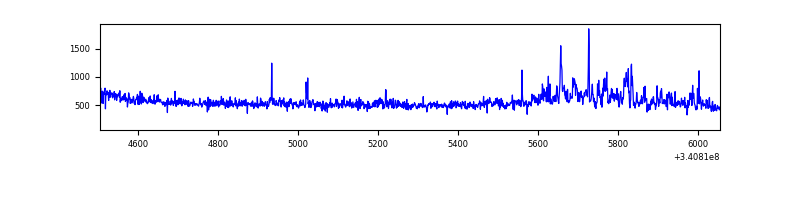 |
| C | 1549 | 1549 | 144 | 144 | 9.30% | 9.30% | 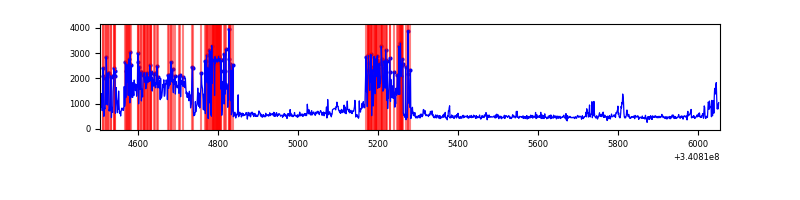 |
| D | 1550 | 1550 | 12 | 12 | 0.77% | 0.77% | 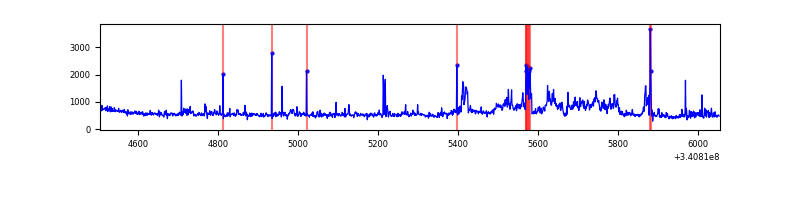 |
Top three noisy pixels from each quadrant. If the there are fewer than three noisy pixels in the level2.evt file, extra rows are filled as -1
| Pixel properties | Quadrant properties | ||||||
|---|---|---|---|---|---|---|---|
| Quadrant | DetID | PixID | Counts | Sigma | Mean | Median | Sigma |
| A | 13 | 254 | 2667 | 58.69 | 200 | 196 | 42.1 |
| A | 0 | 226 | 1844 | 39.14 | 200 | 196 | 42.1 |
| A | 3 | 137 | 1841 | 39.07 | 200 | 196 | 42.1 |
| B | 10 | 245 | 49689 | 1247.5 | 197 | 193 | 39.7 |
| B | 15 | 32 | 44934 | 1127.66 | 197 | 193 | 39.7 |
| B | 12 | 111 | 4212 | 101.3 | 197 | 193 | 39.7 |
| C | 2 | 16 | 652711 | 15522.54 | 175 | 176 | 42.0 |
| C | 14 | 238 | 28669 | 677.79 | 175 | 176 | 42.0 |
| C | 0 | 207 | 3130 | 70.27 | 175 | 176 | 42.0 |
| D | 1 | 52 | 126915 | 2493.49 | 190 | 186 | 50.8 |
| D | 12 | 227 | 116111 | 2280.91 | 190 | 186 | 50.8 |
| D | 2 | 250 | 30695 | 600.29 | 190 | 186 | 50.8 |
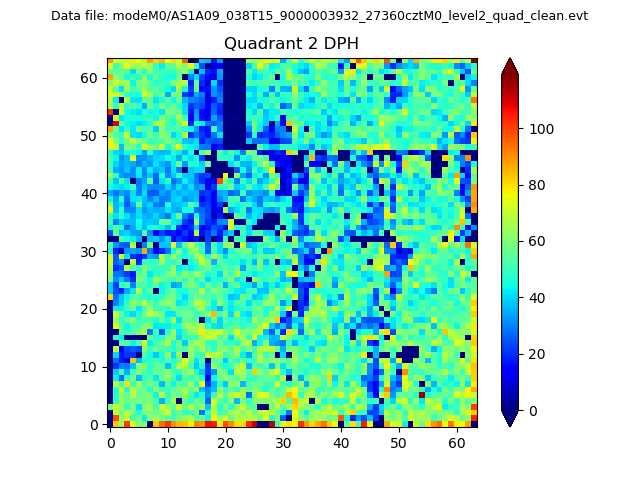
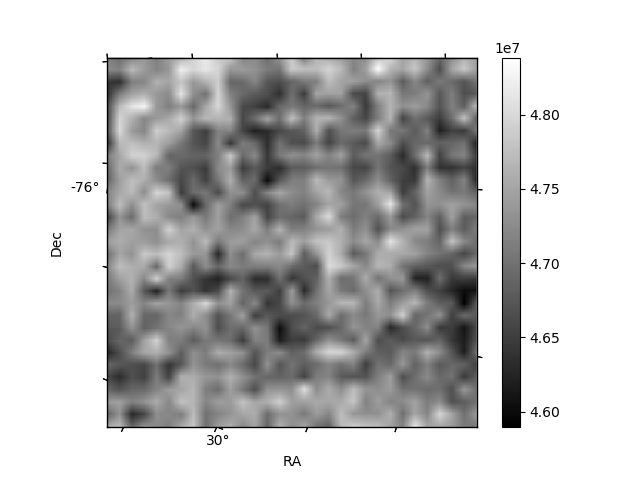
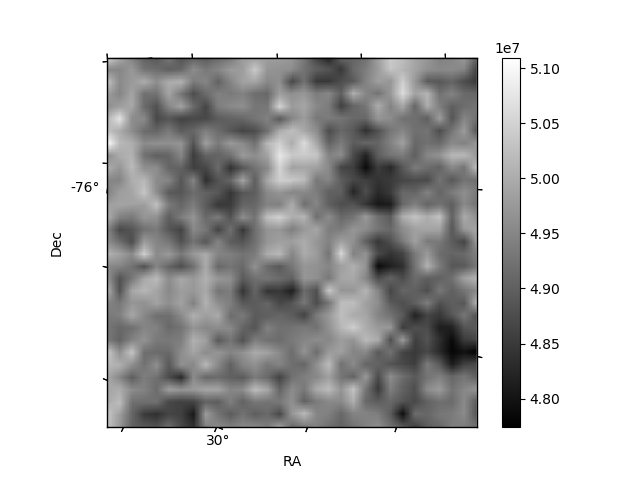
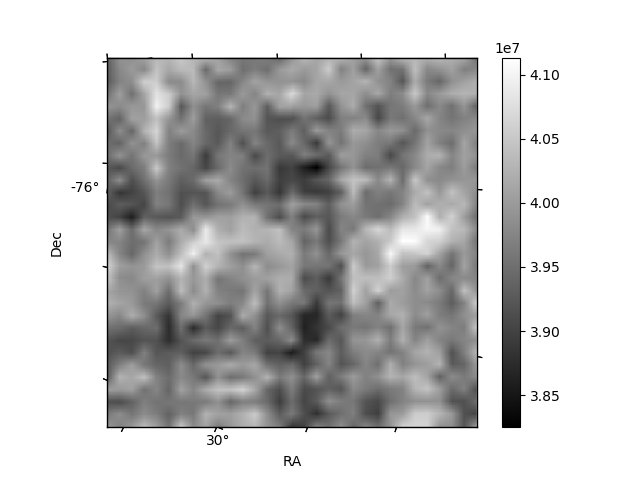
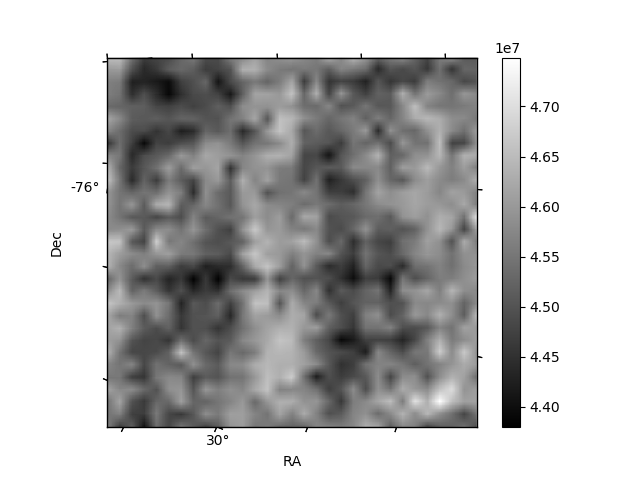
Histogram calculated using DETX and DETY for each event in the final _common_clean file
| Quadrant A | 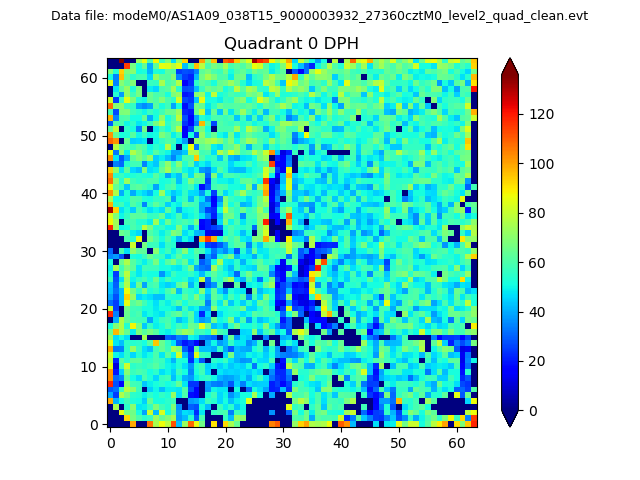 |
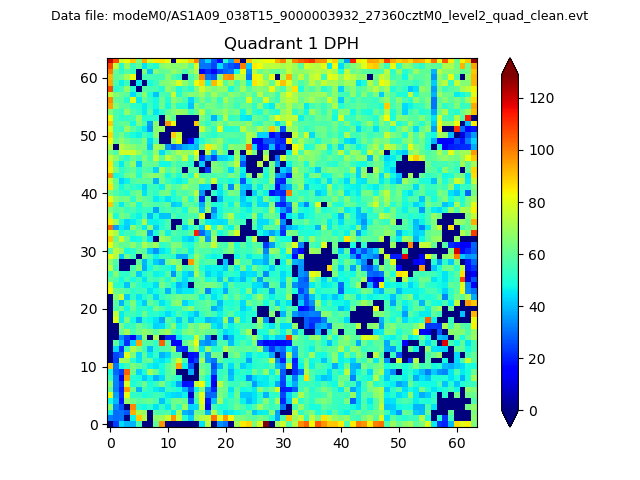 |
Quadrant B |
|---|---|---|---|
| Quadrant D | 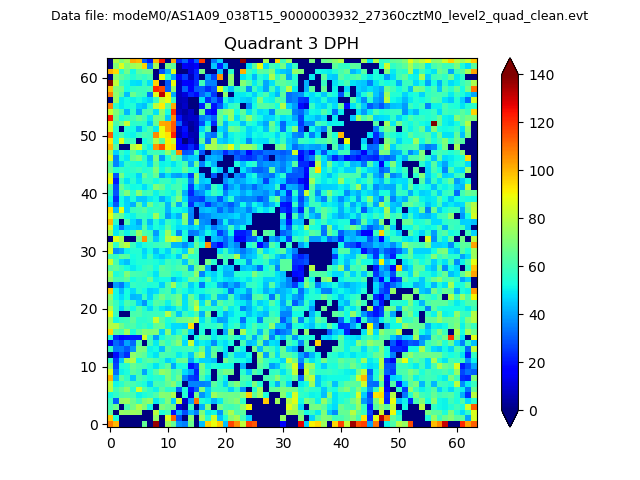 |
 |
Quadrant C |
| Plot type | Count rate plots | Images |
|---|---|---|
| Comparison with Poisson distribution Blue bars denote a histogram of data divided into 1 sec bins. Red curve is a Poisson curve with rate = median count rate of data. |
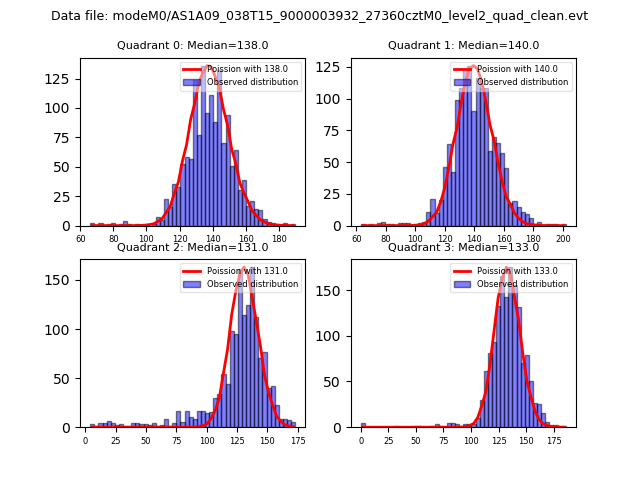 |
 |
| Quadrant-wise count rates Data is divided into 100 sec bins |
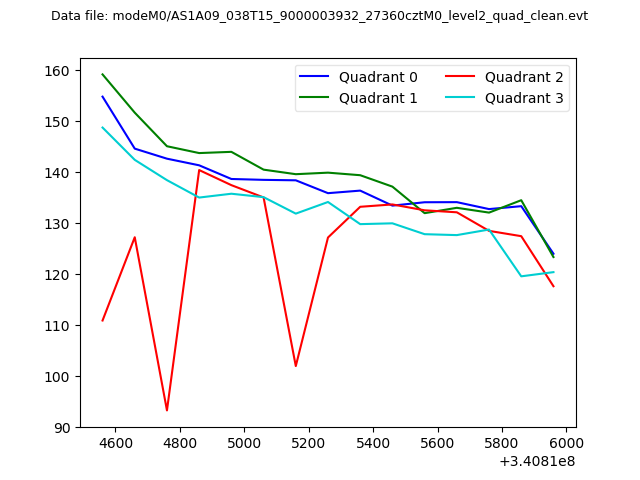 |
|
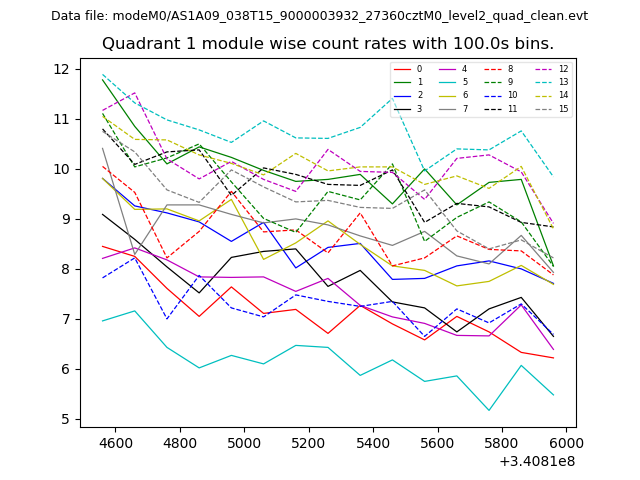
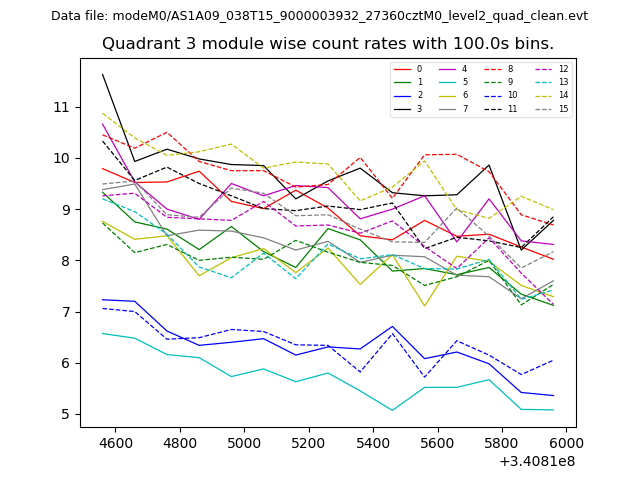
| Module-wise count rates for Quadrant A Data is divided into 100 sec bins |
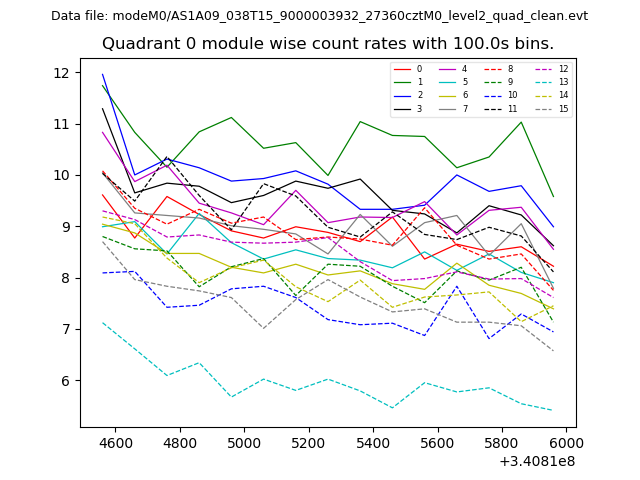 |
 |
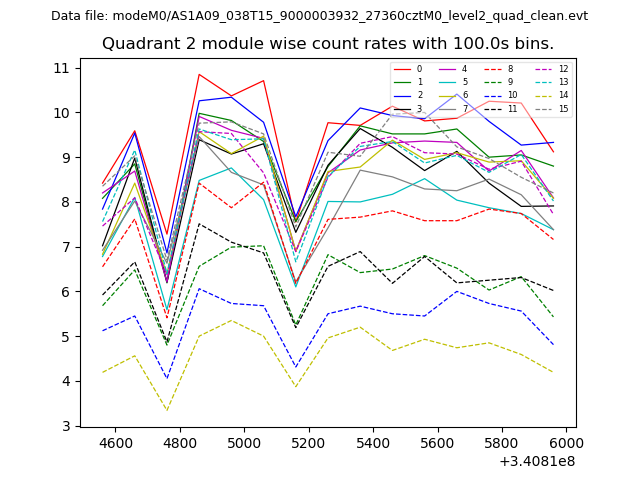
| Module-wise count rates for Quadrant B Data is divided into 100 sec bins |
 |
 |
| Module-wise count rates for Quadrant C Data is divided into 100 sec bins |
 |
 |
| Module-wise count rates for Quadrant D Data is divided into 100 sec bins |
 |
 |
| Parameter | Plot |
|---|---|
| CZT HV Monitor | 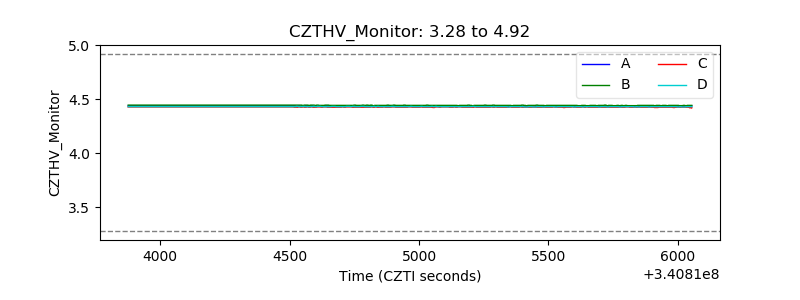 |
| D_VDD | 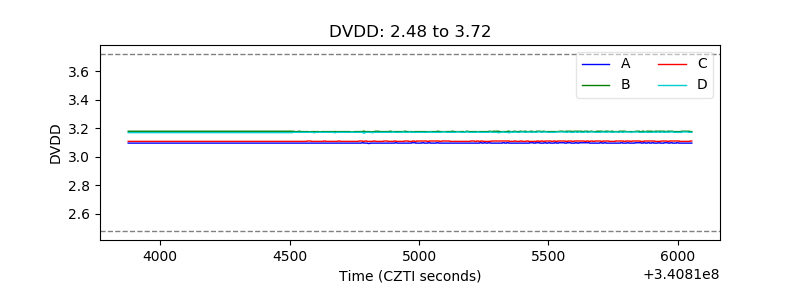 |
| Temperature 1 | 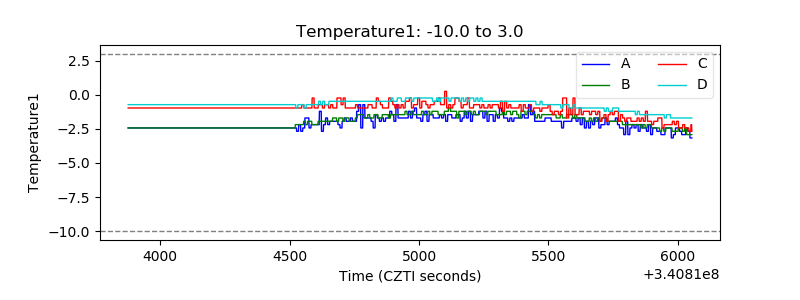 |
| Veto HV Monitor | 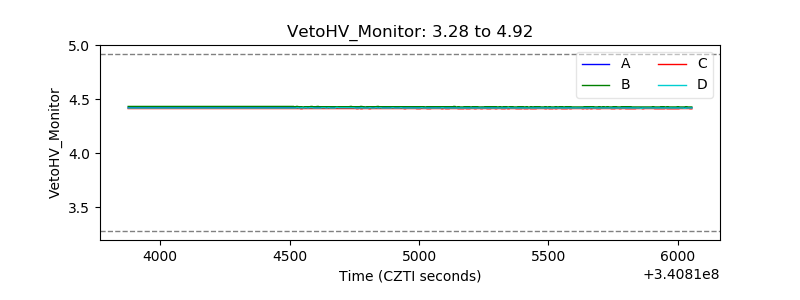 |
| Veto LLD | 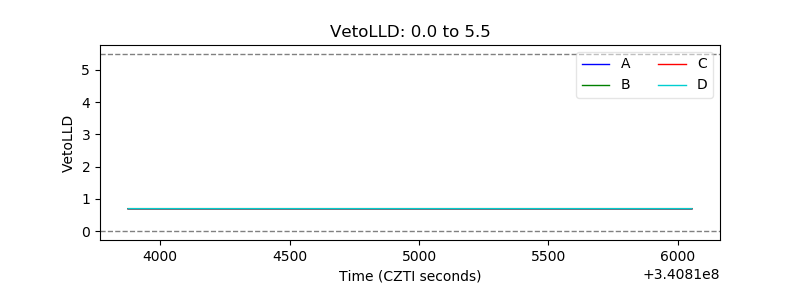 |
| Alpha Counter |  |
| _CPM_Rate | 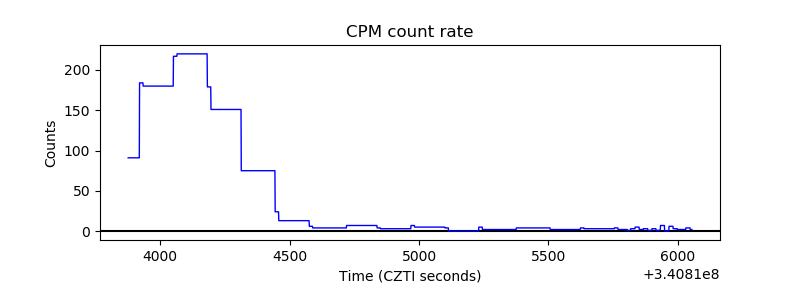 |
| CZT Counter |  |
| +2.5 Volts monitor |  |
| +5 Volts monitor |  |
| _ROLL_ROT | 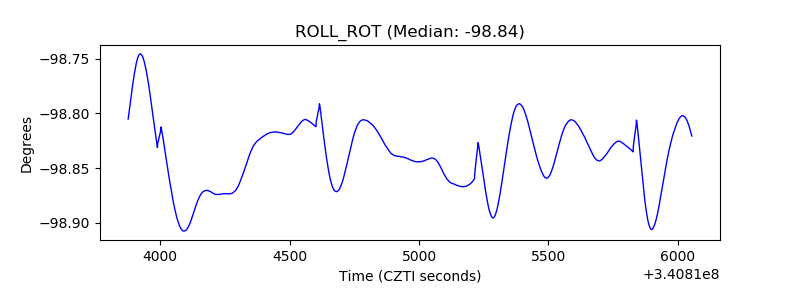 |
| _Roll_DEC | 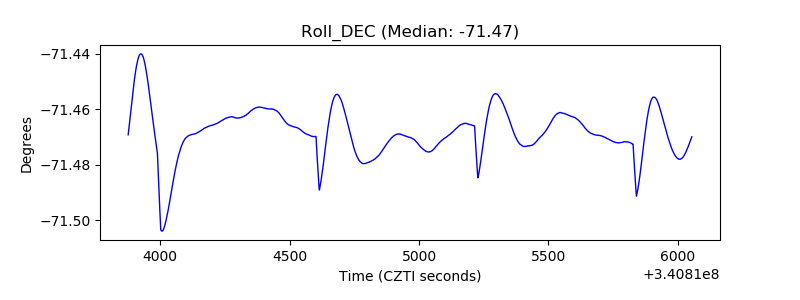 |
| _Roll_RA |  |
| Veto Counter | 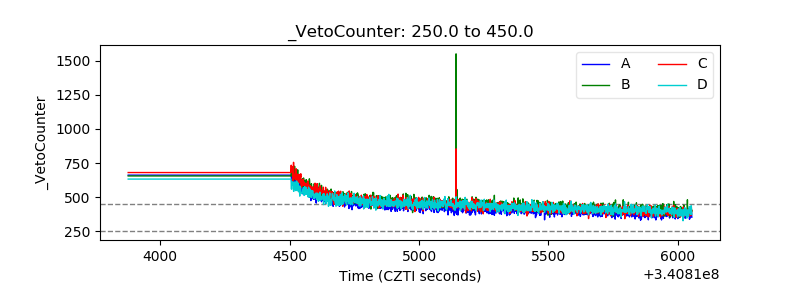 |