| Param | Original file | Final file |
|---|---|---|
| Filename | modeM0/AS1A09_038T15_9000003932_27361cztM0_level2.evt | modeM0/AS1A09_038T15_9000003932_27361cztM0_level2_quad_clean.evt |
| Size (bytes) | 362,347,200 | 87,822,720 |
| Size | 345.6 MB | 83.8 MB |
| Events in quadrant A | 2,078,278 | 610,214 |
| Events in quadrant B | 2,227,988 | 617,203 |
| Events in quadrant C | 3,464,455 | 529,908 |
| Events in quadrant D | 2,886,898 | 576,217 |
| Mode M0 | |||
|---|---|---|---|
| Quadrant | BADHDUFLAG | Total packets | Discarded packets |
| A | 0 | 9318 | 0 |
| B | 0 | 9653 | 0 |
| C | 0 | 13514 | 0 |
| D | 0 | 11712 | 0 |
| Quadrant | Total seconds | Saturated seconds | Saturation percentage |
|---|---|---|---|
| A | 4640 | 1 | 0.021552% |
| B | 4640 | 9 | 0.193966% |
| C | 4640 | 616 | 13.275862% |
| D | 4641 | 61 | 1.314372% |
Noise dominated data is calculated using 1-second bins in cleaned event files. If a bin has >2000 counts, and if more than 50% of those come from <1% of pixels, then it is considered to be noise-dominated and hence unusable.
| Quadrant | # 1 sec bins | Bins with >0 counts | Bins with >2000 counts | High rate bins dominated by noise | Noise dominated (total time) | Noise dominated (detector-on time) | Marked lightcurve |
|---|---|---|---|---|---|---|---|
| A | 4640 | 4640 | 0 | 0 | 0.00% | 0.00% | 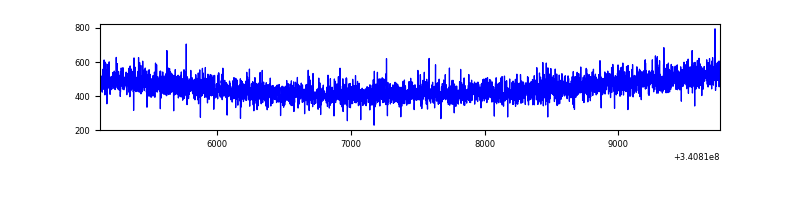 |
| B | 4640 | 4640 | 0 | 0 | 0.00% | 0.00% | 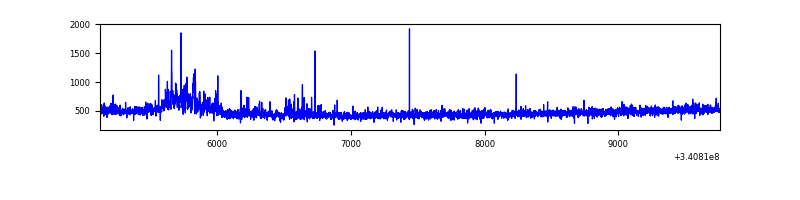 |
| C | 4640 | 4640 | 490 | 490 | 10.56% | 10.56% | 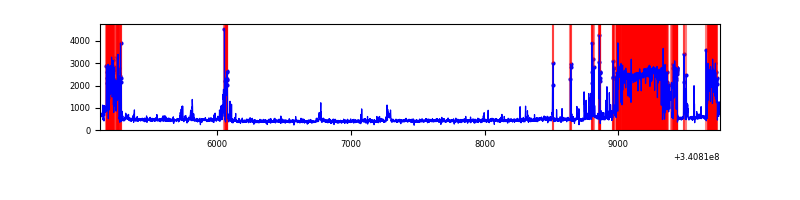 |
| D | 4641 | 4641 | 40 | 40 | 0.86% | 0.86% | 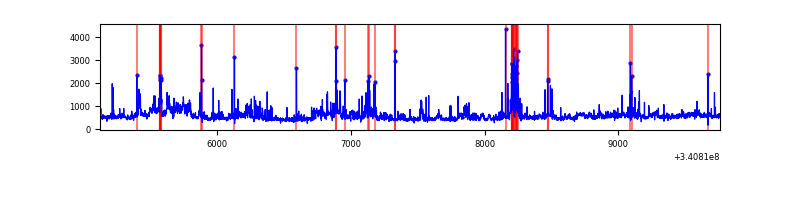 |
Top three noisy pixels from each quadrant. If the there are fewer than three noisy pixels in the level2.evt file, extra rows are filled as -1
| Pixel properties | Quadrant properties | ||||||
|---|---|---|---|---|---|---|---|
| Quadrant | DetID | PixID | Counts | Sigma | Mean | Median | Sigma |
| A | 13 | 254 | 7861 | 67.65 | 537 | 527 | 108.4 |
| A | 3 | 137 | 4906 | 40.39 | 537 | 527 | 108.4 |
| A | 0 | 226 | 4743 | 38.89 | 537 | 527 | 108.4 |
| B | 15 | 32 | 51149 | 501.83 | 537 | 525 | 100.9 |
| B | 10 | 245 | 50625 | 496.63 | 537 | 525 | 100.9 |
| B | 4 | 52 | 15122 | 144.7 | 537 | 525 | 100.9 |
| C | 2 | 16 | 1545949 | 14241.77 | 469 | 473 | 108.5 |
| C | 14 | 238 | 76402 | 699.7 | 469 | 473 | 108.5 |
| C | 15 | 208 | 14576 | 129.96 | 469 | 473 | 108.5 |
| D | 1 | 52 | 578940 | 4658.26 | 514 | 503 | 124.2 |
| D | 2 | 250 | 160895 | 1291.67 | 514 | 503 | 124.2 |
| D | 12 | 227 | 140272 | 1125.58 | 514 | 503 | 124.2 |
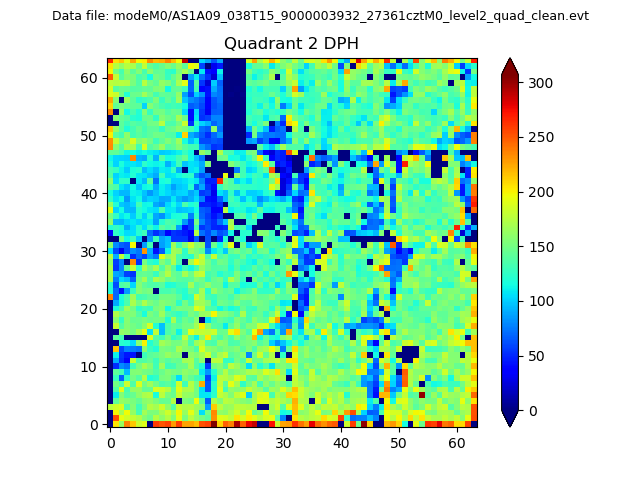
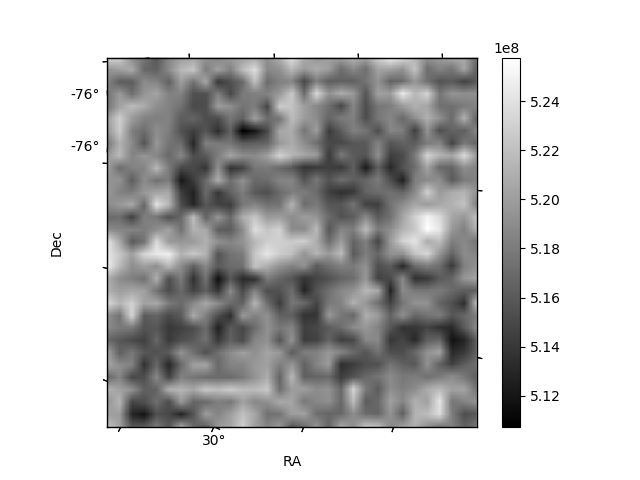
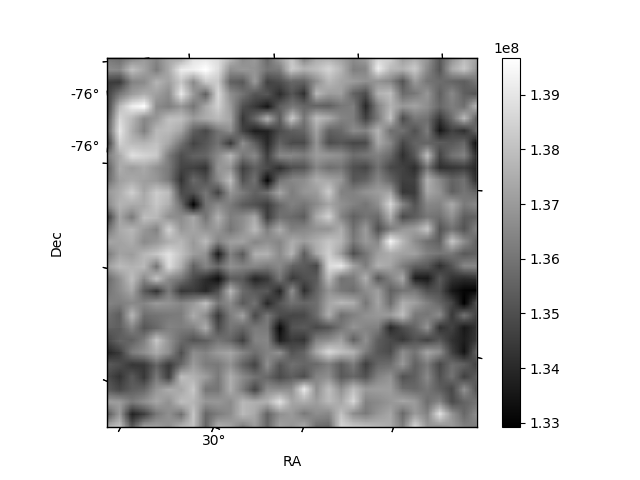
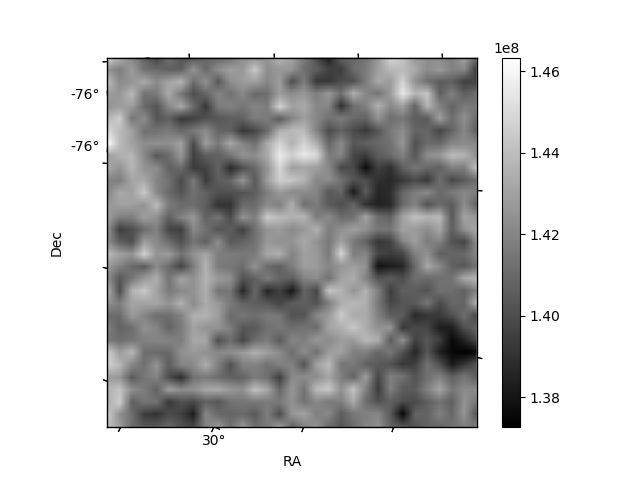
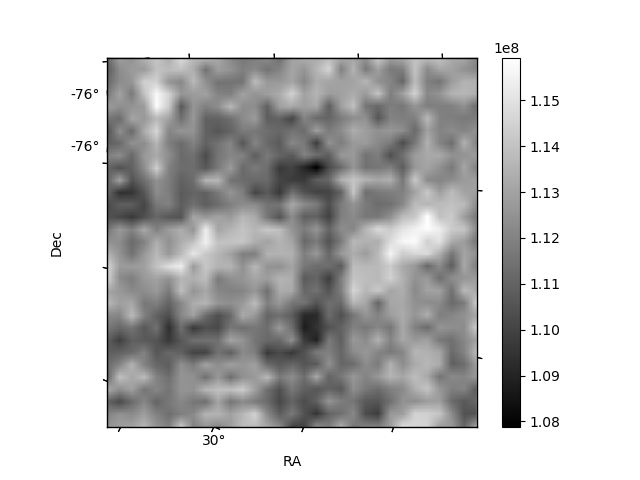
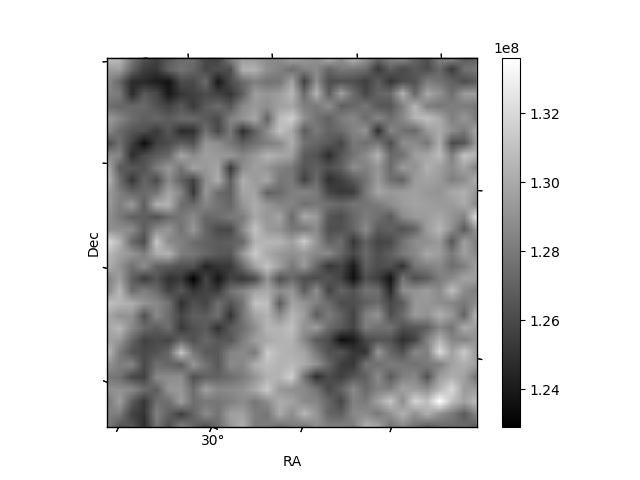
Histogram calculated using DETX and DETY for each event in the final _common_clean file
| Quadrant A | 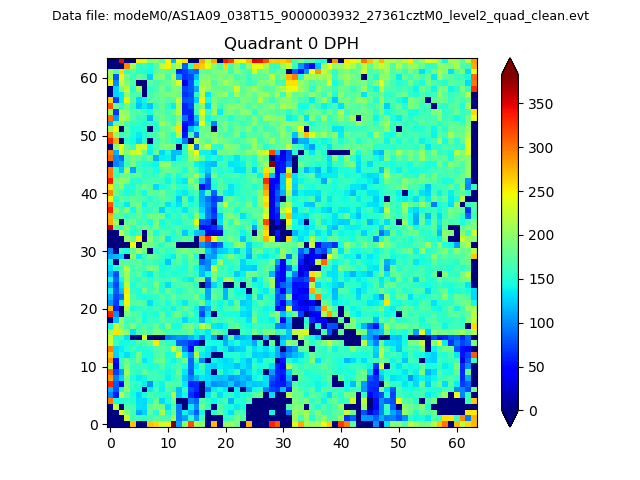 |
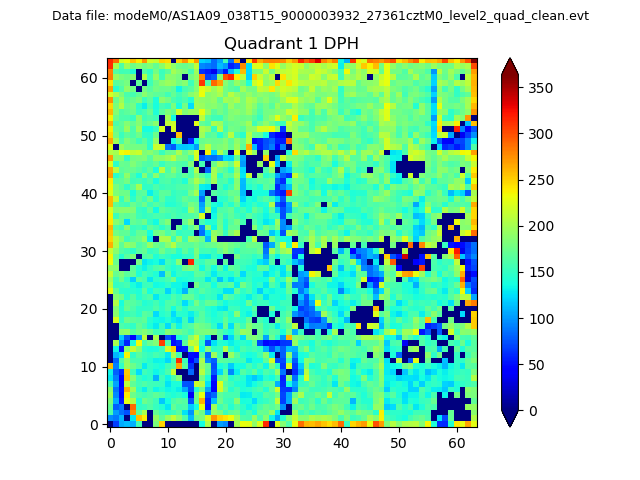 |
Quadrant B |
|---|---|---|---|
| Quadrant D | 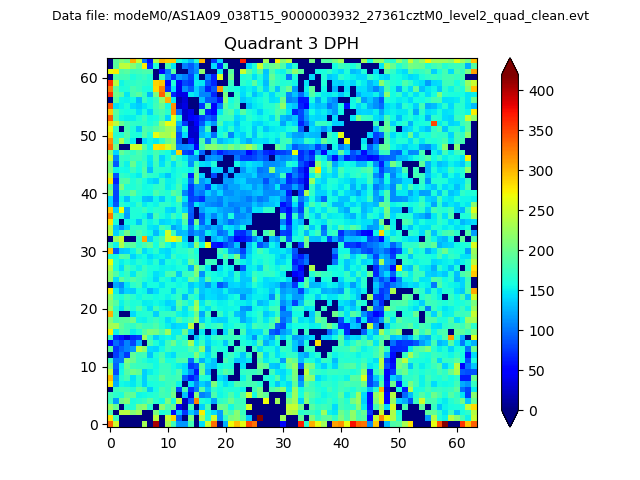 |
 |
Quadrant C |
| Plot type | Count rate plots | Images |
|---|---|---|
| Comparison with Poisson distribution Blue bars denote a histogram of data divided into 1 sec bins. Red curve is a Poisson curve with rate = median count rate of data. |
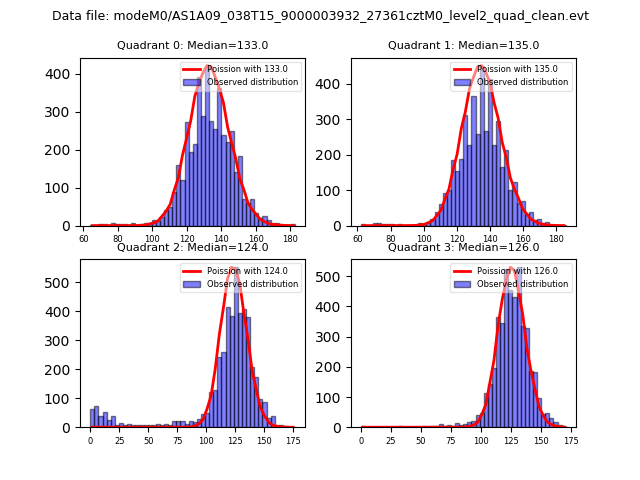 |
 |
| Quadrant-wise count rates Data is divided into 100 sec bins |
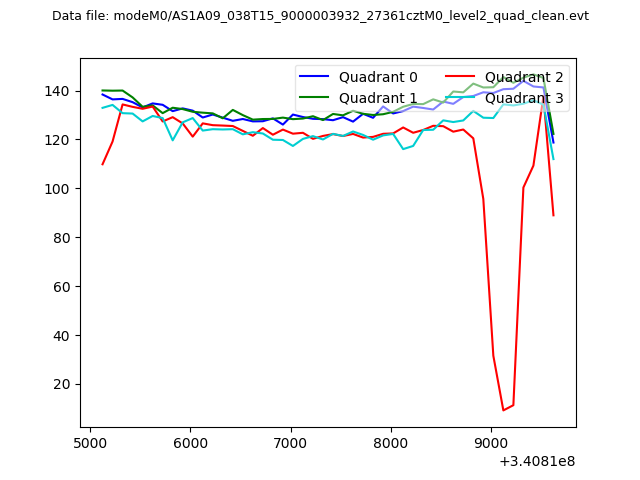 |
|
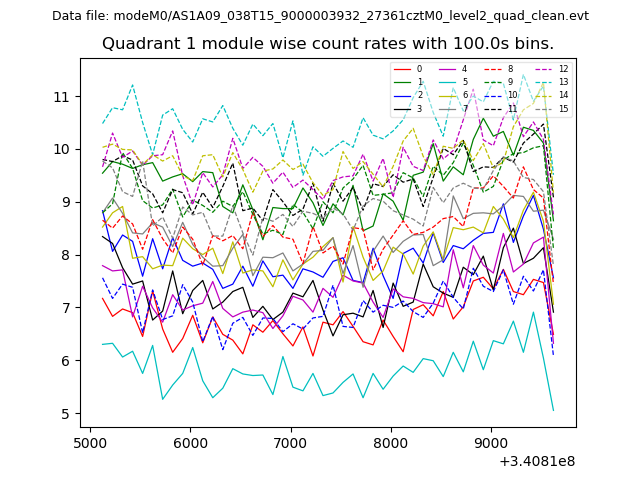
| Module-wise count rates for Quadrant A Data is divided into 100 sec bins |
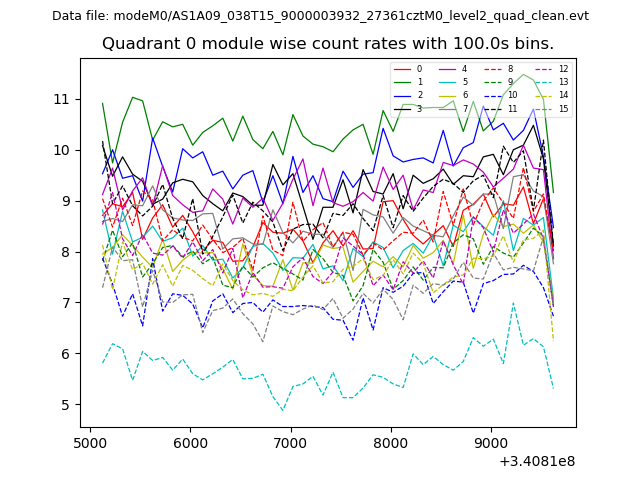 |
 |
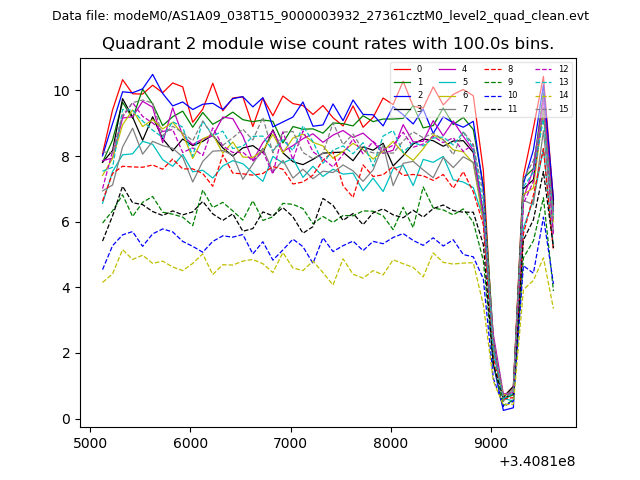
| Module-wise count rates for Quadrant B Data is divided into 100 sec bins |
 |
 |
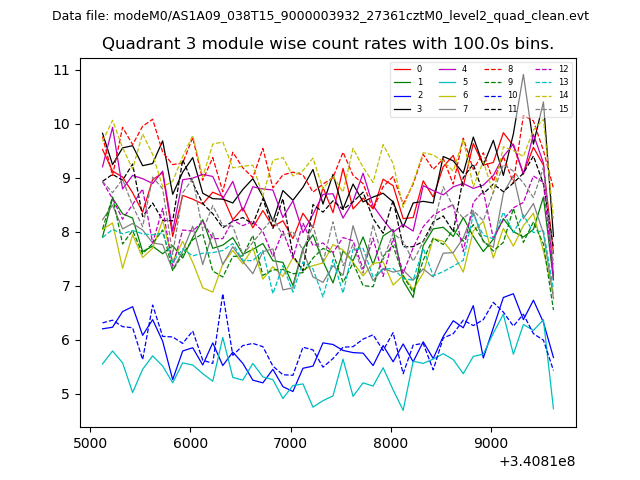
| Module-wise count rates for Quadrant C Data is divided into 100 sec bins |
 |
 |
| Module-wise count rates for Quadrant D Data is divided into 100 sec bins |
 |
 |
| Parameter | Plot |
|---|---|
| CZT HV Monitor | 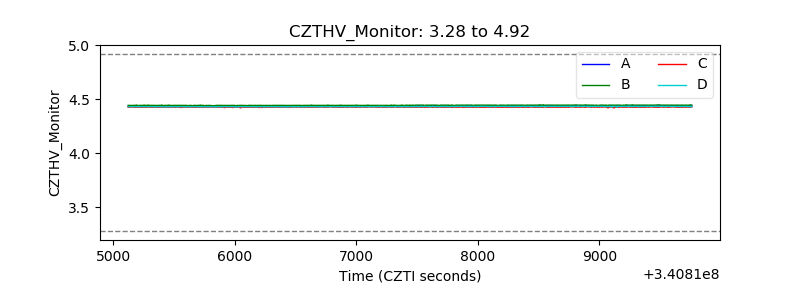 |
| D_VDD | 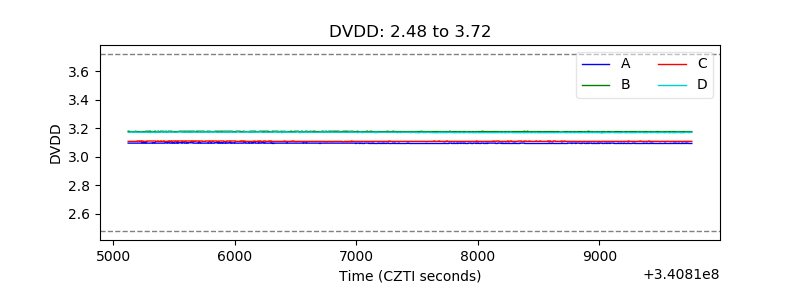 |
| Temperature 1 | 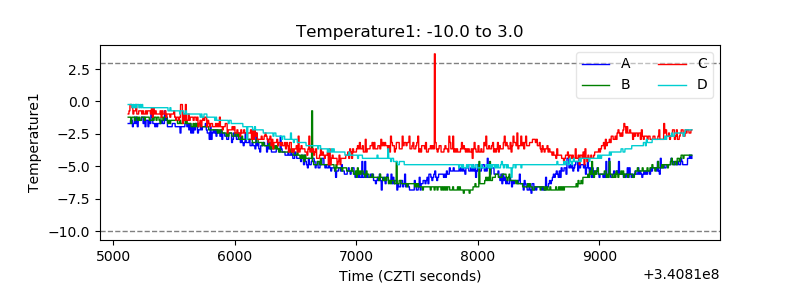 |
| Veto HV Monitor | 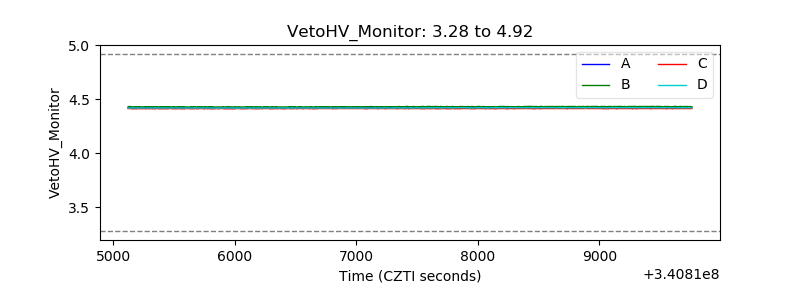 |
| Veto LLD | 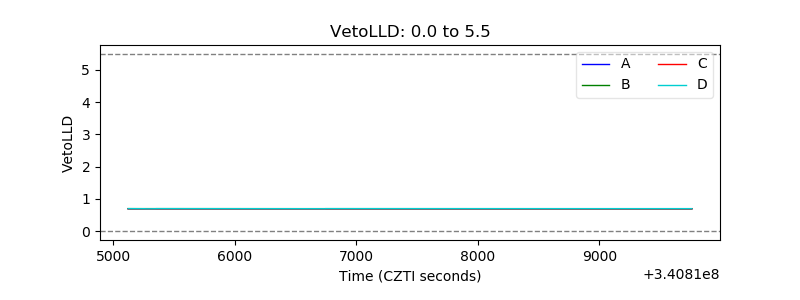 |
| Alpha Counter | 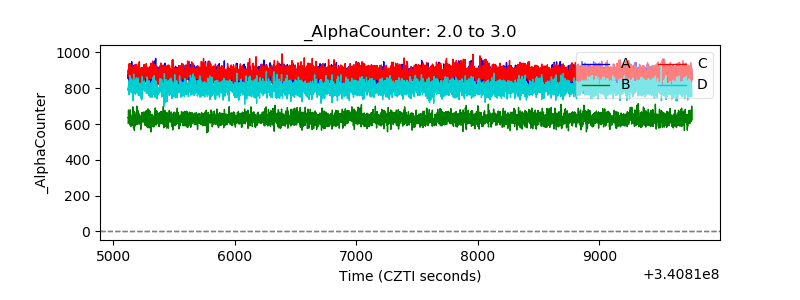 |
| _CPM_Rate | 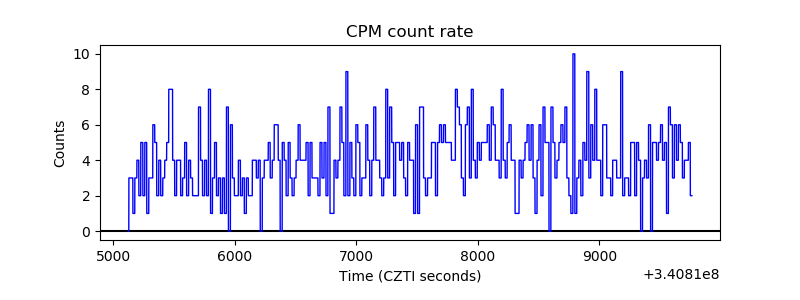 |
| CZT Counter | 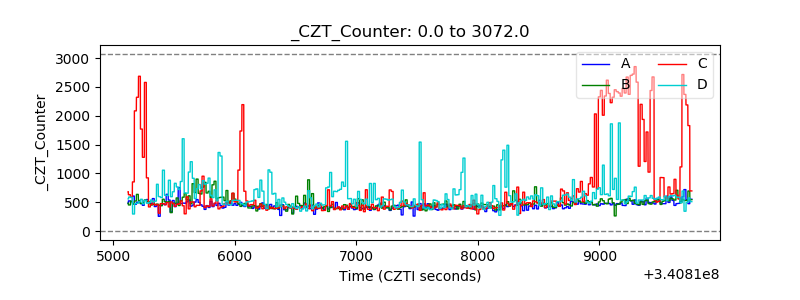 |
| +2.5 Volts monitor | 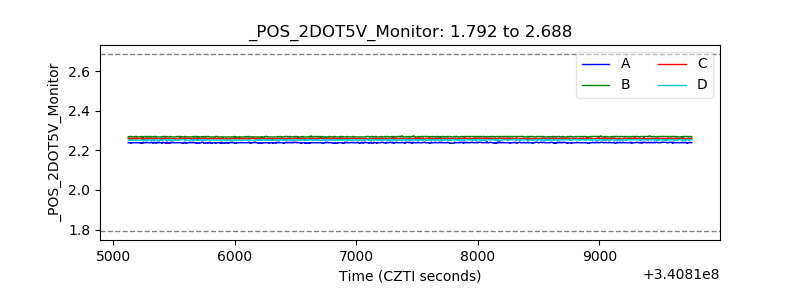 |
| +5 Volts monitor |  |
| _ROLL_ROT | 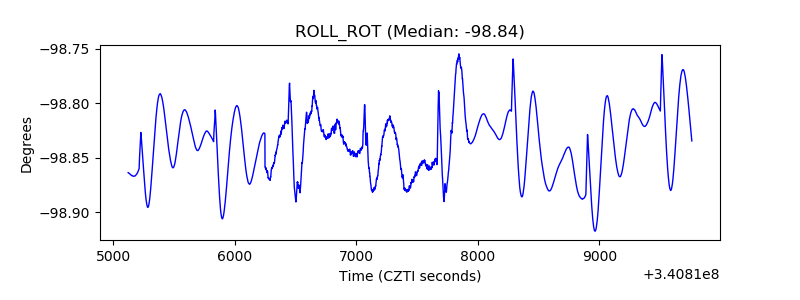 |
| _Roll_DEC | 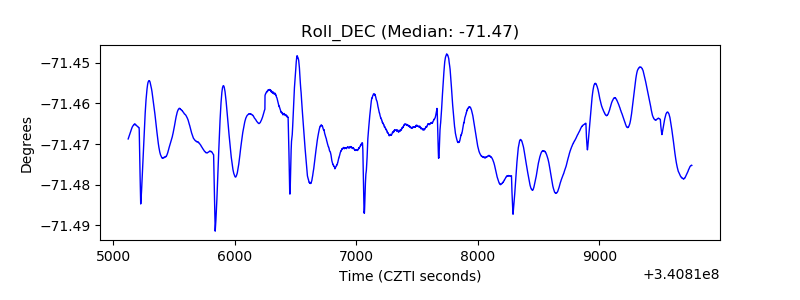 |
| _Roll_RA | 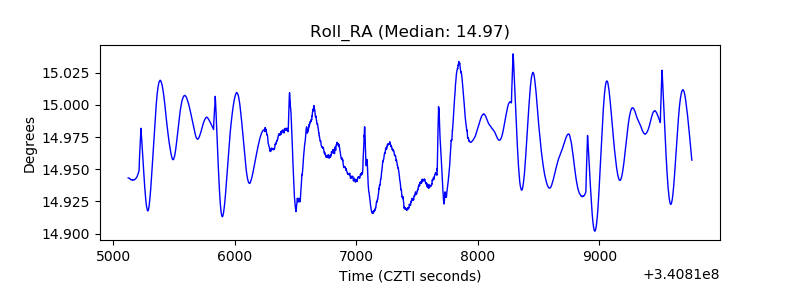 |
| Veto Counter | 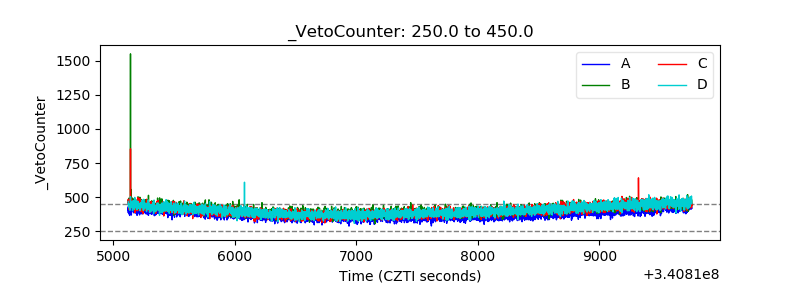 |