| Param | Original file | Final file |
|---|---|---|
| Filename | modeM0/AS1T03_249T01_9000003934cztM0_level2.fits | modeM0/AS1T03_249T01_9000003934cztM0_level2_quad_clean.evt |
| Size (bytes) | 206,856,000 | 79,433,280 |
| Size | 197.3 MB | 75.8 MB |
| Events in quadrant A | 1,321,042 | 278,633 |
| Events in quadrant B | 1,255,872 | 280,144 |
| Events in quadrant C | 1,272,388 | 264,544 |
| Events in quadrant D | 1,068,298 | 232,852 |
| Mode M0 | |||
|---|---|---|---|
| Quadrant | BADHDUFLAG | Total packets | Discarded packets |
| A | 0 | 41263 | 0 |
| B | 0 | 47514 | 0 |
| C | 0 | 41346 | 0 |
| D | 0 | 57714 | 0 |
| Mode SS | |||
|---|---|---|---|
| Quadrant | BADHDUFLAG | Total packets | Discarded packets |
| A | 0 | 398 | 0 |
| B | 0 | 398 | 0 |
| C | 0 | 398 | 0 |
| D | 0 | 398 | 0 |
| Mode M9 | |||
|---|---|---|---|
| Quadrant | BADHDUFLAG | Total packets | Discarded packets |
| A | 0 | 41 | 0 |
| B | 0 | 42 | 0 |
| C | 0 | 42 | 0 |
| D | 0 | 42 | 0 |
| Quadrant | Total seconds | Saturated seconds | Saturation percentage |
|---|---|---|---|
| A | 19549 | 140 | 0.716149% |
| B | 19549 | 629 | 3.217556% |
| C | 19549 | 250 | 1.278838% |
| D | 19549 | 1504 | 7.693488% |
Noise dominated data is calculated using 1-second bins in cleaned event files. If a bin has >2000 counts, and if more than 50% of those come from <1% of pixels, then it is considered to be noise-dominated and hence unusable.
| Quadrant | # 1 sec bins | Bins with >0 counts | Bins with >2000 counts | High rate bins dominated by noise | Noise dominated (total time) | Noise dominated (detector-on time) | Marked lightcurve |
|---|---|---|---|---|---|---|---|
| A | 23313 | 19546 | 0 | 0 | 0.00% | 0.00% |  |
| B | 23313 | 19546 | 0 | 0 | 0.00% | 0.00% | 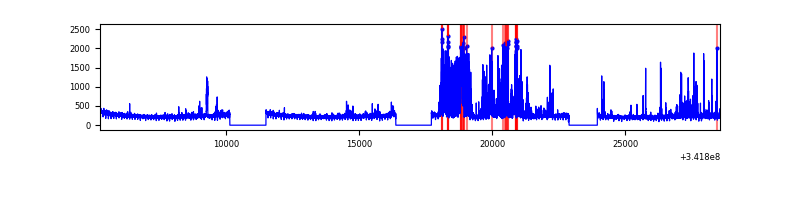 |
| C | 23312 | 19544 | 0 | 0 | 0.00% | 0.00% |  |
| D | 23312 | 19440 | 0 | 0 | 0.00% | 0.00% |  |
Top three noisy pixels from each quadrant. If the there are fewer than three noisy pixels in the level2.evt file, extra rows are filled as -1
| Pixel properties | Quadrant properties | ||||||
|---|---|---|---|---|---|---|---|
| Quadrant | DetID | PixID | Counts | Sigma | Mean | Median | Sigma |
| A | 0 | 29 | 1075 | 8.88 | 343 | 324 | 84.6 |
| A | 7 | 110 | 1013 | 8.14 | 343 | 324 | 84.6 |
| A | 9 | 19 | 941 | 7.29 | 343 | 324 | 84.6 |
| B | 2 | 9 | 989 | 9.93 | 332 | 318 | 67.5 |
| B | 5 | 128 | 849 | 7.86 | 332 | 318 | 67.5 |
| B | 5 | 255 | 841 | 7.74 | 332 | 318 | 67.5 |
| C | 1 | 80 | 936 | 7.08 | 336 | 315 | 87.7 |
| C | 1 | 81 | 915 | 6.84 | 336 | 315 | 87.7 |
| C | 3 | 234 | 910 | 6.79 | 336 | 315 | 87.7 |
| D | 3 | 14 | 784 | 6.16 | 304 | 279 | 82.0 |
| D | 7 | 3 | 781 | 6.12 | 304 | 279 | 82.0 |
| D | 15 | 46 | 778 | 6.08 | 304 | 279 | 82.0 |
Histogram calculated using DETX and DETY for each event in the final _common_clean file
| Quadrant A | 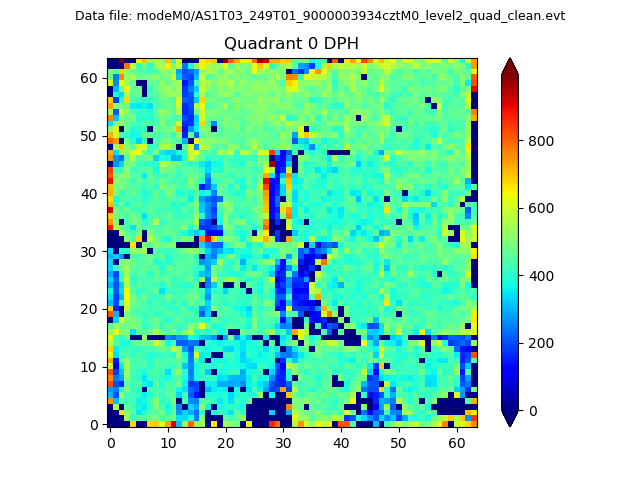 |
 |
Quadrant B |
|---|---|---|---|
| Quadrant D | 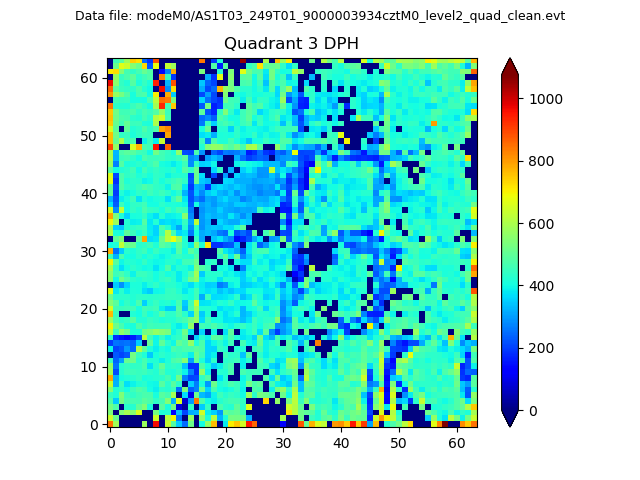 |
 |
Quadrant C |
| Plot type | Count rate plots | Images |
|---|---|---|
| Comparison with Poisson distribution Blue bars denote a histogram of data divided into 1 sec bins. Red curve is a Poisson curve with rate = median count rate of data. |
 |
 |
| Quadrant-wise count rates Data is divided into 100 sec bins |
 |
|
| Module-wise count rates for Quadrant A Data is divided into 100 sec bins |
 |
 |
| Module-wise count rates for Quadrant B Data is divided into 100 sec bins |
 |
 |
| Module-wise count rates for Quadrant C Data is divided into 100 sec bins |
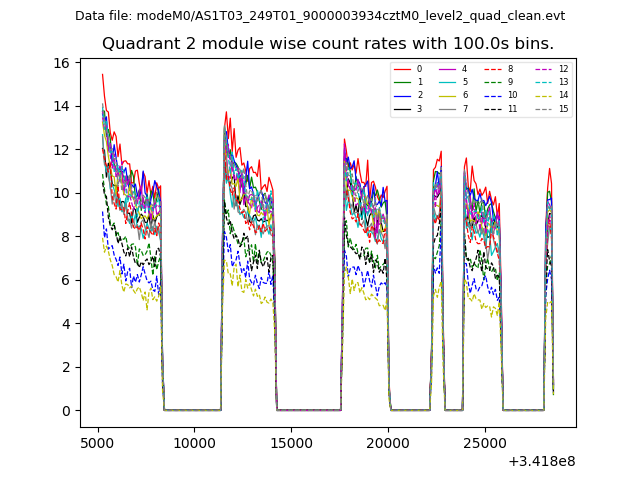 |
 |
| Module-wise count rates for Quadrant D Data is divided into 100 sec bins |
 |
 |
| Parameter | Plot |
|---|---|
| CZT HV Monitor |  |
| D_VDD | 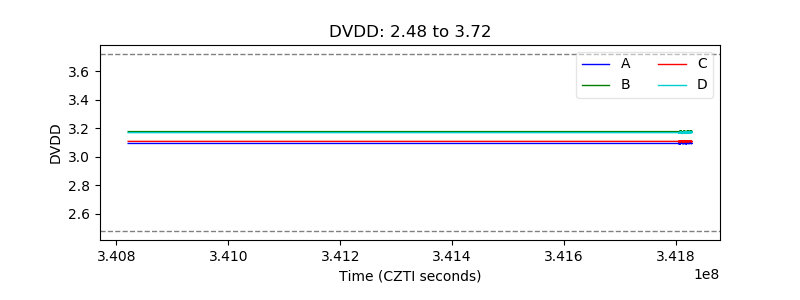 |
| Temperature 1 |  |
| Veto HV Monitor |  |
| Veto LLD |  |
| Alpha Counter |  |
| _CPM_Rate |  |
| CZT Counter |  |
| +2.5 Volts monitor |  |
| +5 Volts monitor |  |
| _ROLL_ROT |  |
| _Roll_DEC |  |
| _Roll_RA | 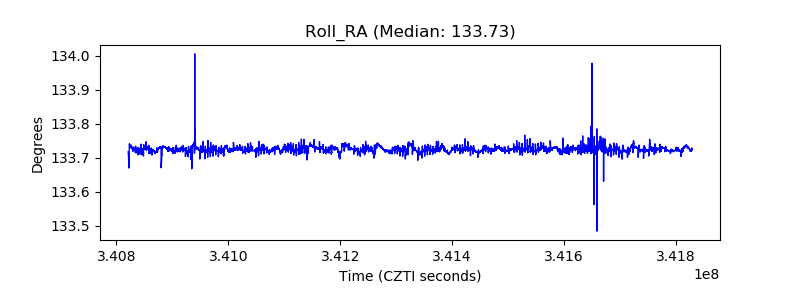 |
| Veto Counter |  |