| Param | Original file | Final file |
|---|---|---|
| Filename | modeM0/AS1T03_249T01_9000003934_27362cztM0_level2.evt | modeM0/AS1T03_249T01_9000003934_27362cztM0_level2_quad_clean.evt |
| Size (bytes) | 592,416,000 | 78,266,880 |
| Size | 565.0 MB | 74.6 MB |
| Events in quadrant A | 3,627,648 | 480,012 |
| Events in quadrant B | 4,035,415 | 478,891 |
| Events in quadrant C | 4,826,203 | 439,403 |
| Events in quadrant D | 4,953,903 | 459,941 |
| Mode M0 | |||
|---|---|---|---|
| Quadrant | BADHDUFLAG | Total packets | Discarded packets |
| A | 0 | 15277 | 0 |
| B | 0 | 16514 | 0 |
| C | 0 | 18990 | 0 |
| D | 0 | 19582 | 0 |
| Mode M9 | |||
|---|---|---|---|
| Quadrant | BADHDUFLAG | Total packets | Discarded packets |
| A | 0 | 2 | 0 |
| B | 0 | 2 | 0 |
| C | 0 | 2 | 0 |
| D | 0 | 2 | 0 |
| Quadrant | Total seconds | Saturated seconds | Saturation percentage |
|---|---|---|---|
| A | 7345 | 100 | 1.361470% |
| B | 7345 | 250 | 3.403676% |
| C | 7345 | 514 | 6.997958% |
| D | 7344 | 258 | 3.513072% |
Noise dominated data is calculated using 1-second bins in cleaned event files. If a bin has >2000 counts, and if more than 50% of those come from <1% of pixels, then it is considered to be noise-dominated and hence unusable.
| Quadrant | # 1 sec bins | Bins with >0 counts | Bins with >2000 counts | High rate bins dominated by noise | Noise dominated (total time) | Noise dominated (detector-on time) | Marked lightcurve |
|---|---|---|---|---|---|---|---|
| A | 7615 | 7346 | 3 | 3 | 0.04% | 0.04% | 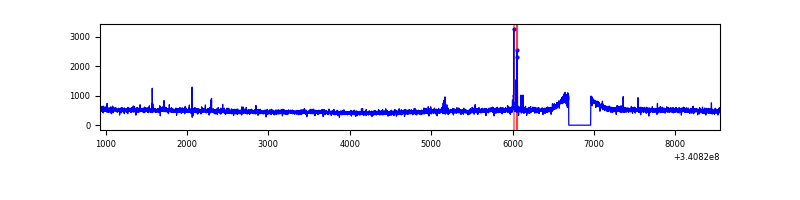 |
| B | 7615 | 7346 | 79 | 79 | 1.04% | 1.08% | 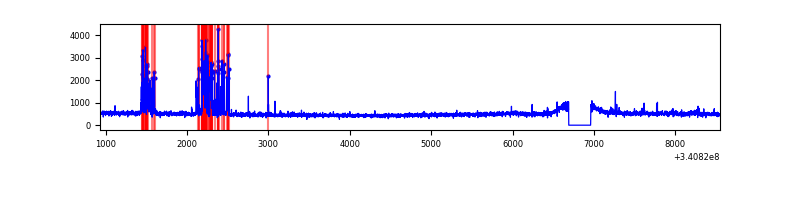 |
| C | 7615 | 7345 | 268 | 268 | 3.52% | 3.65% | 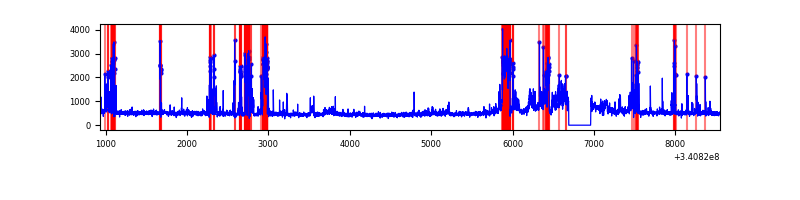 |
| D | 7614 | 7345 | 118 | 118 | 1.55% | 1.61% | 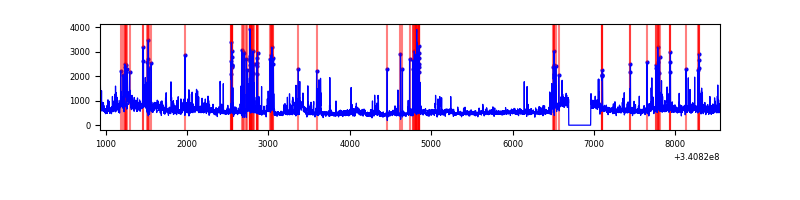 |
Top three noisy pixels from each quadrant. If the there are fewer than three noisy pixels in the level2.evt file, extra rows are filled as -1
| Pixel properties | Quadrant properties | ||||||
|---|---|---|---|---|---|---|---|
| Quadrant | DetID | PixID | Counts | Sigma | Mean | Median | Sigma |
| A | 12 | 96 | 23482 | 120.17 | 930 | 911 | 187.8 |
| A | 13 | 254 | 12153 | 59.85 | 930 | 911 | 187.8 |
| A | 3 | 137 | 8686 | 41.39 | 930 | 911 | 187.8 |
| B | 5 | 172 | 411969 | 2355.09 | 911 | 889 | 174.5 |
| B | 12 | 111 | 21278 | 116.81 | 911 | 889 | 174.5 |
| B | 11 | 111 | 18957 | 103.51 | 911 | 889 | 174.5 |
| C | 2 | 16 | 1326066 | 6581.38 | 858 | 864 | 201.4 |
| C | 14 | 238 | 135302 | 667.66 | 858 | 864 | 201.4 |
| C | 15 | 208 | 11608 | 53.36 | 858 | 864 | 201.4 |
| D | 1 | 52 | 979310 | 4307.1 | 892 | 873 | 227.2 |
| D | 2 | 250 | 391158 | 1718.04 | 892 | 873 | 227.2 |
| D | 10 | 103 | 54359 | 235.45 | 892 | 873 | 227.2 |
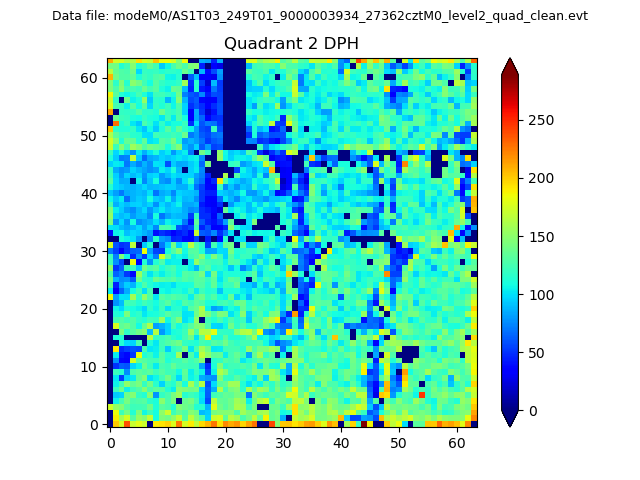
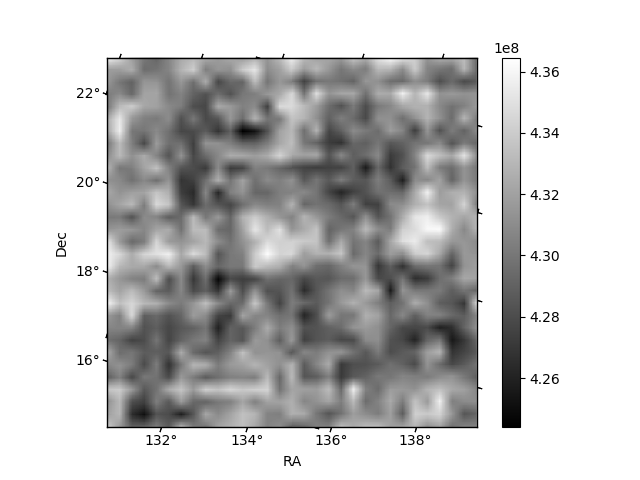
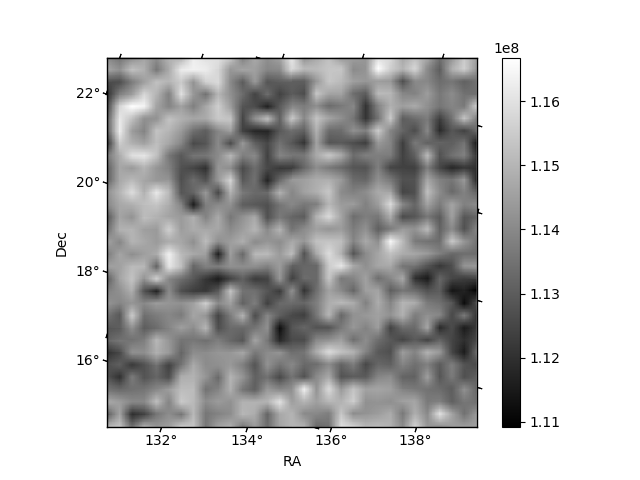
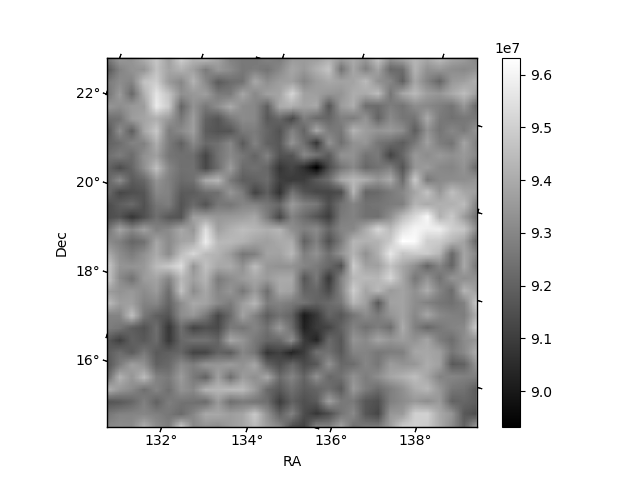
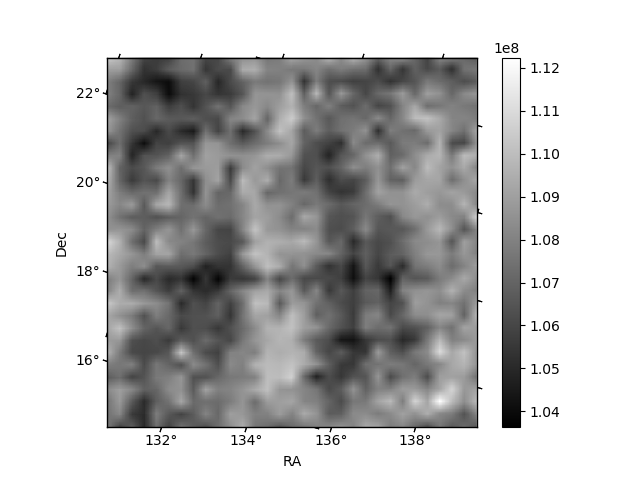
Histogram calculated using DETX and DETY for each event in the final _common_clean file
| Quadrant A | 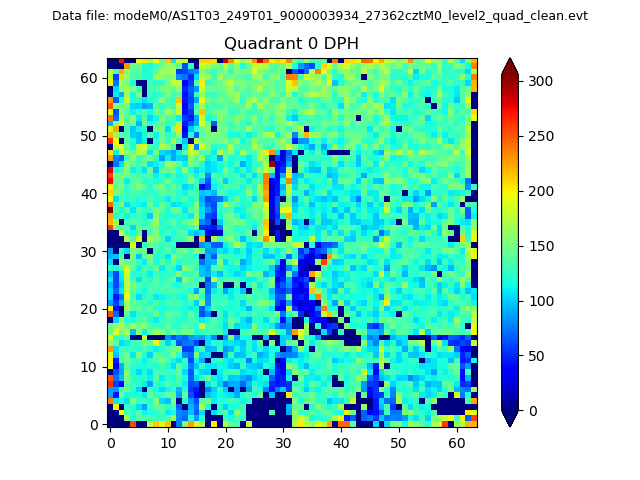 |
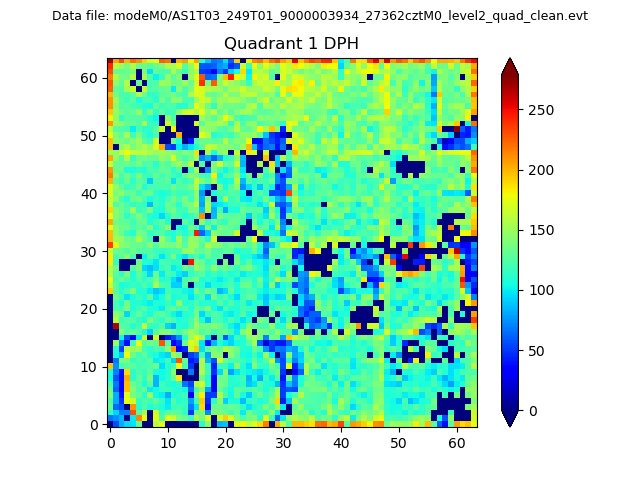 |
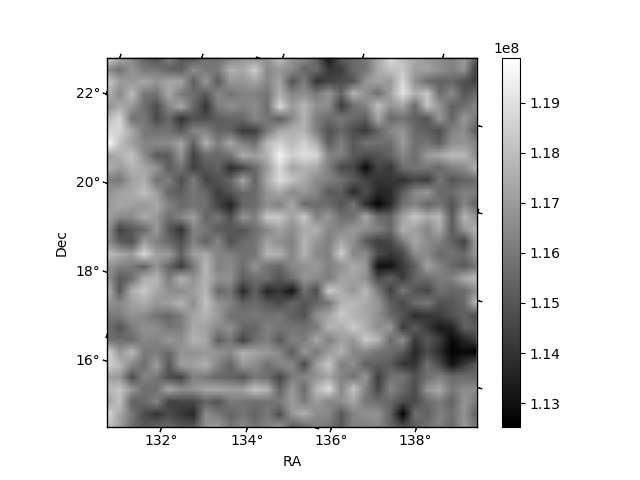
Quadrant B |
|---|---|---|---|
| Quadrant D | 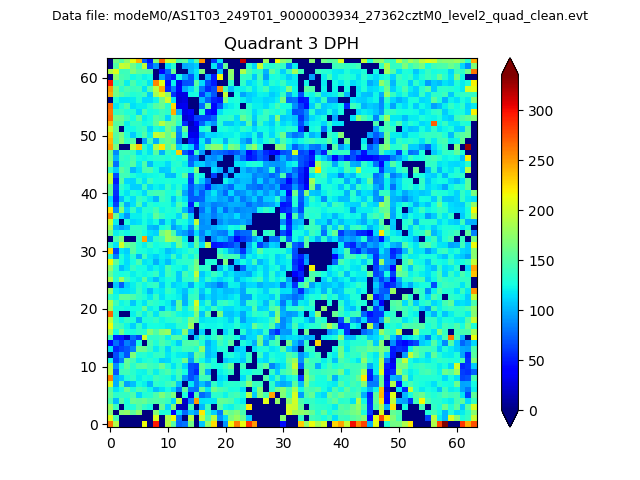 |
 |
Quadrant C |
| Plot type | Count rate plots | Images |
|---|---|---|
| Comparison with Poisson distribution Blue bars denote a histogram of data divided into 1 sec bins. Red curve is a Poisson curve with rate = median count rate of data. |
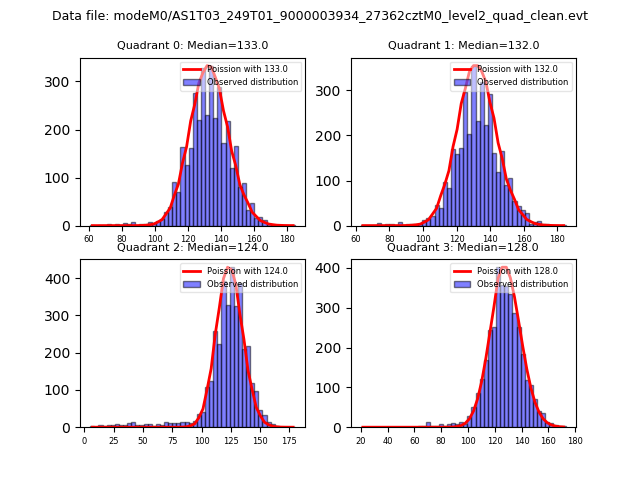 |
 |
| Quadrant-wise count rates Data is divided into 100 sec bins |
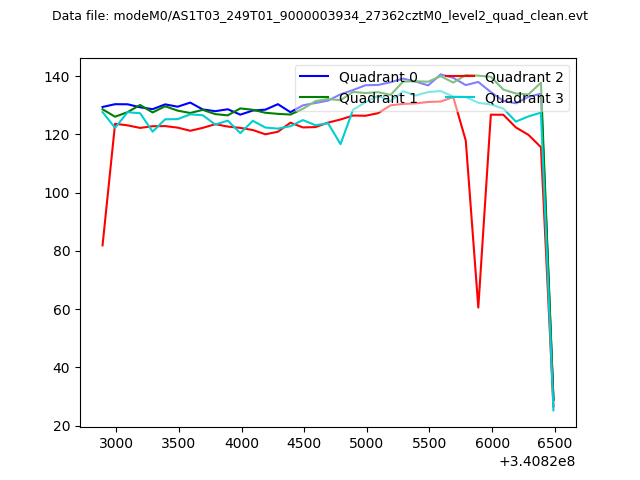 |
|
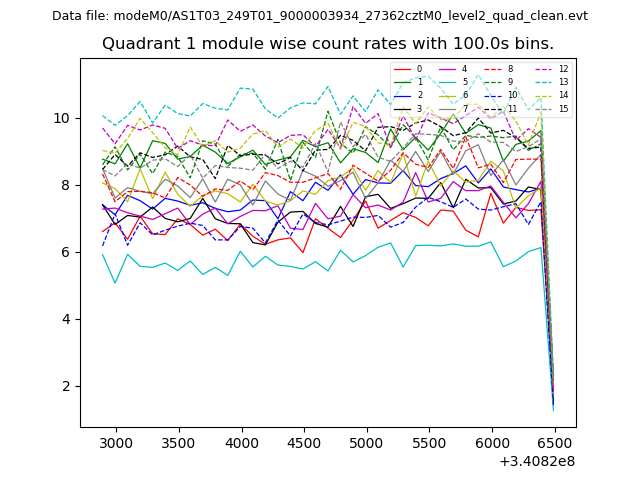
| Module-wise count rates for Quadrant A Data is divided into 100 sec bins |
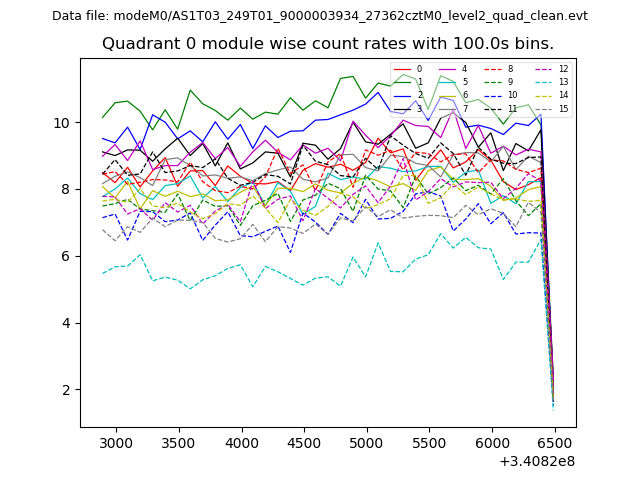 |
 |
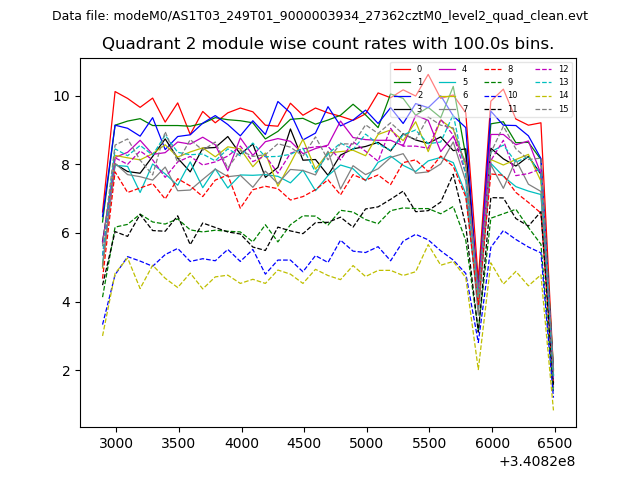
| Module-wise count rates for Quadrant B Data is divided into 100 sec bins |
 |
 |
| Module-wise count rates for Quadrant C Data is divided into 100 sec bins |
 |
 |
| Module-wise count rates for Quadrant D Data is divided into 100 sec bins |
 |
 |
| Parameter | Plot |
|---|---|
| CZT HV Monitor | 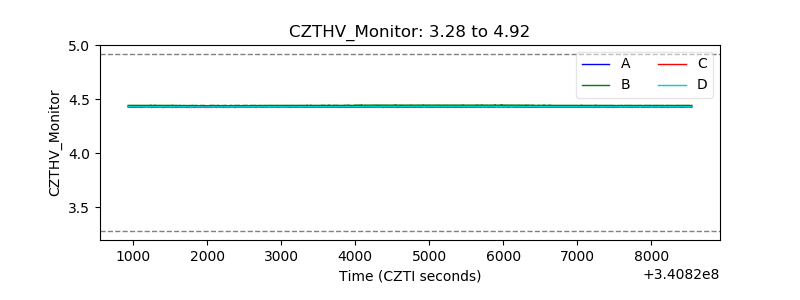 |
| D_VDD | 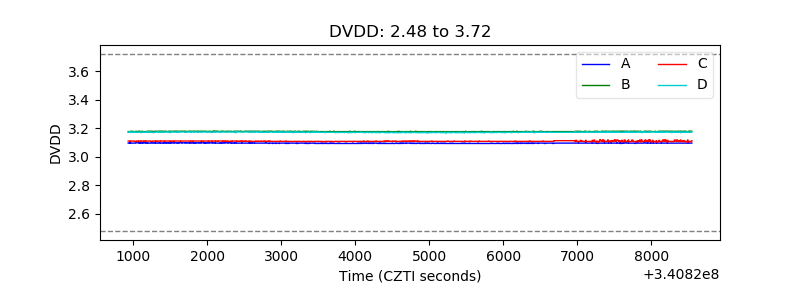 |
| Temperature 1 | 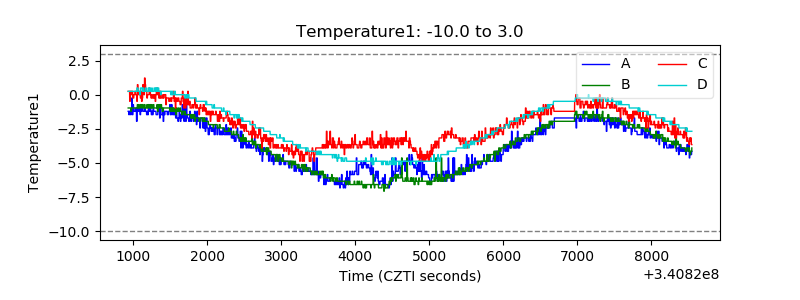 |
| Veto HV Monitor |  |
| Veto LLD | 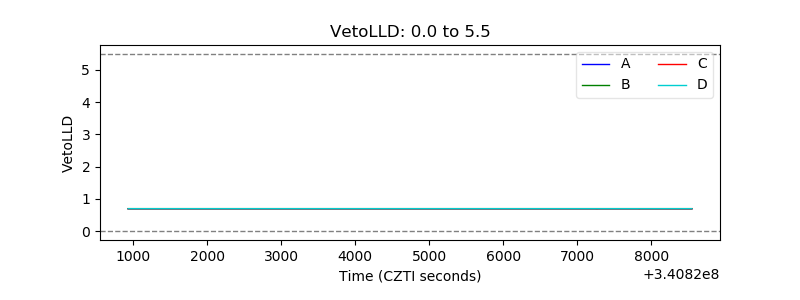 |
| Alpha Counter | 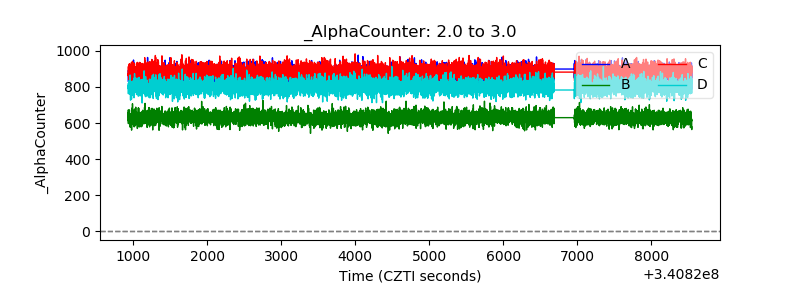 |
| _CPM_Rate | 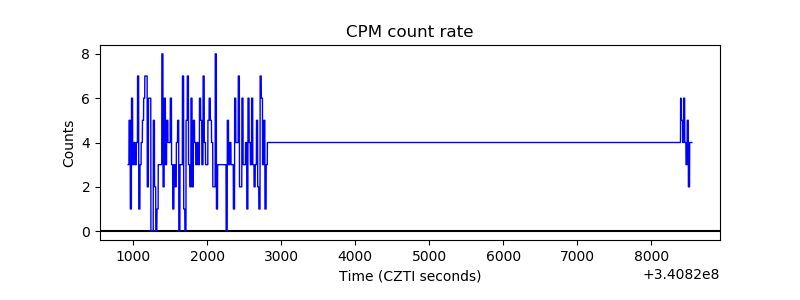 |
| CZT Counter | 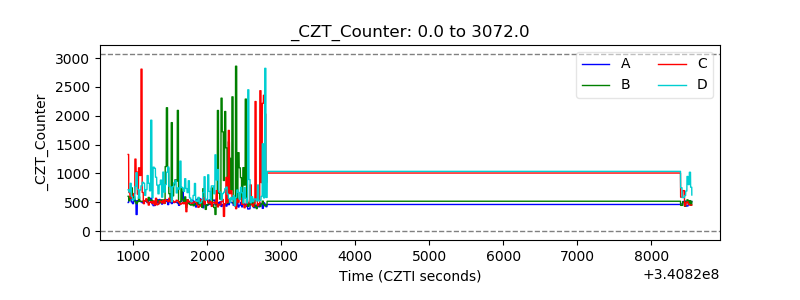 |
| +2.5 Volts monitor |  |
| +5 Volts monitor |  |
| _ROLL_ROT | 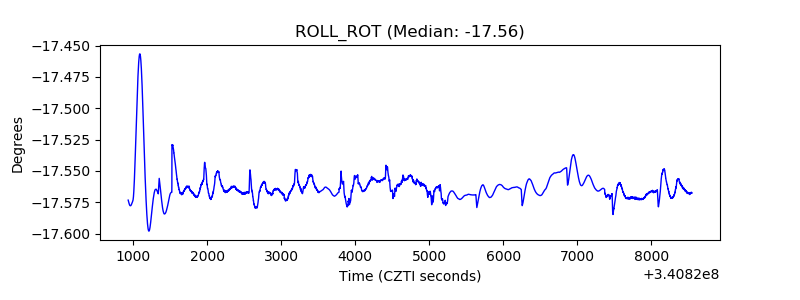 |
| _Roll_DEC | 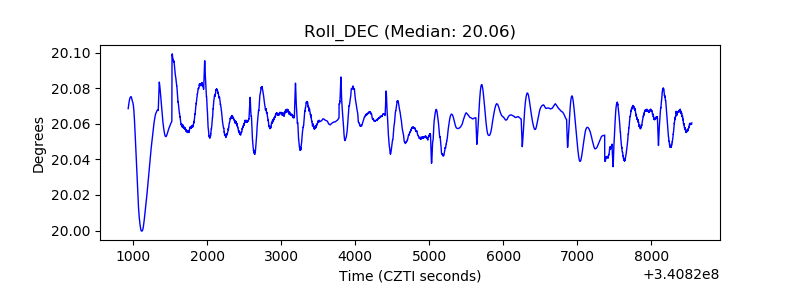 |
| _Roll_RA | 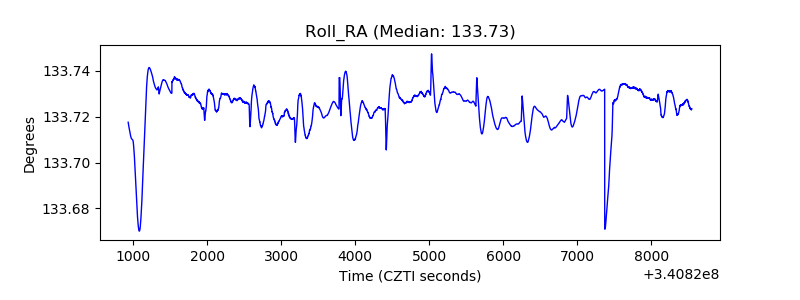 |
| Veto Counter | 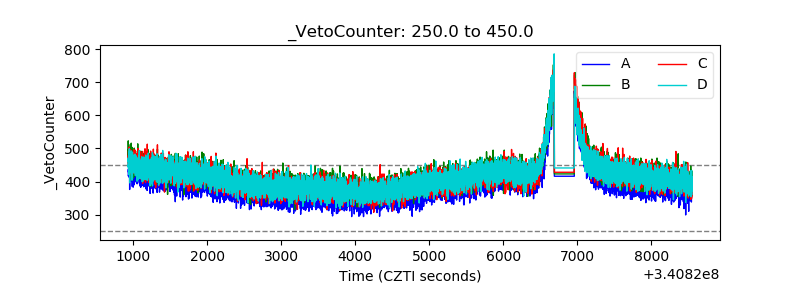 |