| Param | Original file | Final file |
|---|---|---|
| Filename | modeM0/AS1T03_249T01_9000003934_27367cztM0_level2.evt | modeM0/AS1T03_249T01_9000003934_27367cztM0_level2_quad_clean.evt |
| Size (bytes) | 1,949,195,520 | 315,622,080 |
| Size | 1.8 GB | 301.0 MB |
| Events in quadrant A | 11,378,050 | 2,070,745 |
| Events in quadrant B | 11,456,651 | 2,075,184 |
| Events in quadrant C | 20,079,592 | 1,795,093 |
| Events in quadrant D | 14,514,283 | 1,982,599 |
| Mode M0 | |||
|---|---|---|---|
| Quadrant | BADHDUFLAG | Total packets | Discarded packets |
| A | 0 | 49213 | 0 |
| B | 0 | 49422 | 0 |
| C | 0 | 75242 | 0 |
| D | 0 | 59792 | 0 |
| Mode M9 | |||
|---|---|---|---|
| Quadrant | BADHDUFLAG | Total packets | Discarded packets |
| A | 0 | 30 | 0 |
| B | 0 | 30 | 0 |
| C | 0 | 30 | 0 |
| D | 0 | 30 | 0 |
| Quadrant | Total seconds | Saturated seconds | Saturation percentage |
|---|---|---|---|
| A | 23770 | 131 | 0.551115% |
| B | 23770 | 163 | 0.685738% |
| C | 23770 | 3232 | 13.596971% |
| D | 23770 | 437 | 1.838452% |
Noise dominated data is calculated using 1-second bins in cleaned event files. If a bin has >2000 counts, and if more than 50% of those come from <1% of pixels, then it is considered to be noise-dominated and hence unusable.
| Quadrant | # 1 sec bins | Bins with >0 counts | Bins with >2000 counts | High rate bins dominated by noise | Noise dominated (total time) | Noise dominated (detector-on time) | Marked lightcurve |
|---|---|---|---|---|---|---|---|
| A | 26771 | 23775 | 7 | 7 | 0.03% | 0.03% | 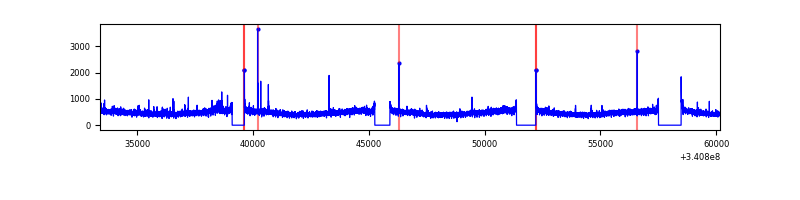 |
| B | 26771 | 23775 | 6 | 6 | 0.02% | 0.03% | 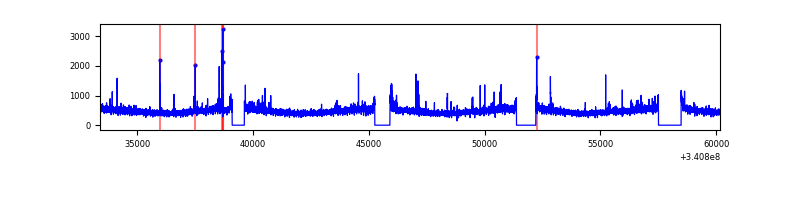 |
| C | 26771 | 23774 | 2409 | 2409 | 9.00% | 10.13% | 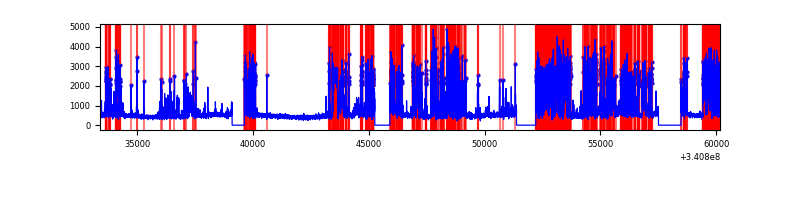 |
| D | 26771 | 23775 | 291 | 291 | 1.09% | 1.22% | 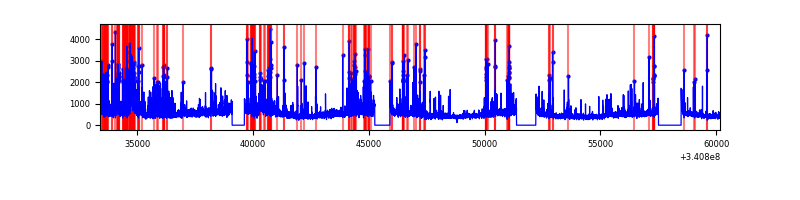 |
Top three noisy pixels from each quadrant. If the there are fewer than three noisy pixels in the level2.evt file, extra rows are filled as -1
| Pixel properties | Quadrant properties | ||||||
|---|---|---|---|---|---|---|---|
| Quadrant | DetID | PixID | Counts | Sigma | Mean | Median | Sigma |
| A | 12 | 189 | 70245 | 117.13 | 2891 | 2837 | 575.5 |
| A | 12 | 96 | 60637 | 100.44 | 2891 | 2837 | 575.5 |
| A | 14 | 235 | 42597 | 69.09 | 2891 | 2837 | 575.5 |
| B | 15 | 32 | 82200 | 146.35 | 2865 | 2792 | 542.6 |
| B | 12 | 111 | 67255 | 118.81 | 2865 | 2792 | 542.6 |
| B | 11 | 111 | 60468 | 106.3 | 2865 | 2792 | 542.6 |
| C | 2 | 16 | 9565486 | 15949.81 | 2578 | 2599 | 599.6 |
| C | 14 | 238 | 406586 | 673.8 | 2578 | 2599 | 599.6 |
| C | 8 | 128 | 30766 | 46.98 | 2578 | 2599 | 599.6 |
| D | 1 | 52 | 3151976 | 4833.2 | 2770 | 2710 | 651.6 |
| D | 2 | 250 | 670787 | 1025.3 | 2770 | 2710 | 651.6 |
| D | 2 | 234 | 103430 | 154.58 | 2770 | 2710 | 651.6 |
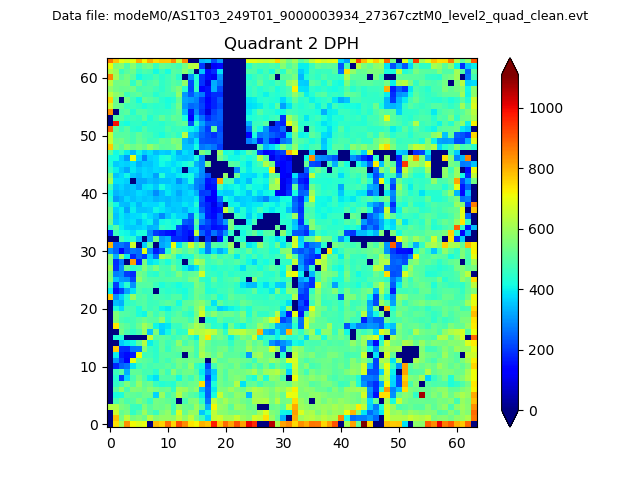
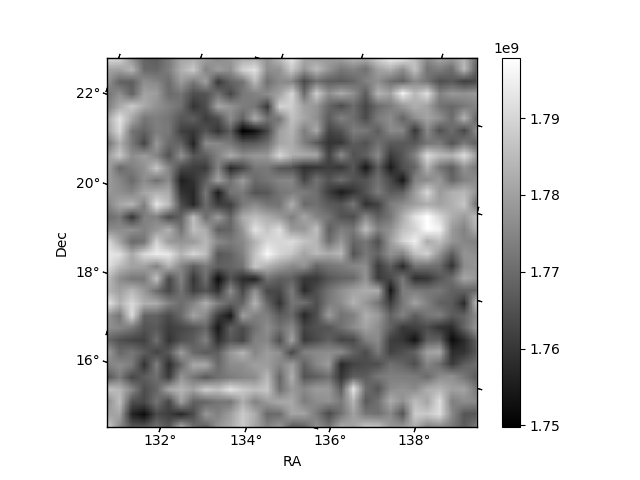
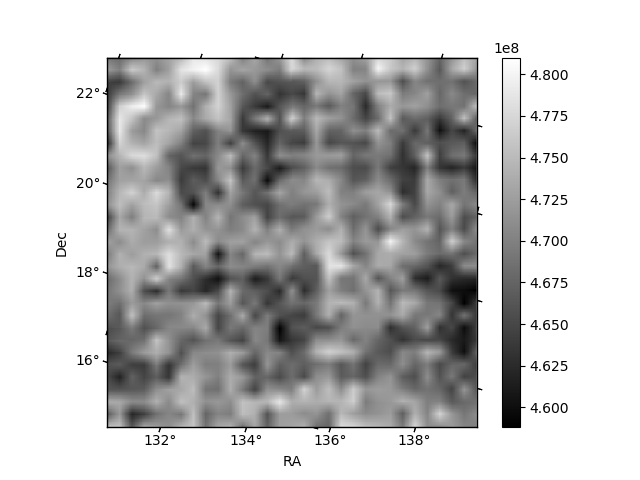
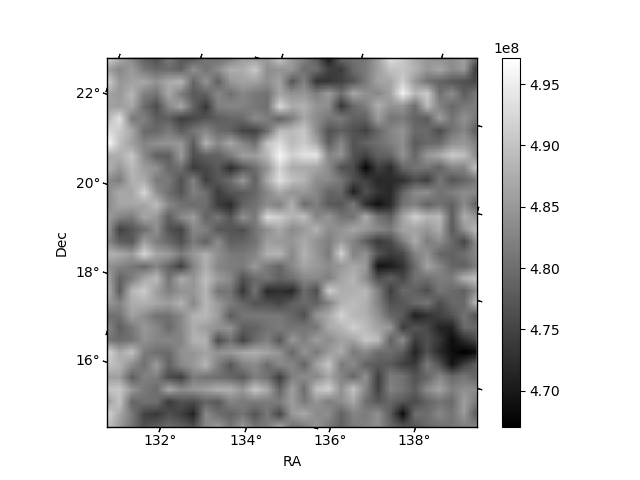
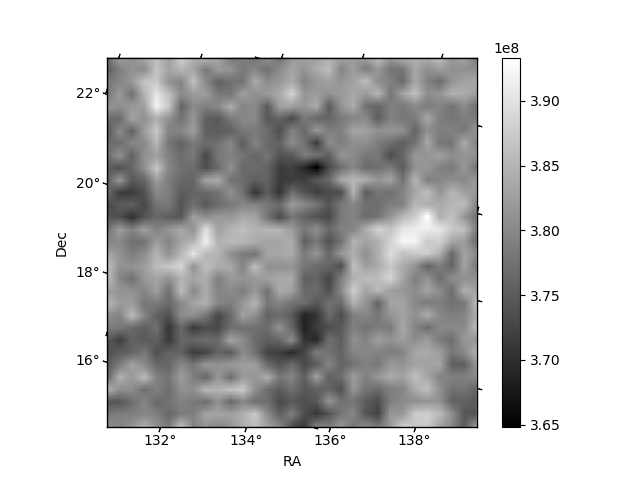
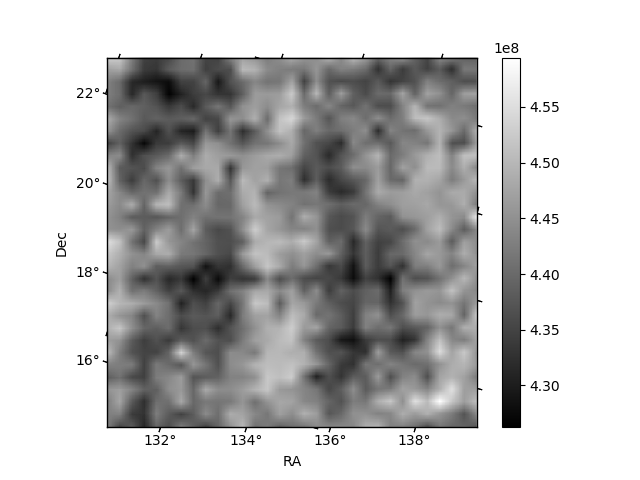
Histogram calculated using DETX and DETY for each event in the final _common_clean file
| Quadrant A | 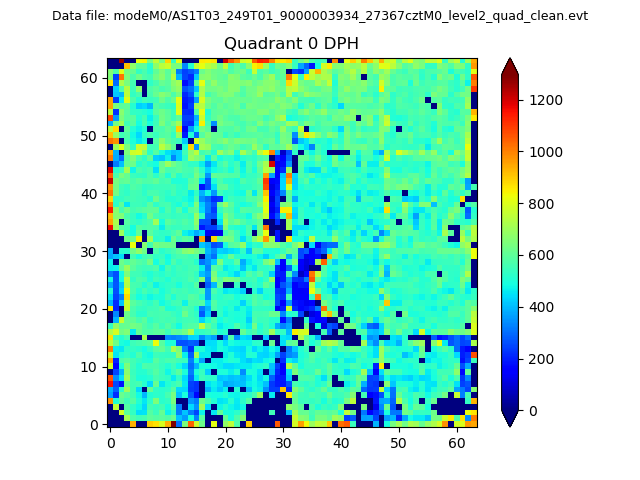 |
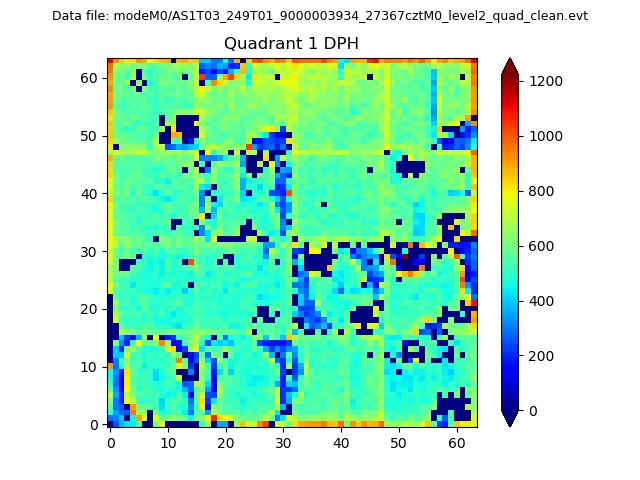 |
Quadrant B |
|---|---|---|---|
| Quadrant D | 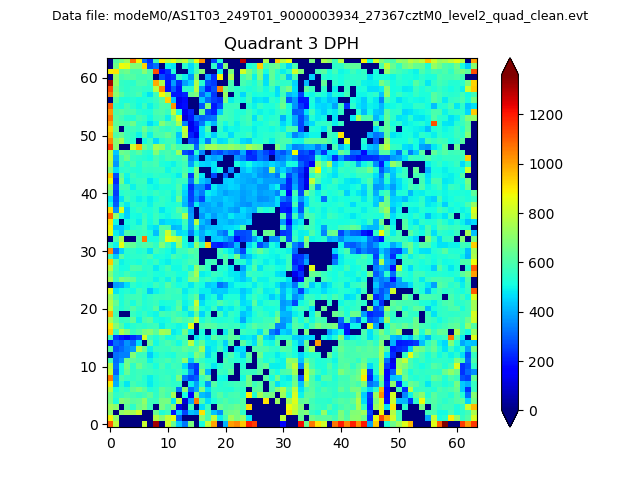 |
 |
Quadrant C |
| Plot type | Count rate plots | Images |
|---|---|---|
| Comparison with Poisson distribution Blue bars denote a histogram of data divided into 1 sec bins. Red curve is a Poisson curve with rate = median count rate of data. |
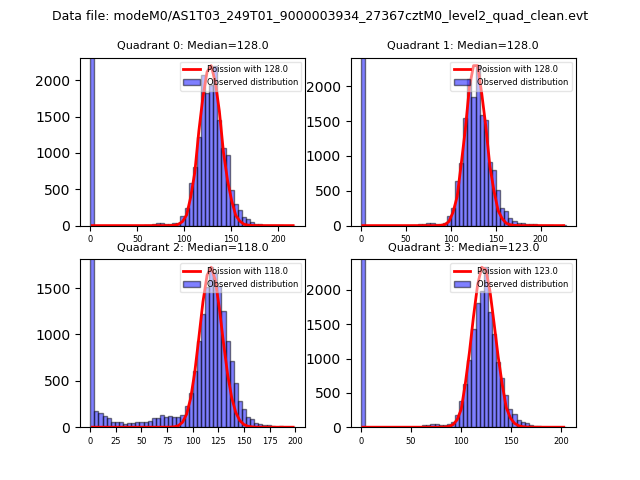 |
 |
| Quadrant-wise count rates Data is divided into 100 sec bins |
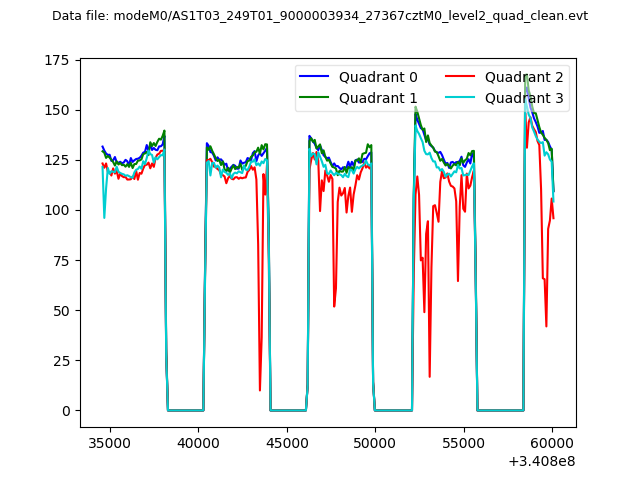 |
|
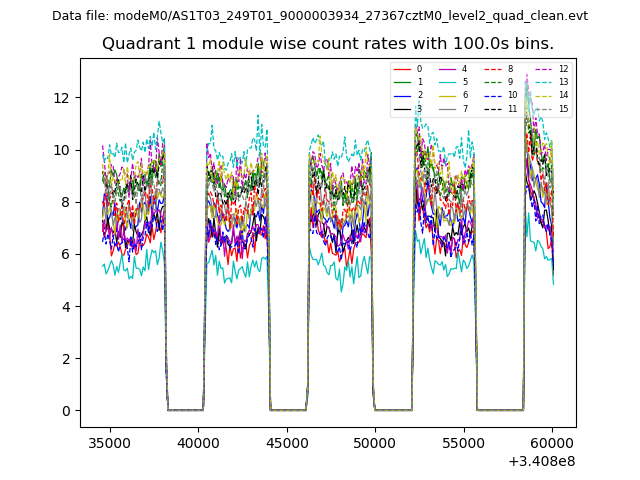
| Module-wise count rates for Quadrant A Data is divided into 100 sec bins |
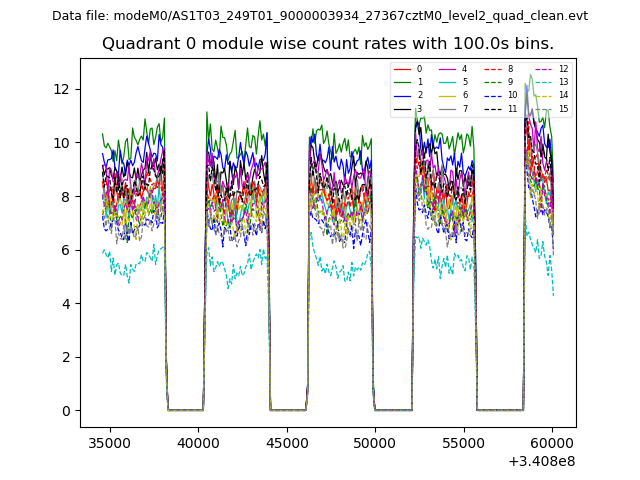 |
 |
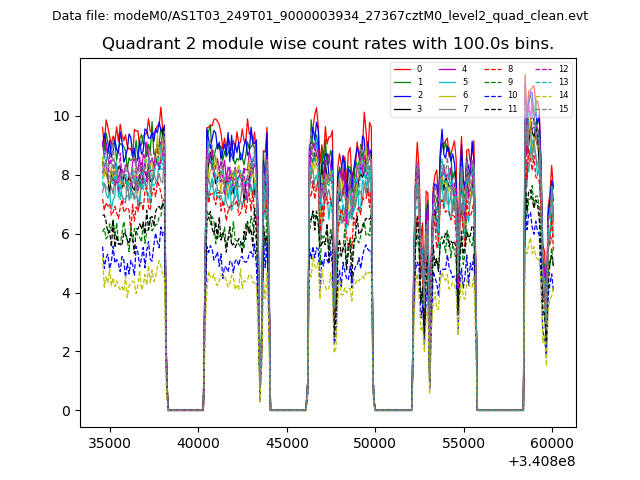
| Module-wise count rates for Quadrant B Data is divided into 100 sec bins |
 |
 |
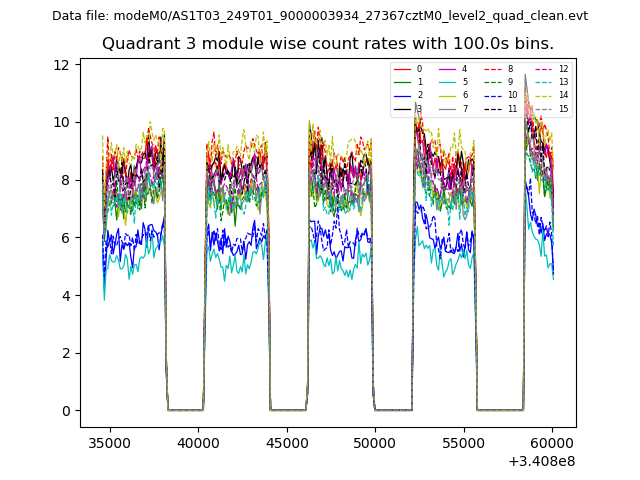
| Module-wise count rates for Quadrant C Data is divided into 100 sec bins |
 |
 |
| Module-wise count rates for Quadrant D Data is divided into 100 sec bins |
 |
 |
| Parameter | Plot |
|---|---|
| CZT HV Monitor | 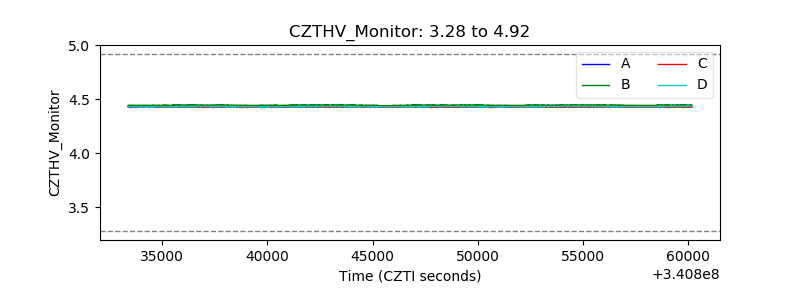 |
| D_VDD | 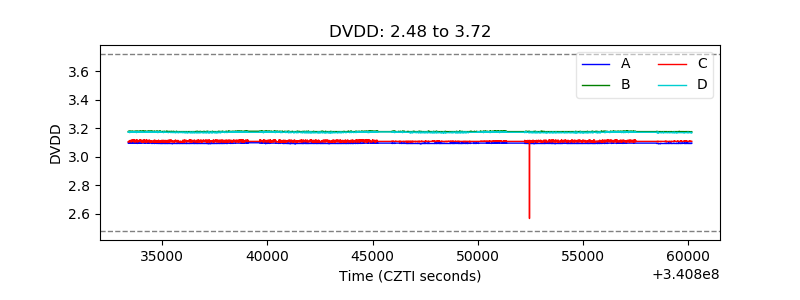 |
| Temperature 1 | 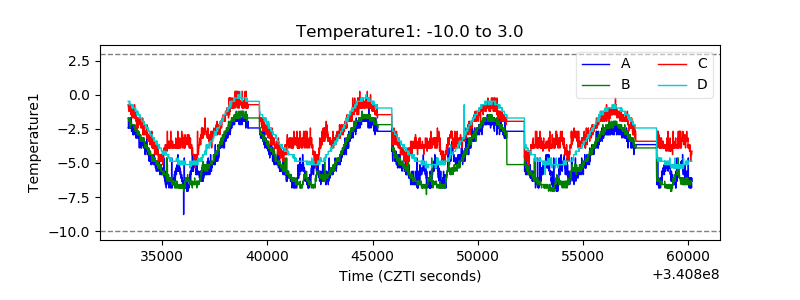 |
| Veto HV Monitor | 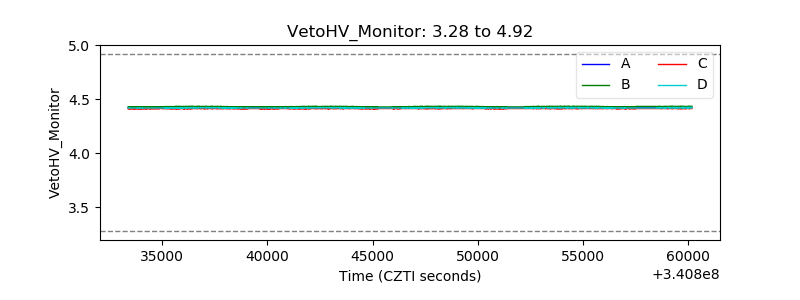 |
| Veto LLD | 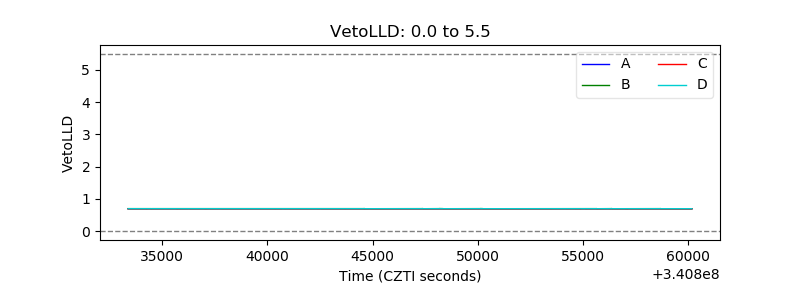 |
| Alpha Counter | 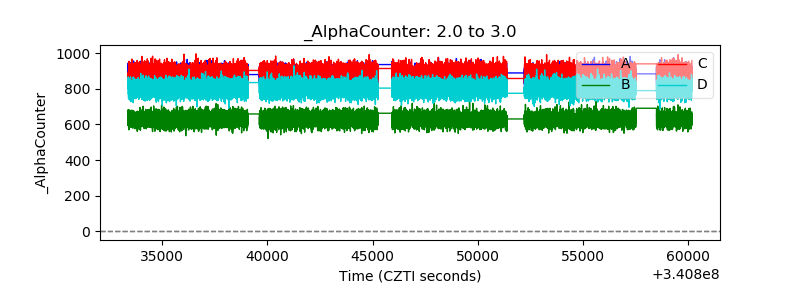 |
| _CPM_Rate | 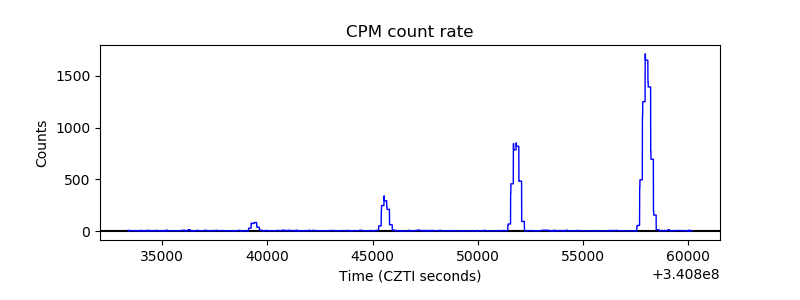 |
| CZT Counter | 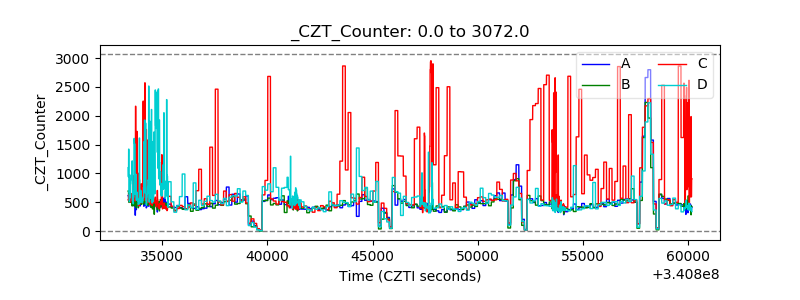 |
| +2.5 Volts monitor |  |
| +5 Volts monitor |  |
| _ROLL_ROT | 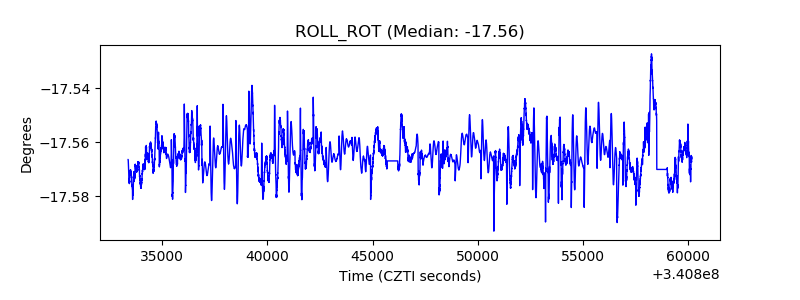 |
| _Roll_DEC | 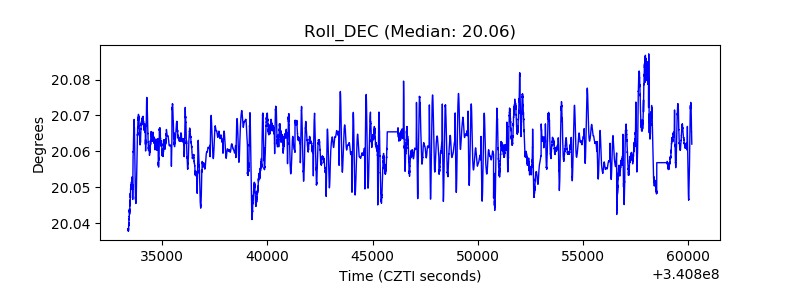 |
| _Roll_RA | 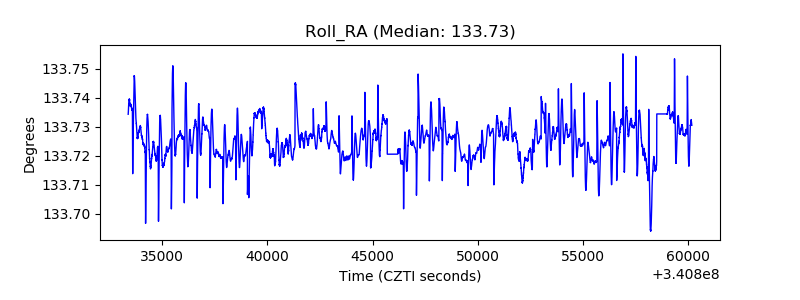 |
| Veto Counter | 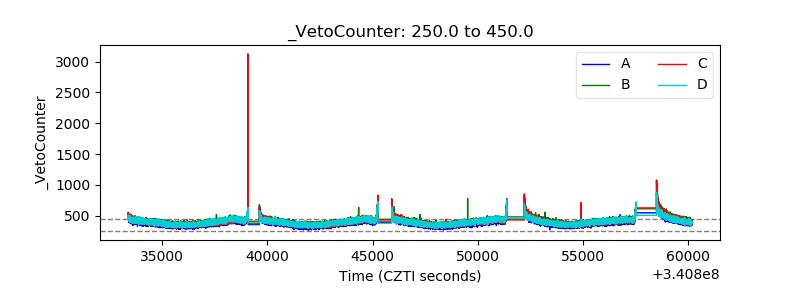 |