| Param | Original file | Final file |
|---|---|---|
| Filename | modeM0/AS1T03_249T01_9000003934_27369cztM0_level2.evt | modeM0/AS1T03_249T01_9000003934_27369cztM0_level2_quad_clean.evt |
| Size (bytes) | 508,440,960 | 90,774,720 |
| Size | 484.9 MB | 86.6 MB |
| Events in quadrant A | 3,095,775 | 601,373 |
| Events in quadrant B | 3,097,455 | 609,836 |
| Events in quadrant C | 5,378,793 | 524,965 |
| Events in quadrant D | 3,395,482 | 569,911 |
| Mode M0 | |||
|---|---|---|---|
| Quadrant | BADHDUFLAG | Total packets | Discarded packets |
| A | 0 | 13170 | 0 |
| B | 0 | 13170 | 0 |
| C | 0 | 19922 | 0 |
| D | 0 | 14266 | 0 |
| Mode M9 | |||
|---|---|---|---|
| Quadrant | BADHDUFLAG | Total packets | Discarded packets |
| A | 0 | 12 | 0 |
| B | 0 | 12 | 0 |
| C | 0 | 12 | 0 |
| D | 0 | 12 | 0 |
| Quadrant | Total seconds | Saturated seconds | Saturation percentage |
|---|---|---|---|
| A | 6353 | 37 | 0.582402% |
| B | 6354 | 46 | 0.723953% |
| C | 6354 | 840 | 13.220019% |
| D | 6354 | 65 | 1.022978% |
Noise dominated data is calculated using 1-second bins in cleaned event files. If a bin has >2000 counts, and if more than 50% of those come from <1% of pixels, then it is considered to be noise-dominated and hence unusable.
| Quadrant | # 1 sec bins | Bins with >0 counts | Bins with >2000 counts | High rate bins dominated by noise | Noise dominated (total time) | Noise dominated (detector-on time) | Marked lightcurve |
|---|---|---|---|---|---|---|---|
| A | 7468 | 6354 | 3 | 3 | 0.04% | 0.05% | 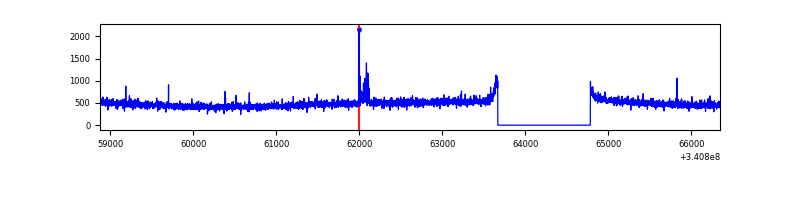 |
| B | 7469 | 6354 | 0 | 0 | 0.00% | 0.00% | 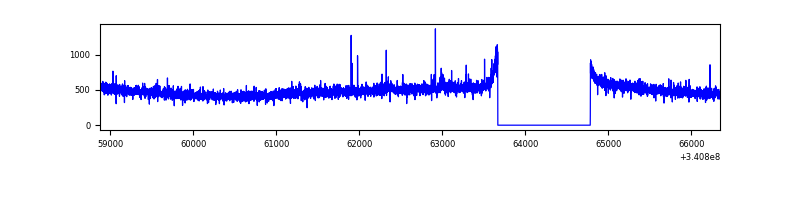 |
| C | 7469 | 6355 | 677 | 677 | 9.06% | 10.65% | 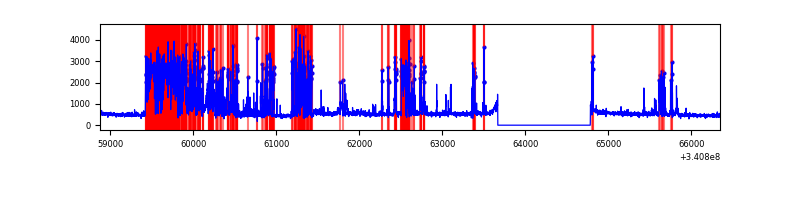 |
| D | 7469 | 6355 | 47 | 47 | 0.63% | 0.74% | 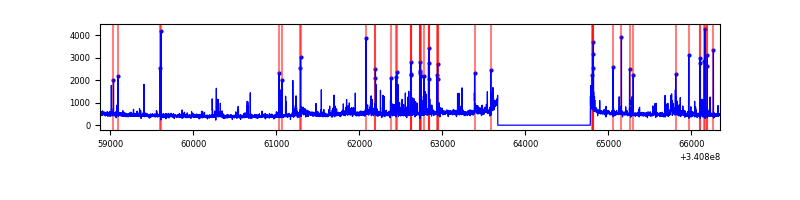 |
Top three noisy pixels from each quadrant. If the there are fewer than three noisy pixels in the level2.evt file, extra rows are filled as -1
| Pixel properties | Quadrant properties | ||||||
|---|---|---|---|---|---|---|---|
| Quadrant | DetID | PixID | Counts | Sigma | Mean | Median | Sigma |
| A | 12 | 96 | 44710 | 275.49 | 789 | 775 | 159.5 |
| A | 13 | 254 | 10379 | 60.22 | 789 | 775 | 159.5 |
| A | 12 | 189 | 8824 | 50.47 | 789 | 775 | 159.5 |
| B | 12 | 111 | 17699 | 114.51 | 784 | 766 | 147.9 |
| B | 11 | 111 | 15975 | 102.85 | 784 | 766 | 147.9 |
| B | 14 | 111 | 14613 | 93.64 | 784 | 766 | 147.9 |
| C | 2 | 16 | 2505701 | 15173.81 | 708 | 712 | 165.1 |
| C | 14 | 238 | 113781 | 684.91 | 708 | 712 | 165.1 |
| C | 13 | 61 | 4892 | 25.32 | 708 | 712 | 165.1 |
| D | 1 | 52 | 423423 | 2389.37 | 751 | 735 | 176.9 |
| D | 2 | 250 | 44563 | 247.75 | 751 | 735 | 176.9 |
| D | 6 | 112 | 36745 | 203.56 | 751 | 735 | 176.9 |
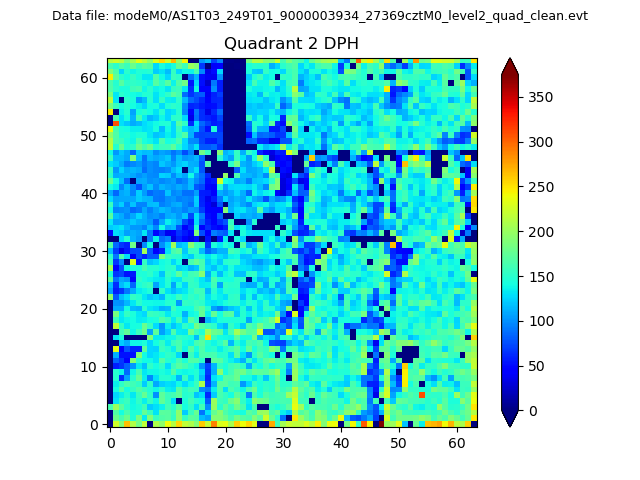
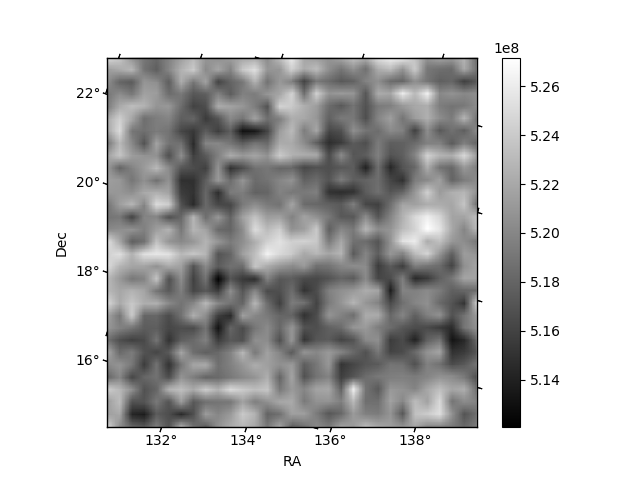
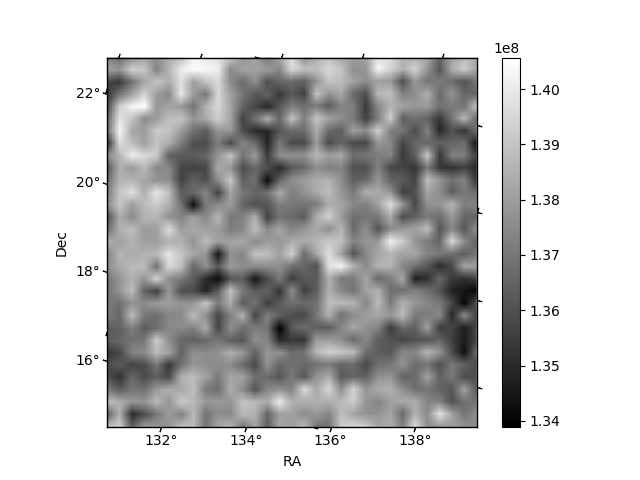
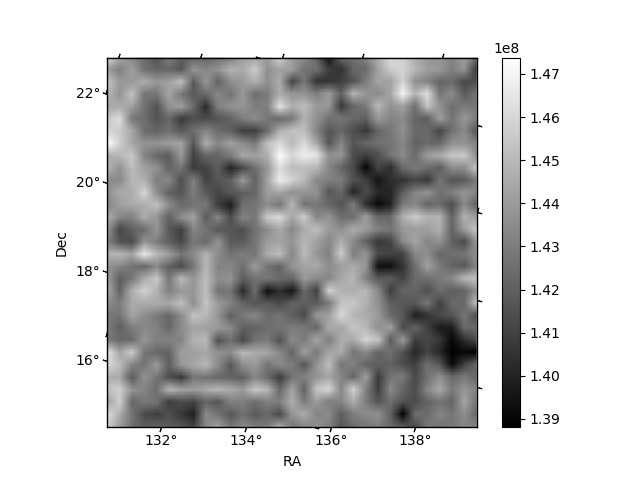
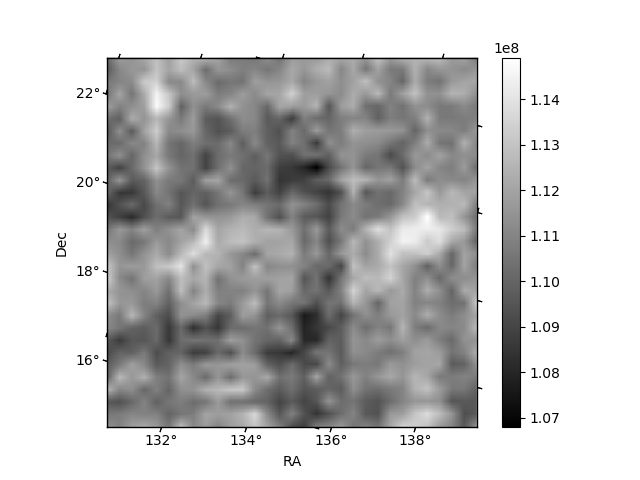
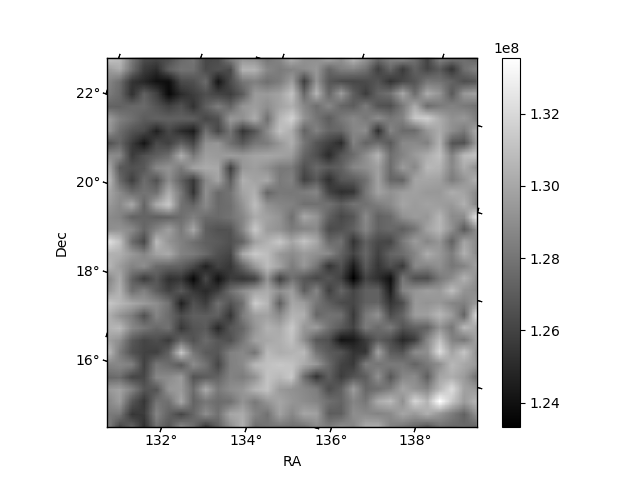
Histogram calculated using DETX and DETY for each event in the final _common_clean file
| Quadrant A | 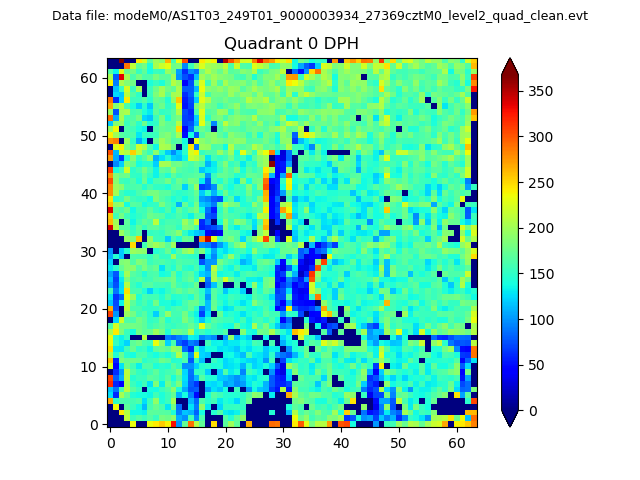 |
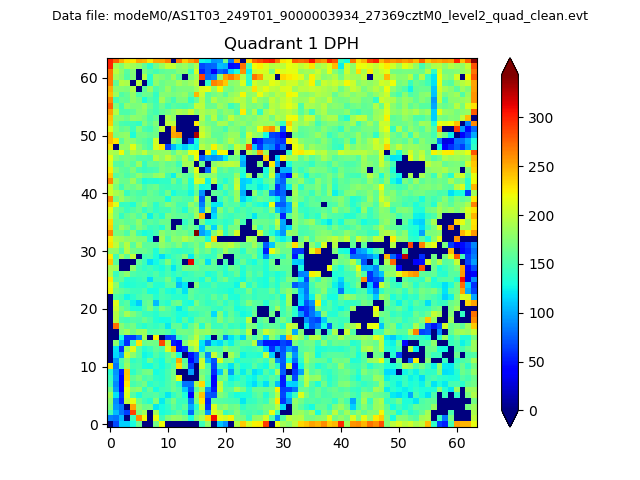 |
Quadrant B |
|---|---|---|---|
| Quadrant D | 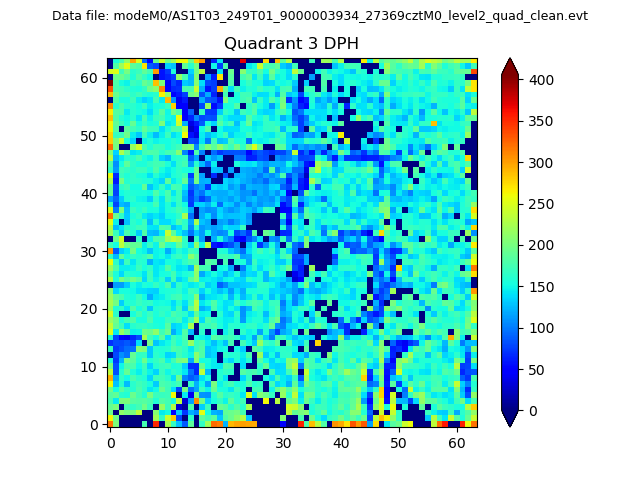 |
 |
Quadrant C |
| Plot type | Count rate plots | Images |
|---|---|---|
| Comparison with Poisson distribution Blue bars denote a histogram of data divided into 1 sec bins. Red curve is a Poisson curve with rate = median count rate of data. |
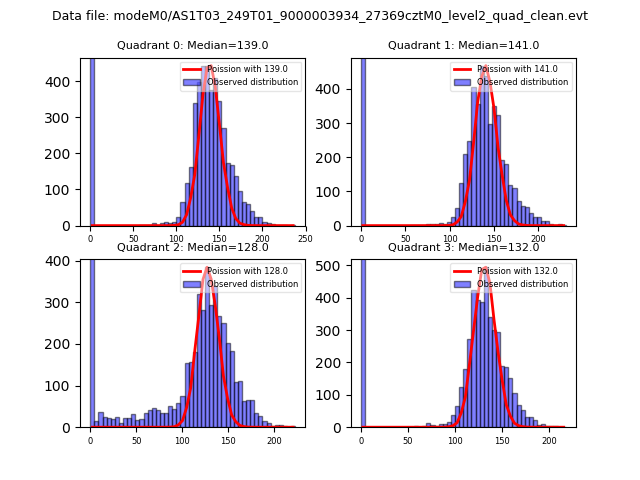 |
 |
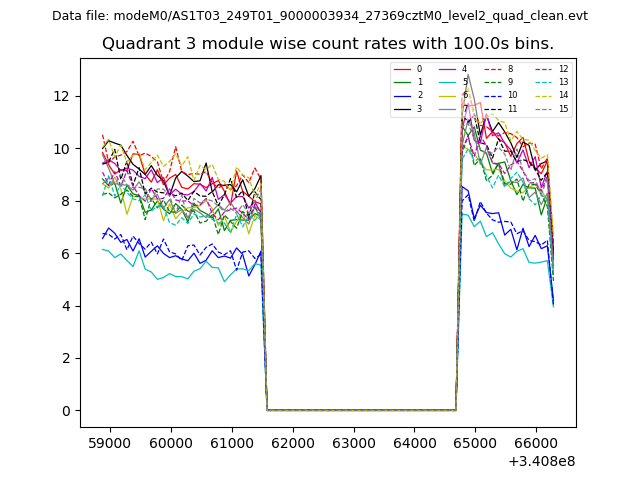
| Quadrant-wise count rates Data is divided into 100 sec bins |
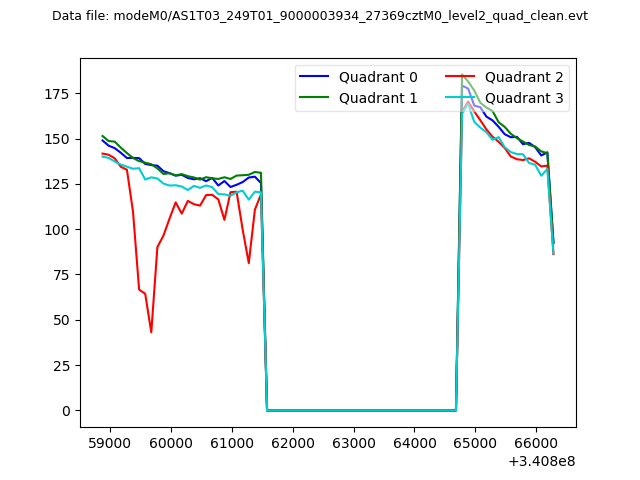 |
|
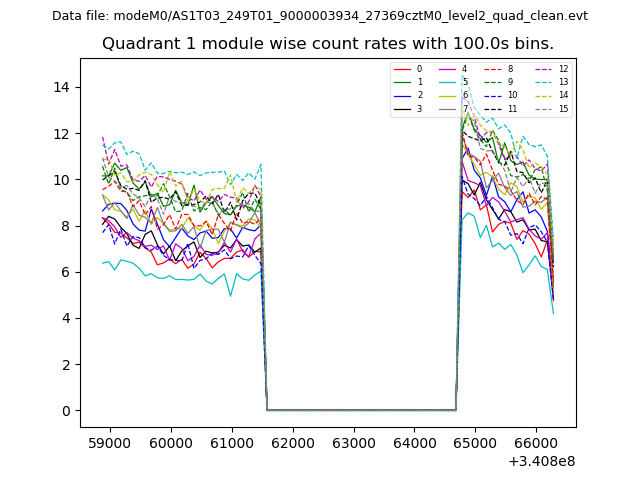
| Module-wise count rates for Quadrant A Data is divided into 100 sec bins |
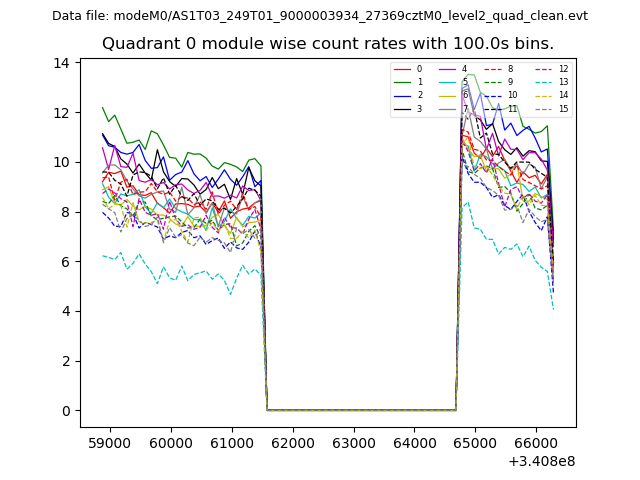 |
 |
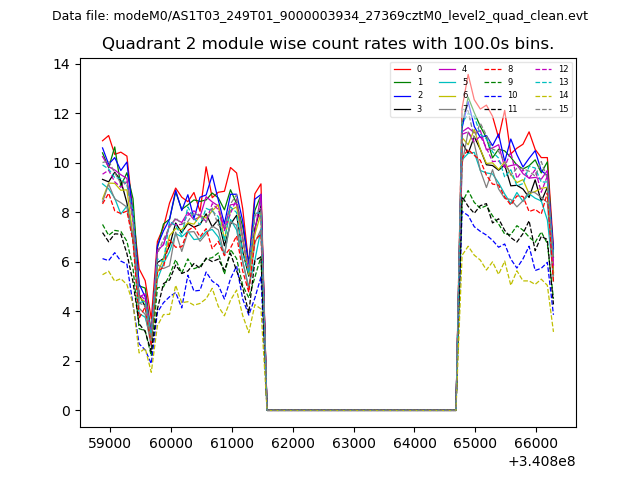
| Module-wise count rates for Quadrant B Data is divided into 100 sec bins |
 |
 |
| Module-wise count rates for Quadrant C Data is divided into 100 sec bins |
 |
 |
| Module-wise count rates for Quadrant D Data is divided into 100 sec bins |
 |
 |
| Parameter | Plot |
|---|---|
| CZT HV Monitor | 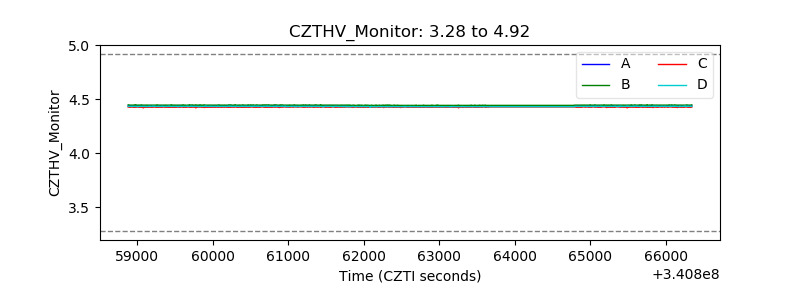 |
| D_VDD | 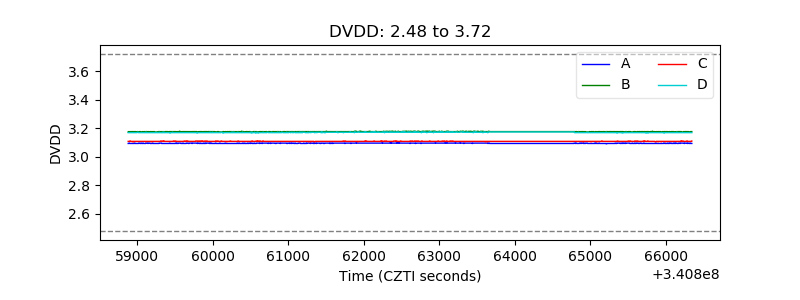 |
| Temperature 1 | 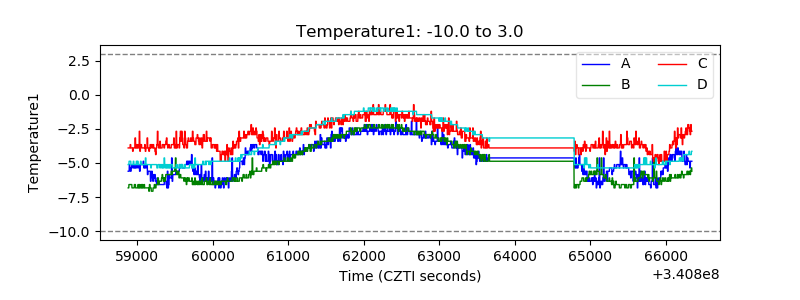 |
| Veto HV Monitor | 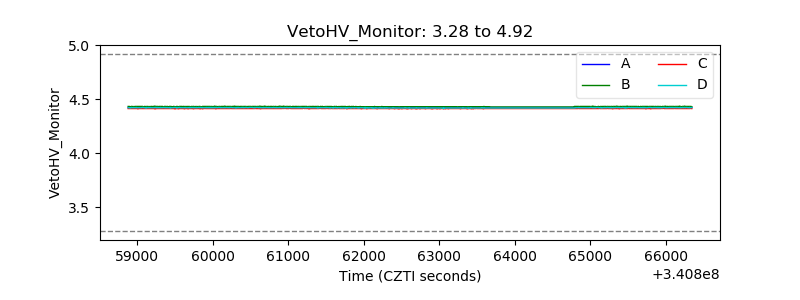 |
| Veto LLD | 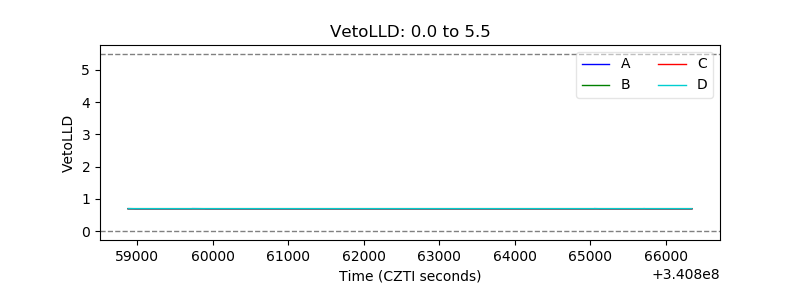 |
| Alpha Counter | 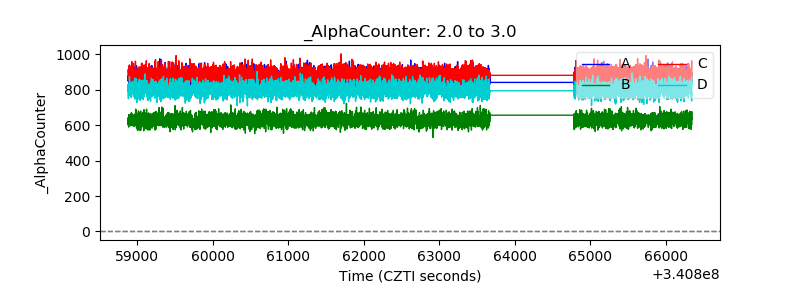 |
| _CPM_Rate | 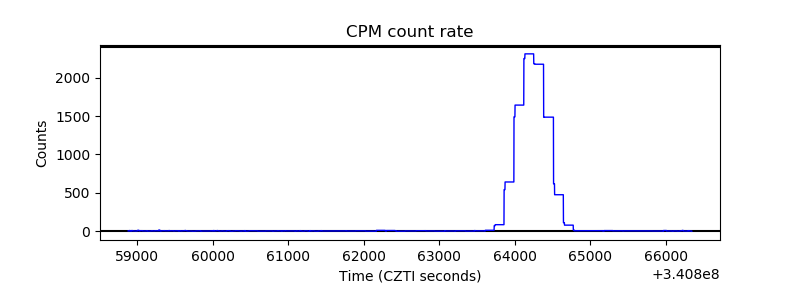 |
| CZT Counter | 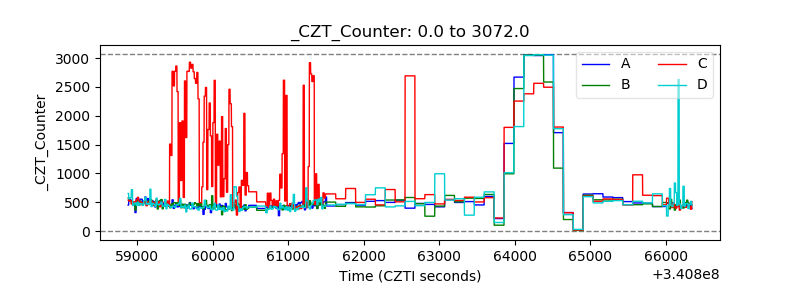 |
| +2.5 Volts monitor | 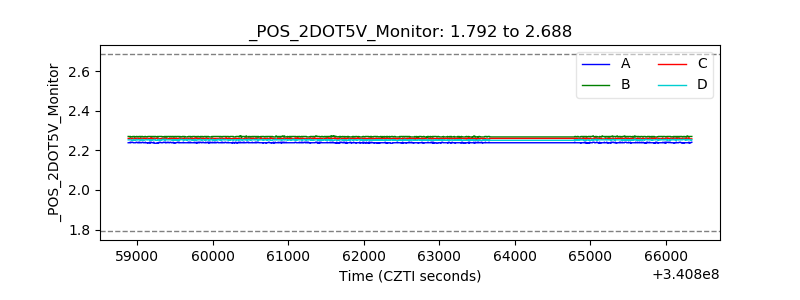 |
| +5 Volts monitor |  |
| _ROLL_ROT | 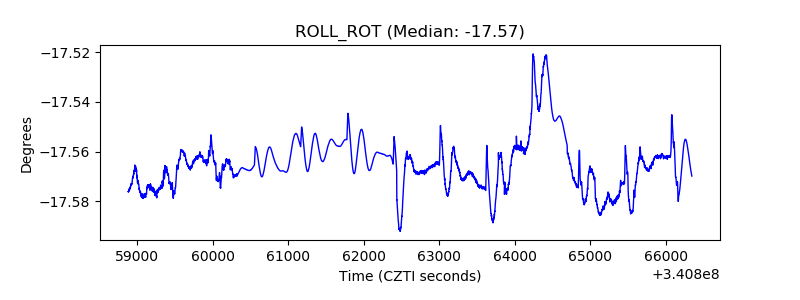 |
| _Roll_DEC | 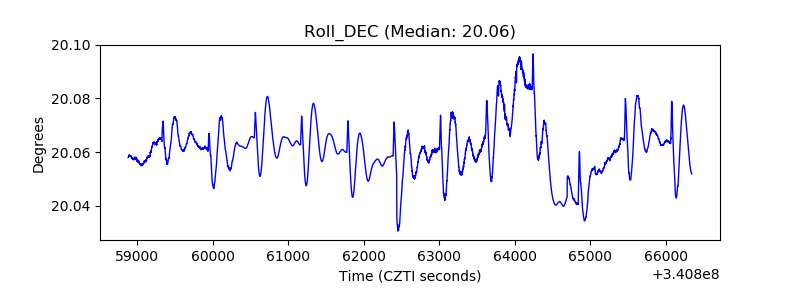 |
| _Roll_RA | 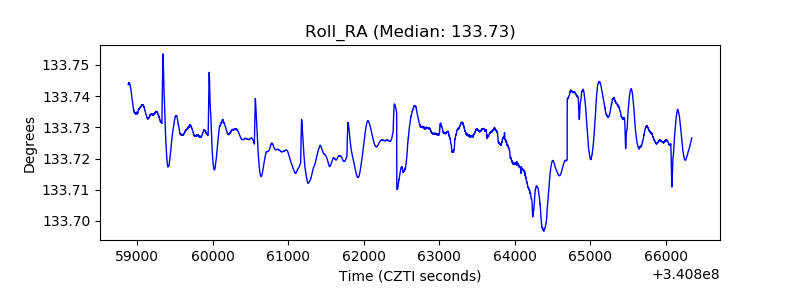 |
| Veto Counter |  |