| Param | Original file | Final file |
|---|---|---|
| Filename | modeM0/AS1T03_249T01_9000003934_27371cztM0_level2.evt | modeM0/AS1T03_249T01_9000003934_27371cztM0_level2_quad_clean.evt |
| Size (bytes) | 541,336,320 | 90,864,000 |
| Size | 516.3 MB | 86.7 MB |
| Events in quadrant A | 3,098,641 | 603,093 |
| Events in quadrant B | 3,174,748 | 608,701 |
| Events in quadrant C | 5,568,830 | 552,117 |
| Events in quadrant D | 4,148,814 | 571,943 |
| Mode M0 | |||
|---|---|---|---|
| Quadrant | BADHDUFLAG | Total packets | Discarded packets |
| A | 0 | 12498 | 0 |
| B | 0 | 12772 | 0 |
| C | 0 | 20374 | 0 |
| D | 0 | 16032 | 0 |
| Mode M9 | |||
|---|---|---|---|
| Quadrant | BADHDUFLAG | Total packets | Discarded packets |
| A | 0 | 13 | 0 |
| B | 0 | 13 | 0 |
| C | 0 | 13 | 0 |
| D | 0 | 13 | 0 |
| Quadrant | Total seconds | Saturated seconds | Saturation percentage |
|---|---|---|---|
| A | 5947 | 29 | 0.487641% |
| B | 5948 | 64 | 1.075992% |
| C | 5948 | 902 | 15.164761% |
| D | 5948 | 222 | 3.732347% |
Noise dominated data is calculated using 1-second bins in cleaned event files. If a bin has >2000 counts, and if more than 50% of those come from <1% of pixels, then it is considered to be noise-dominated and hence unusable.
| Quadrant | # 1 sec bins | Bins with >0 counts | Bins with >2000 counts | High rate bins dominated by noise | Noise dominated (total time) | Noise dominated (detector-on time) | Marked lightcurve |
|---|---|---|---|---|---|---|---|
| A | 7237 | 5948 | 0 | 0 | 0.00% | 0.00% | 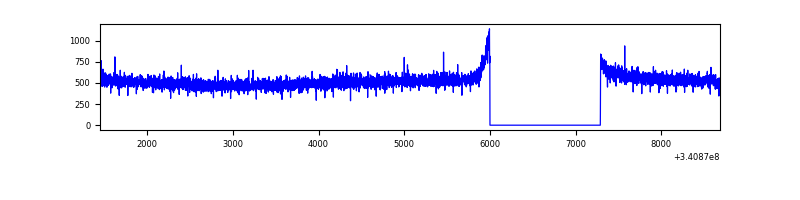 |
| B | 7238 | 5949 | 11 | 11 | 0.15% | 0.18% | 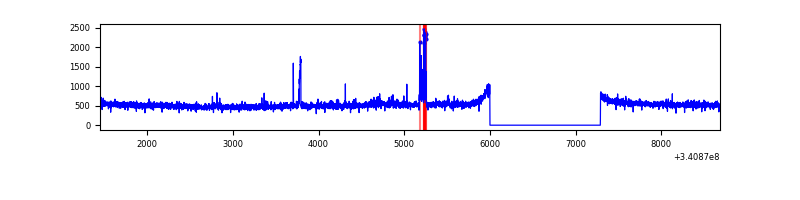 |
| C | 7238 | 5949 | 641 | 641 | 8.86% | 10.77% | 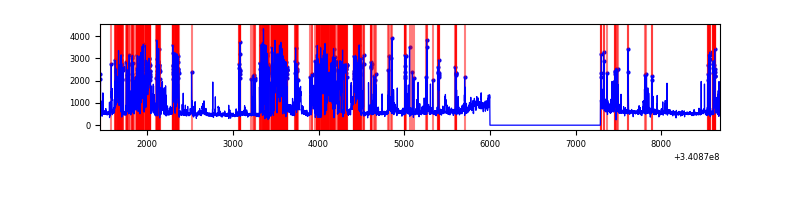 |
| D | 7238 | 5949 | 202 | 202 | 2.79% | 3.40% | 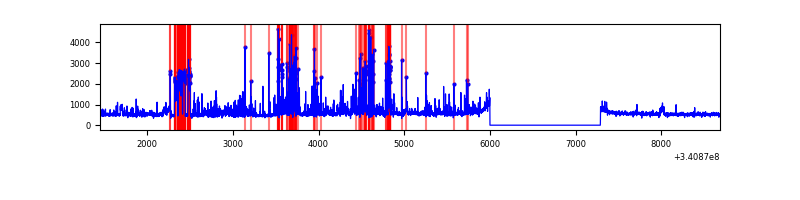 |
Top three noisy pixels from each quadrant. If the there are fewer than three noisy pixels in the level2.evt file, extra rows are filled as -1
| Pixel properties | Quadrant properties | ||||||
|---|---|---|---|---|---|---|---|
| Quadrant | DetID | PixID | Counts | Sigma | Mean | Median | Sigma |
| A | 13 | 254 | 9613 | 55.15 | 802 | 789 | 160.0 |
| A | 0 | 226 | 7022 | 38.95 | 802 | 789 | 160.0 |
| A | 3 | 137 | 6839 | 37.81 | 802 | 789 | 160.0 |
| B | 15 | 32 | 86080 | 584.51 | 786 | 770 | 146.0 |
| B | 12 | 111 | 17516 | 114.74 | 786 | 770 | 146.0 |
| B | 11 | 111 | 15695 | 102.26 | 786 | 770 | 146.0 |
| C | 2 | 16 | 2630426 | 15743.94 | 720 | 726 | 167.0 |
| C | 14 | 238 | 117507 | 699.16 | 720 | 726 | 167.0 |
| C | 15 | 208 | 7669 | 41.57 | 720 | 726 | 167.0 |
| D | 1 | 52 | 1084539 | 6053.65 | 763 | 746 | 179.0 |
| D | 2 | 120 | 90334 | 500.4 | 763 | 746 | 179.0 |
| D | 2 | 250 | 80656 | 446.35 | 763 | 746 | 179.0 |
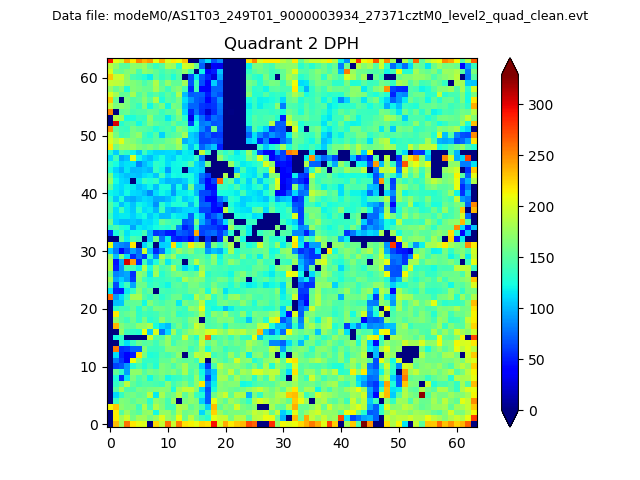
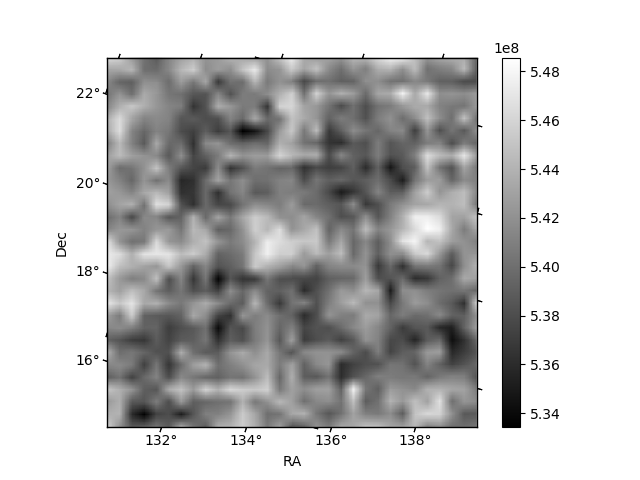
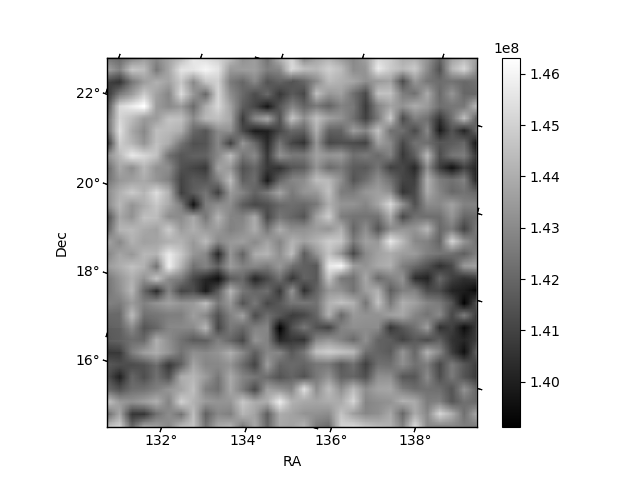
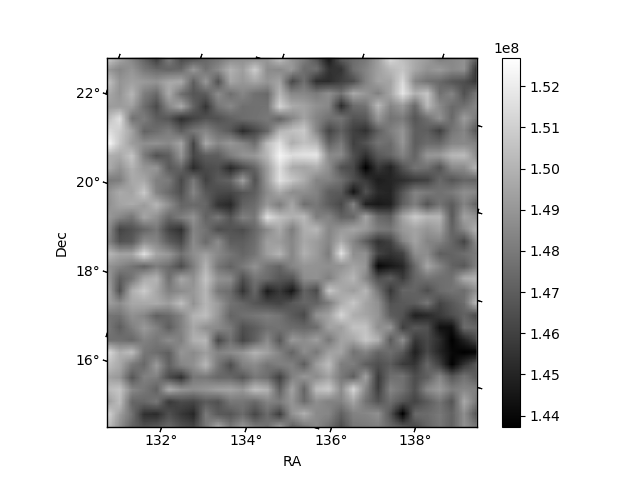
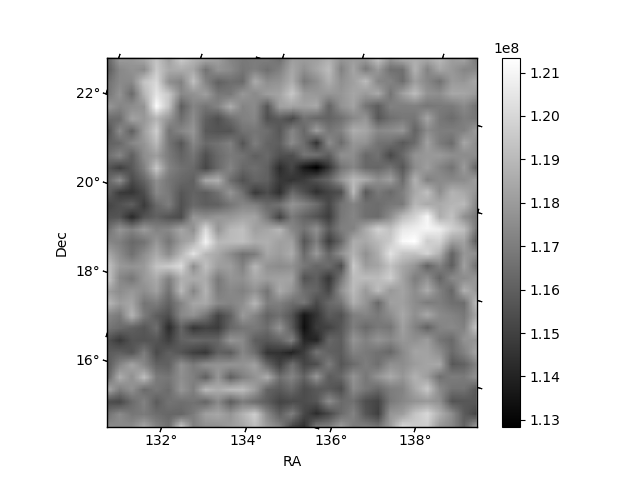
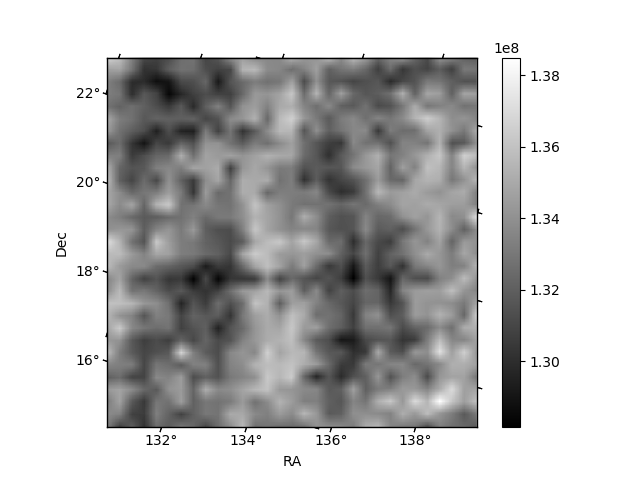
Histogram calculated using DETX and DETY for each event in the final _common_clean file
| Quadrant A | 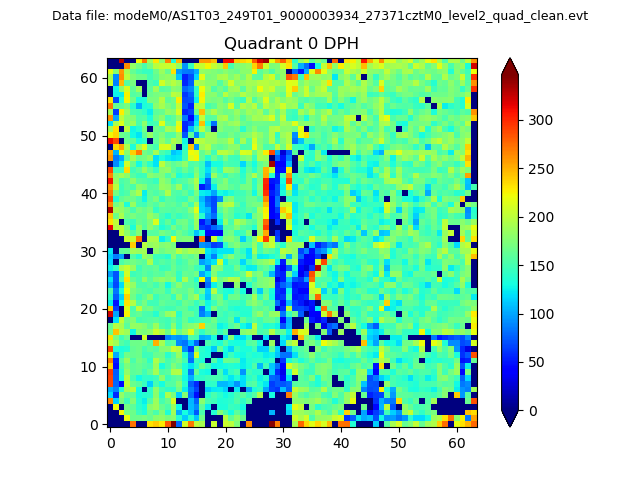 |
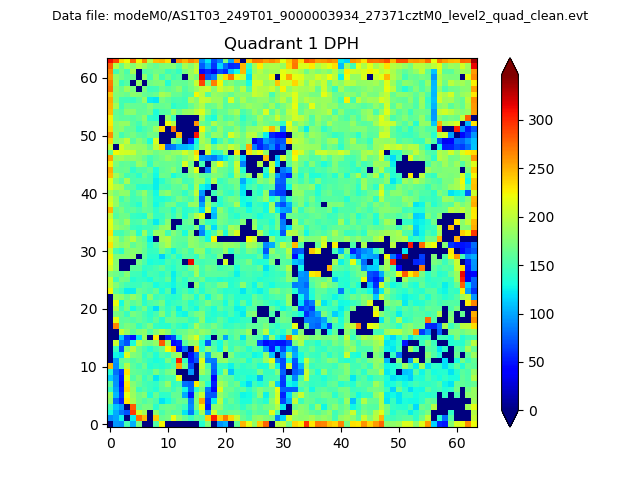 |
Quadrant B |
|---|---|---|---|
| Quadrant D | 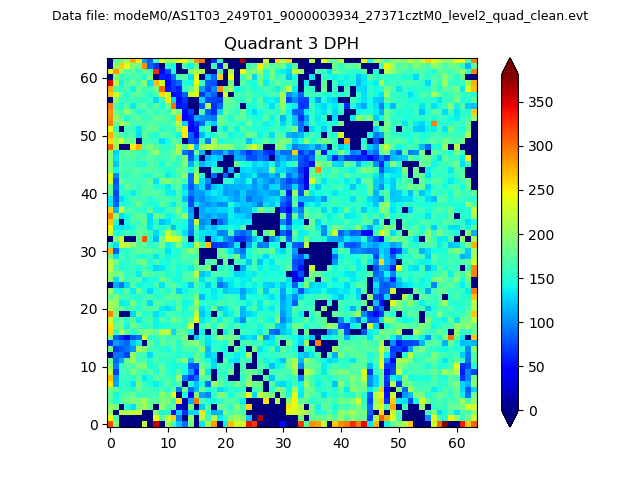 |
 |
Quadrant C |
| Plot type | Count rate plots | Images |
|---|---|---|
| Comparison with Poisson distribution Blue bars denote a histogram of data divided into 1 sec bins. Red curve is a Poisson curve with rate = median count rate of data. |
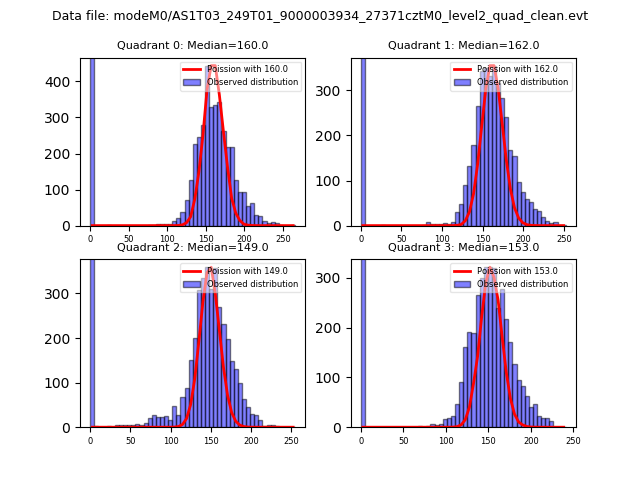 |
 |
| Quadrant-wise count rates Data is divided into 100 sec bins |
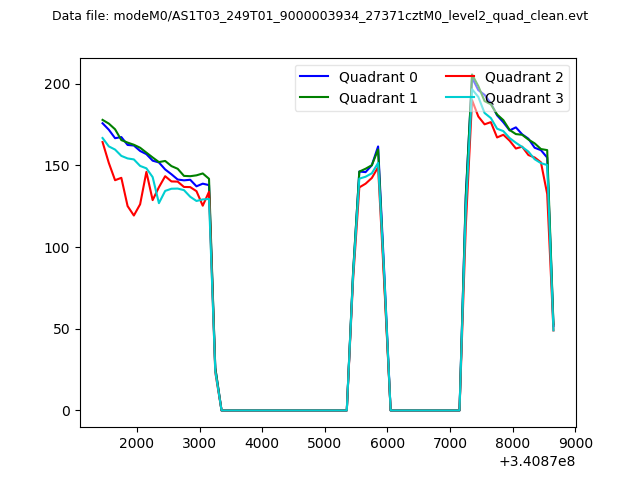 |
|
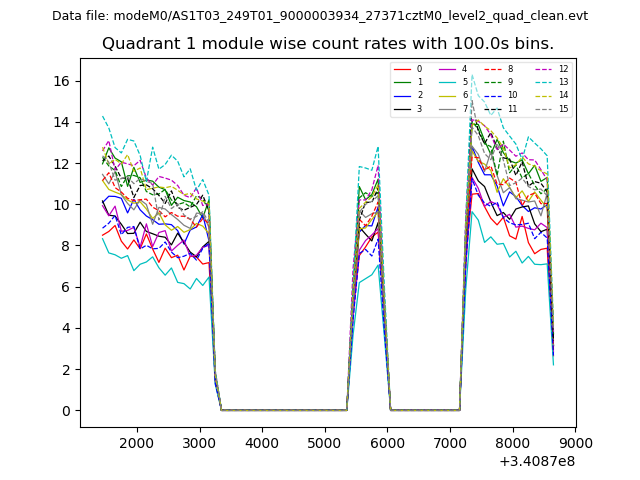
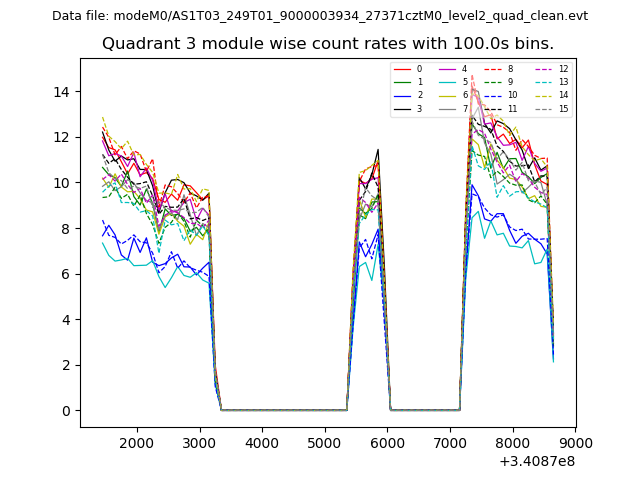
| Module-wise count rates for Quadrant A Data is divided into 100 sec bins |
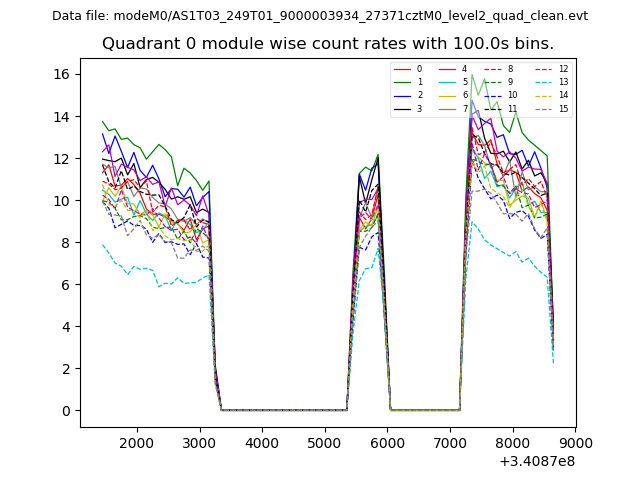 |
 |
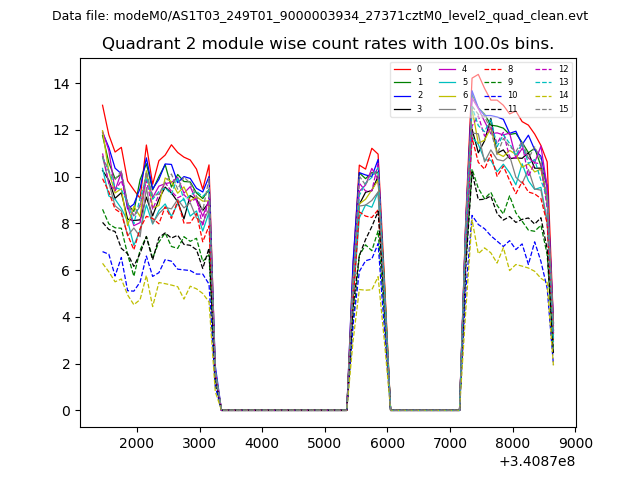
| Module-wise count rates for Quadrant B Data is divided into 100 sec bins |
 |
 |
| Module-wise count rates for Quadrant C Data is divided into 100 sec bins |
 |
 |
| Module-wise count rates for Quadrant D Data is divided into 100 sec bins |
 |
 |
| Parameter | Plot |
|---|---|
| CZT HV Monitor | 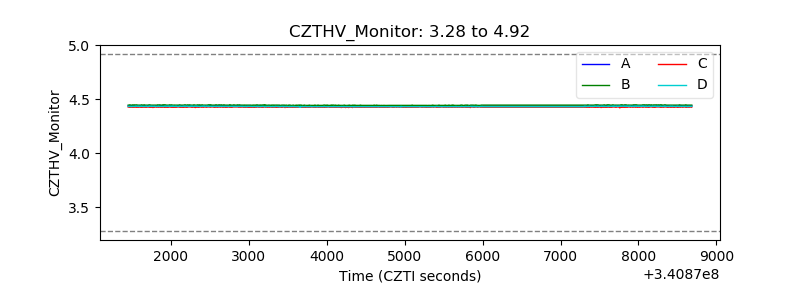 |
| D_VDD | 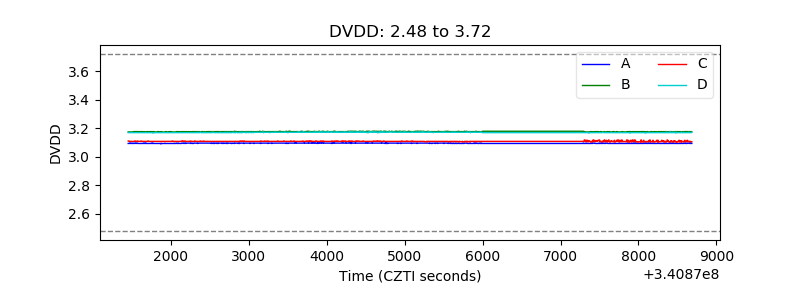 |
| Temperature 1 | 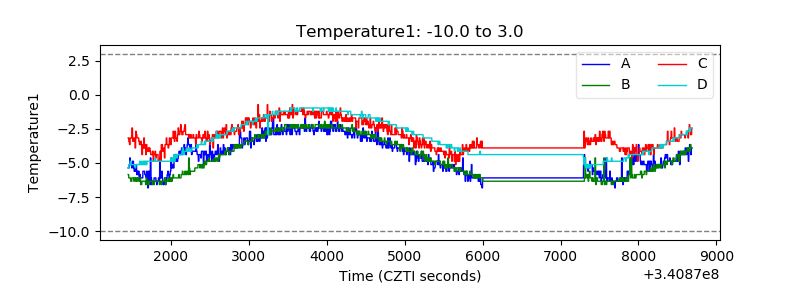 |
| Veto HV Monitor | 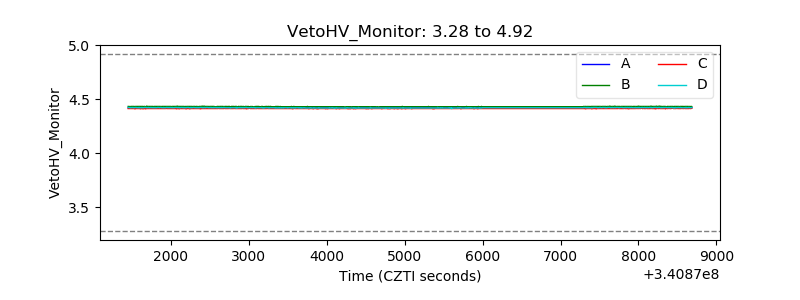 |
| Veto LLD | 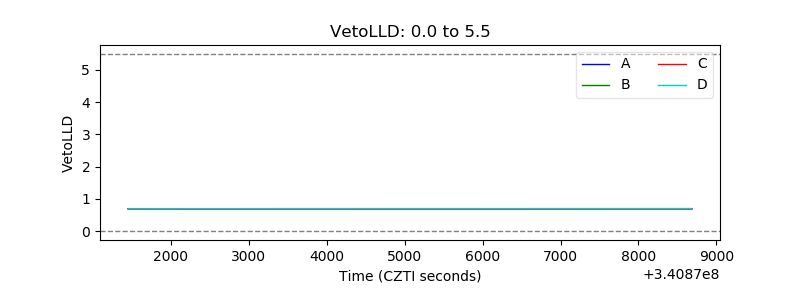 |
| Alpha Counter | 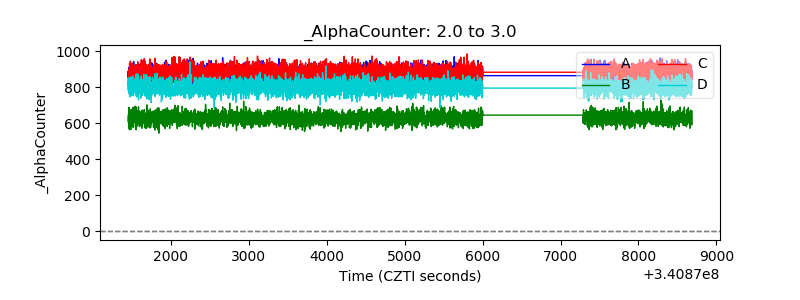 |
| _CPM_Rate | 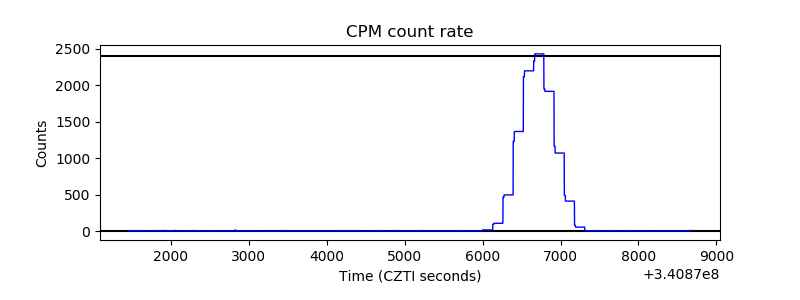 |
| CZT Counter |  |
| +2.5 Volts monitor |  |
| +5 Volts monitor |  |
| _ROLL_ROT | 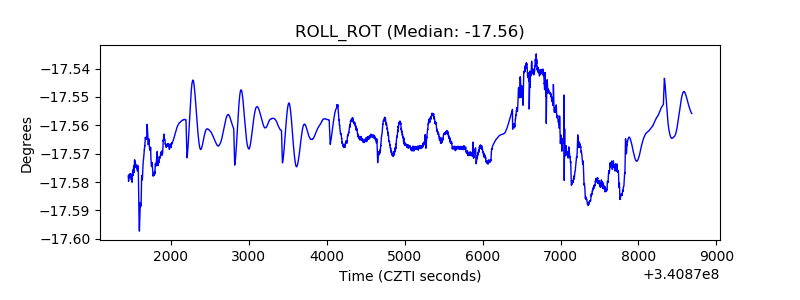 |
| _Roll_DEC |  |
| _Roll_RA | 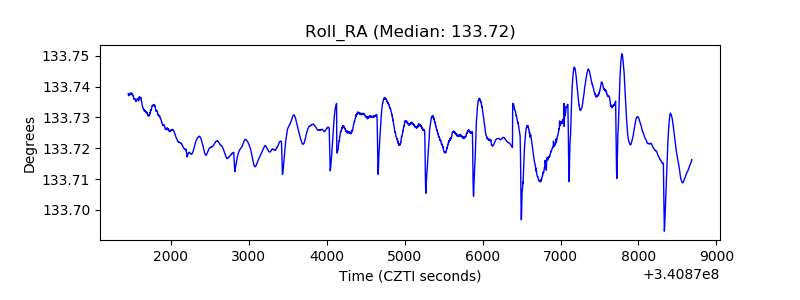 |
| Veto Counter |  |