| Param | Original file | Final file |
|---|---|---|
| Filename | modeM0/AS1T03_249T01_9000003934_27375cztM0_level2.evt | modeM0/AS1T03_249T01_9000003934_27375cztM0_level2_quad_clean.evt |
| Size (bytes) | 745,159,680 | 61,597,440 |
| Size | 710.6 MB | 58.7 MB |
| Events in quadrant A | 3,099,345 | 425,646 |
| Events in quadrant B | 3,141,288 | 421,415 |
| Events in quadrant C | 7,150,617 | 225,252 |
| Events in quadrant D | 8,758,879 | 360,863 |
| Mode M0 | |||
|---|---|---|---|
| Quadrant | BADHDUFLAG | Total packets | Discarded packets |
| A | 0 | 12881 | 0 |
| B | 0 | 12956 | 0 |
| C | 0 | 25102 | 0 |
| D | 0 | 30167 | 0 |
| Mode M9 | |||
|---|---|---|---|
| Quadrant | BADHDUFLAG | Total packets | Discarded packets |
| A | 0 | 6 | 0 |
| B | 0 | 6 | 0 |
| C | 0 | 6 | 0 |
| D | 0 | 6 | 0 |
| Quadrant | Total seconds | Saturated seconds | Saturation percentage |
|---|---|---|---|
| A | 6234 | 108 | 1.732435% |
| B | 6223 | 119 | 1.912261% |
| C | 6164 | 1964 | 31.862427% |
| D | 5943 | 1643 | 27.645970% |
Noise dominated data is calculated using 1-second bins in cleaned event files. If a bin has >2000 counts, and if more than 50% of those come from <1% of pixels, then it is considered to be noise-dominated and hence unusable.
| Quadrant | # 1 sec bins | Bins with >0 counts | Bins with >2000 counts | High rate bins dominated by noise | Noise dominated (total time) | Noise dominated (detector-on time) | Marked lightcurve |
|---|---|---|---|---|---|---|---|
| A | 7200 | 6414 | 0 | 0 | 0.00% | 0.00% | 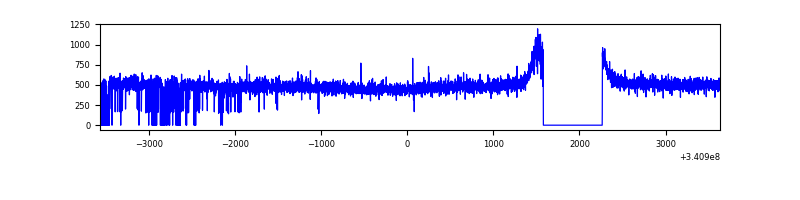 |
| B | 7201 | 6388 | 2 | 2 | 0.03% | 0.03% | 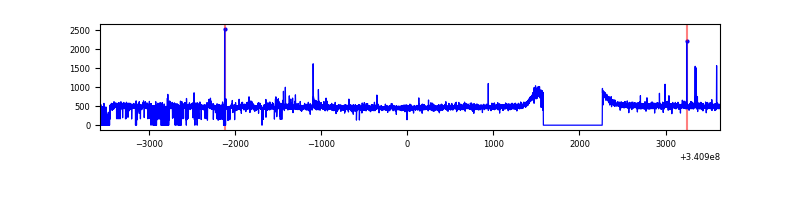 |
| C | 7201 | 6316 | 1664 | 1664 | 23.11% | 26.35% | 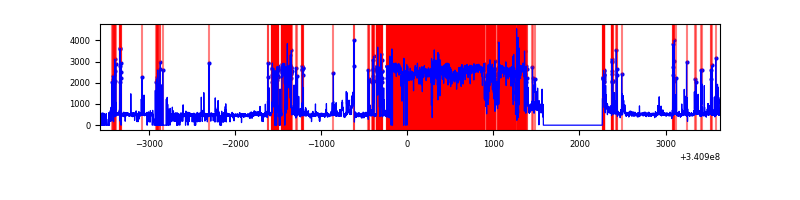 |
| D | 7201 | 6148 | 1365 | 1365 | 18.96% | 22.20% | 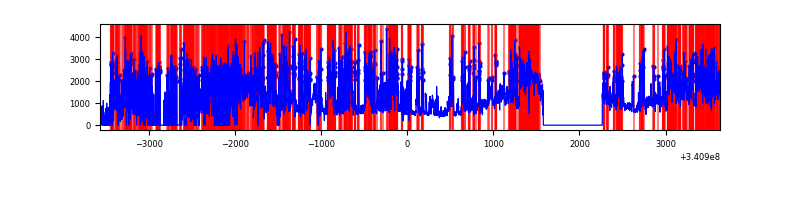 |
Top three noisy pixels from each quadrant. If the there are fewer than three noisy pixels in the level2.evt file, extra rows are filled as -1
| Pixel properties | Quadrant properties | ||||||
|---|---|---|---|---|---|---|---|
| Quadrant | DetID | PixID | Counts | Sigma | Mean | Median | Sigma |
| A | 12 | 189 | 12497 | 72.09 | 800 | 785 | 162.5 |
| A | 13 | 254 | 10113 | 57.41 | 800 | 785 | 162.5 |
| A | 3 | 137 | 7497 | 41.31 | 800 | 785 | 162.5 |
| B | 15 | 32 | 21392 | 137.37 | 784 | 764 | 150.2 |
| B | 12 | 111 | 18545 | 118.41 | 784 | 764 | 150.2 |
| B | 11 | 111 | 16382 | 104.01 | 784 | 764 | 150.2 |
| C | 2 | 16 | 4742738 | 34077.0 | 591 | 594 | 139.2 |
| C | 14 | 238 | 94268 | 673.14 | 591 | 594 | 139.2 |
| C | 15 | 208 | 7775 | 51.6 | 591 | 594 | 139.2 |
| D | 1 | 52 | 5816933 | 36983.34 | 664 | 649 | 157.3 |
| D | 2 | 250 | 211912 | 1343.33 | 664 | 649 | 157.3 |
| D | 12 | 227 | 154005 | 975.13 | 664 | 649 | 157.3 |
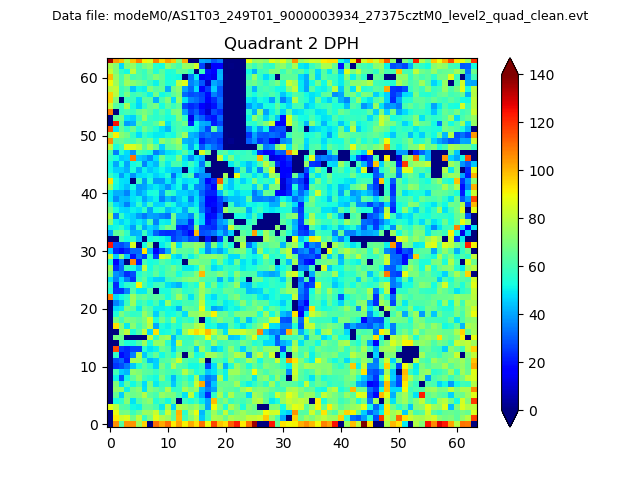
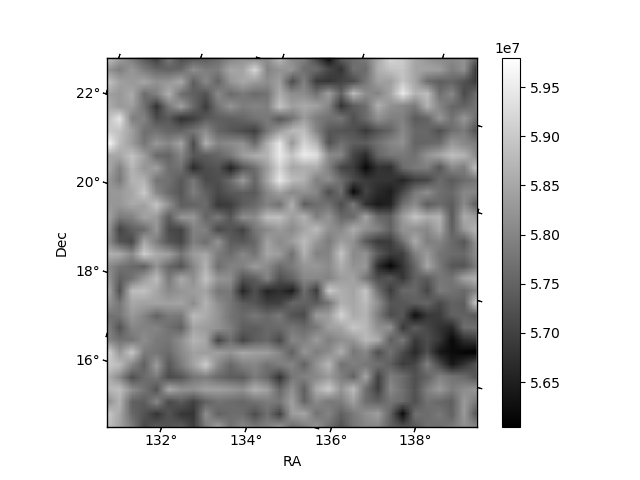
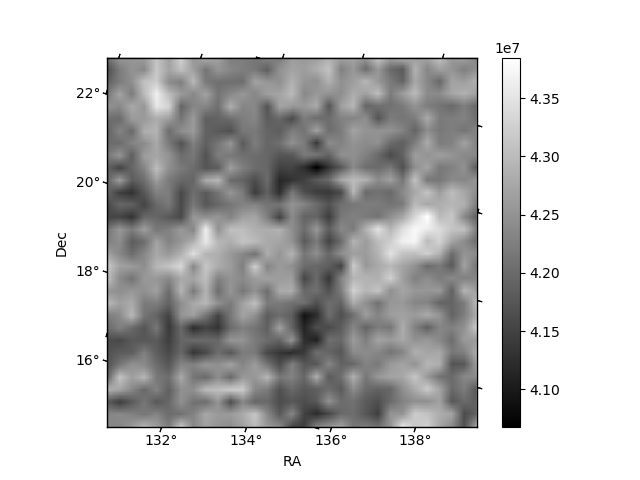
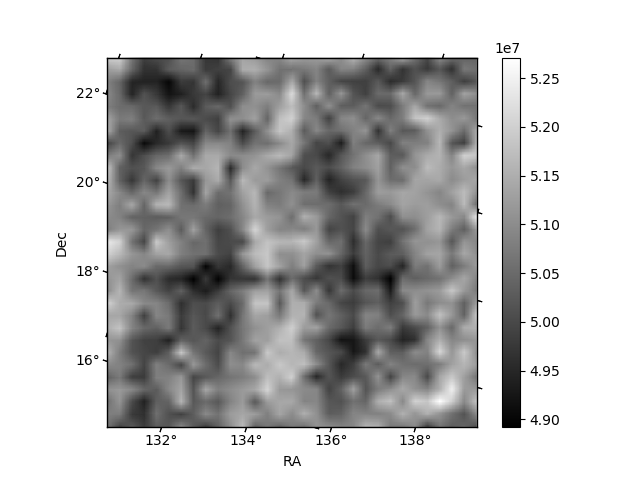
Histogram calculated using DETX and DETY for each event in the final _common_clean file
| Quadrant A | 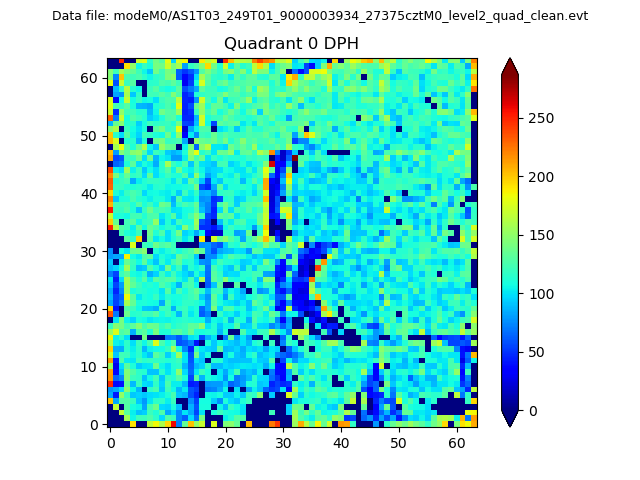 |
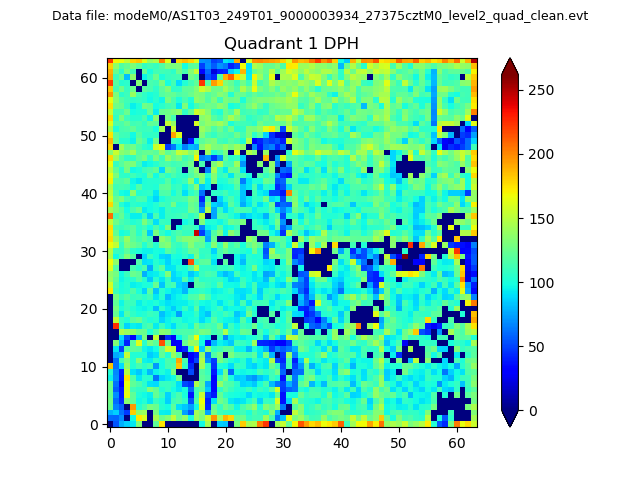 |
Quadrant B |
|---|---|---|---|
| Quadrant D | 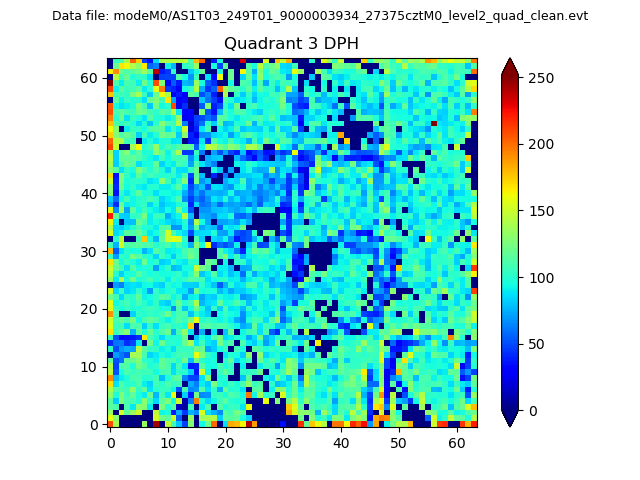 |
 |
Quadrant C |
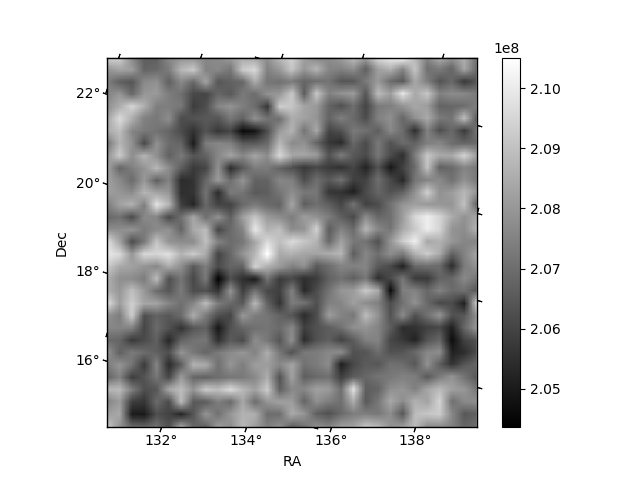
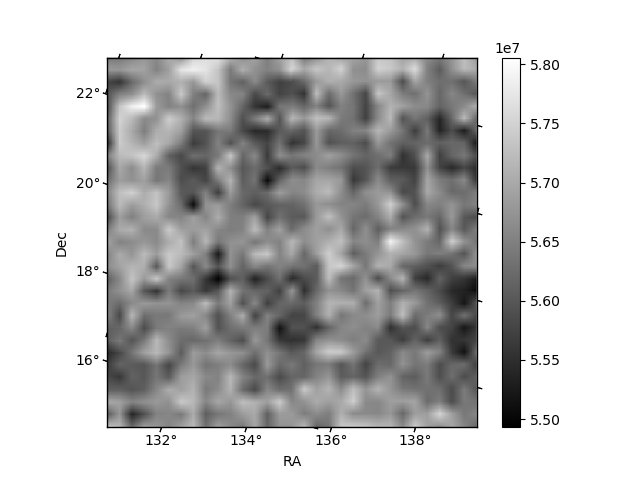
| Plot type | Count rate plots | Images |
|---|---|---|
| Comparison with Poisson distribution Blue bars denote a histogram of data divided into 1 sec bins. Red curve is a Poisson curve with rate = median count rate of data. |
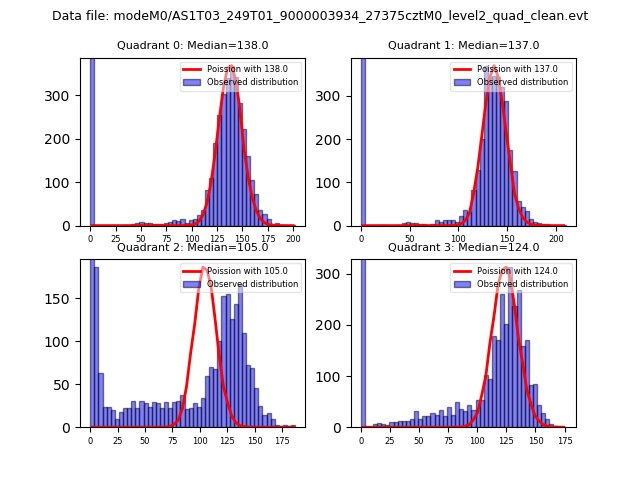 |
 |
| Quadrant-wise count rates Data is divided into 100 sec bins |
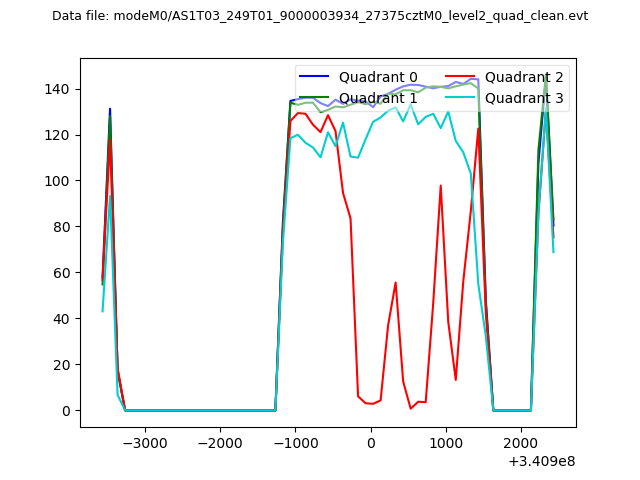 |
|
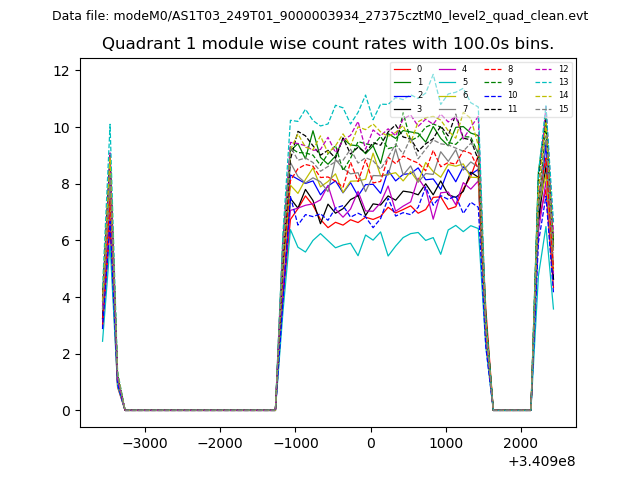
| Module-wise count rates for Quadrant A Data is divided into 100 sec bins |
 |
 |
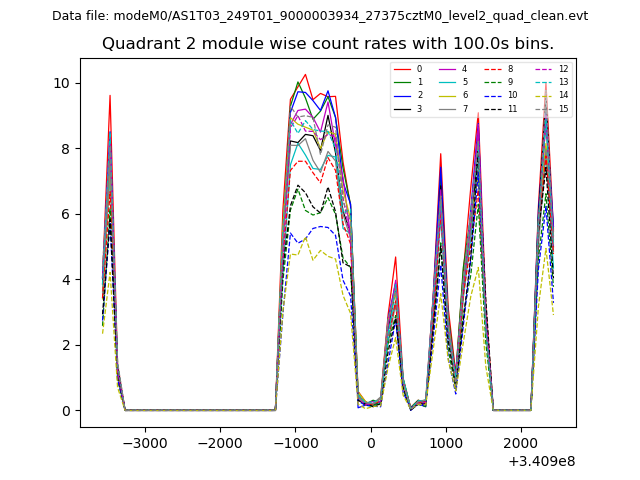
| Module-wise count rates for Quadrant B Data is divided into 100 sec bins |
 |
 |
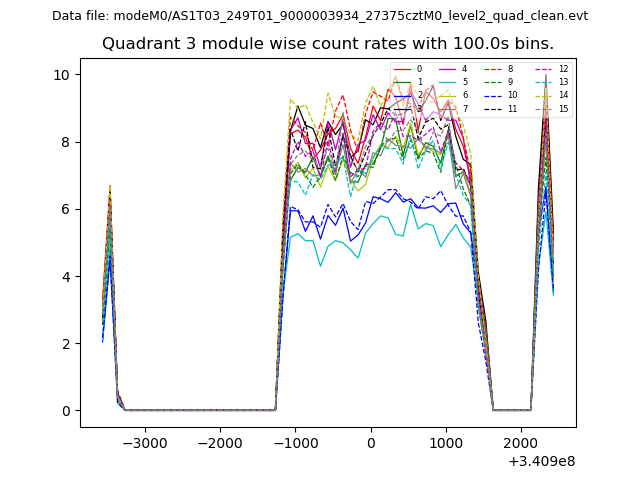
| Module-wise count rates for Quadrant C Data is divided into 100 sec bins |
 |
 |
| Module-wise count rates for Quadrant D Data is divided into 100 sec bins |
 |
 |
| Parameter | Plot |
|---|---|
| CZT HV Monitor | 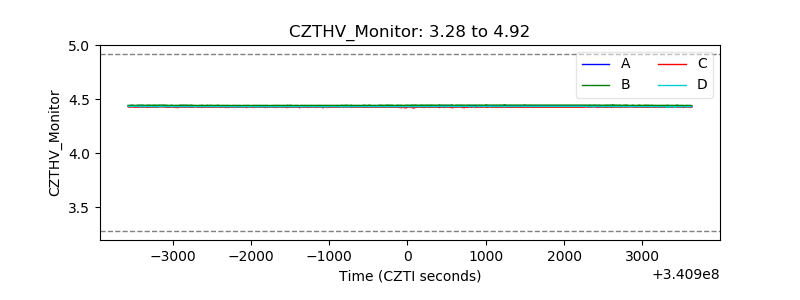 |
| D_VDD | 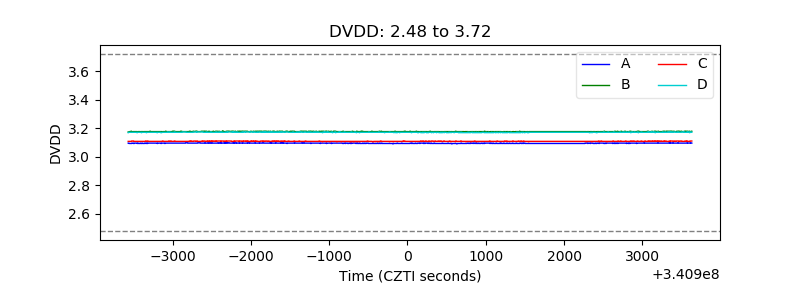 |
| Temperature 1 | 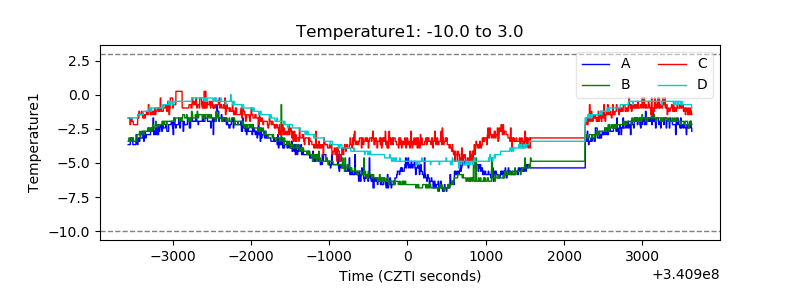 |
| Veto HV Monitor | 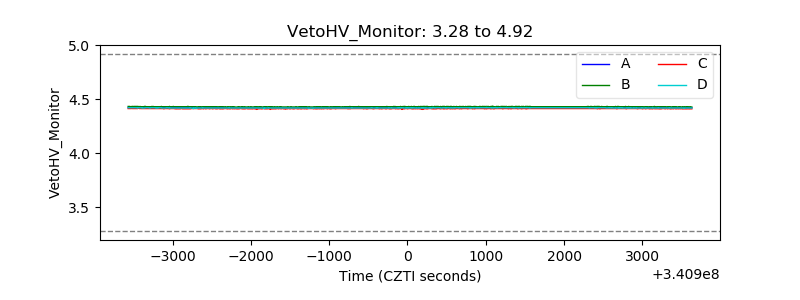 |
| Veto LLD | 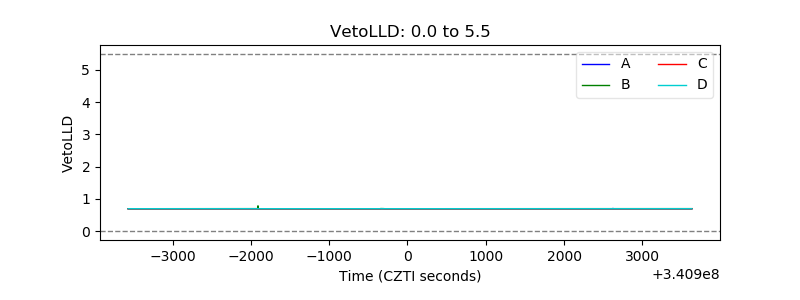 |
| Alpha Counter | 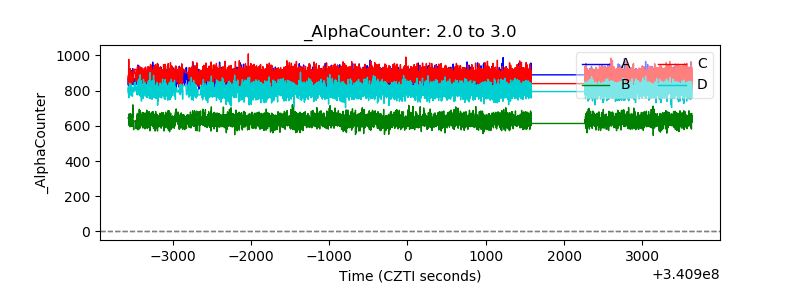 |
| _CPM_Rate | 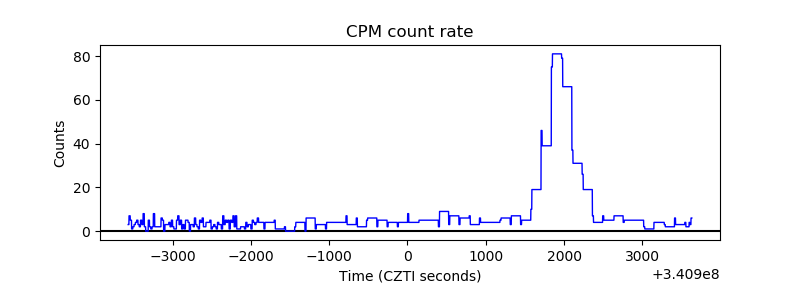 |
| CZT Counter | 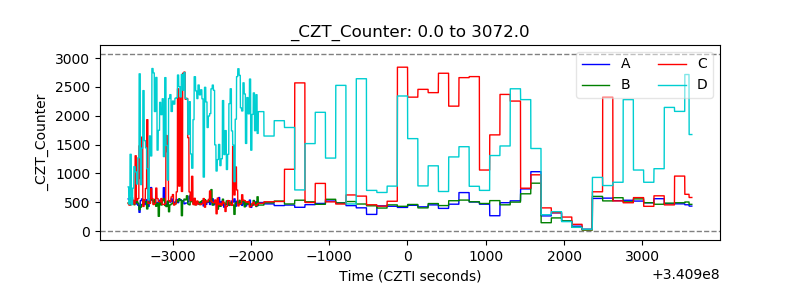 |
| +2.5 Volts monitor |  |
| +5 Volts monitor |  |
| _ROLL_ROT | 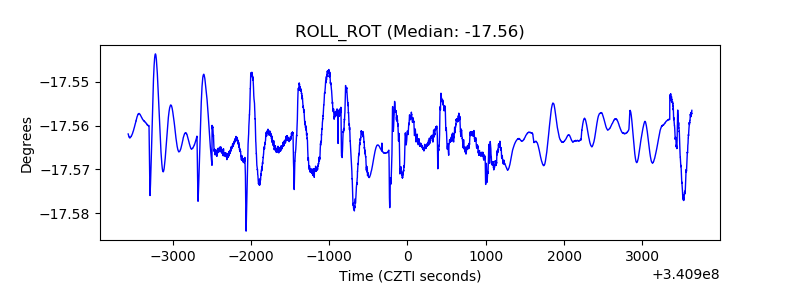 |
| _Roll_DEC | 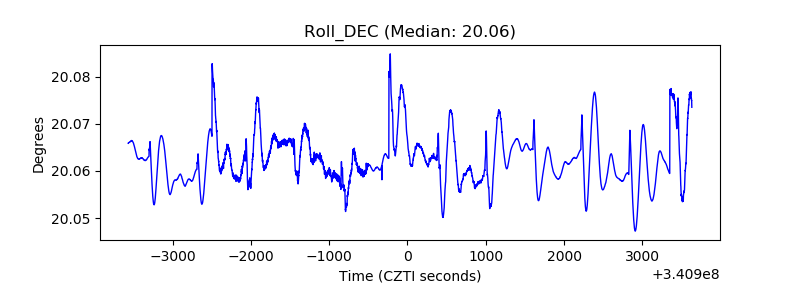 |
| _Roll_RA | 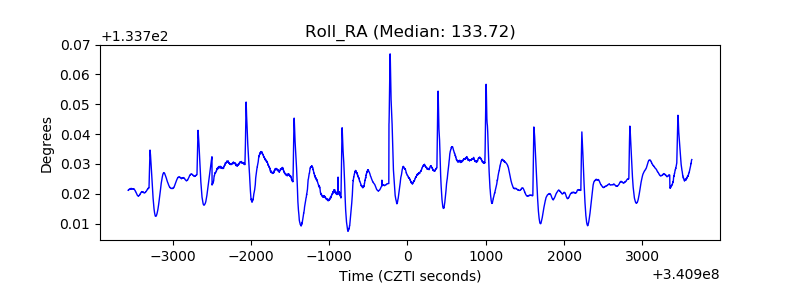 |
| Veto Counter | 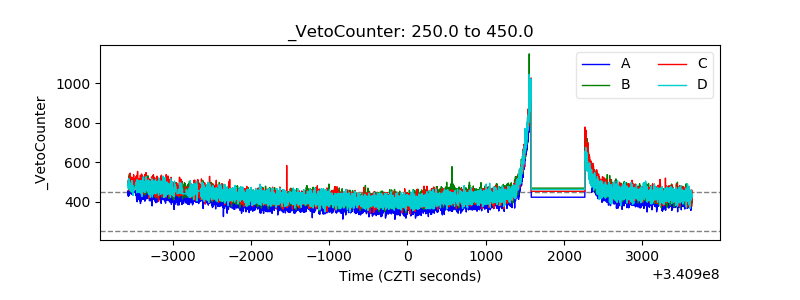 |