| Param | Original file | Final file |
|---|---|---|
| Filename | modeM0/AS1T03_249T01_9000003934_27376cztM0_level2.evt | modeM0/AS1T03_249T01_9000003934_27376cztM0_level2_quad_clean.evt |
| Size (bytes) | 1,390,363,200 | 135,961,920 |
| Size | 1.3 GB | 129.7 MB |
| Events in quadrant A | 6,327,934 | 890,936 |
| Events in quadrant B | 6,421,112 | 883,625 |
| Events in quadrant C | 12,565,575 | 658,329 |
| Events in quadrant D | 15,929,364 | 797,260 |
| Mode M0 | |||
|---|---|---|---|
| Quadrant | BADHDUFLAG | Total packets | Discarded packets |
| A | 0 | 26574 | 0 |
| B | 0 | 26789 | 0 |
| C | 0 | 45499 | 0 |
| D | 0 | 56166 | 0 |
| Mode M9 | |||
|---|---|---|---|
| Quadrant | BADHDUFLAG | Total packets | Discarded packets |
| A | 0 | 10 | 0 |
| B | 0 | 10 | 0 |
| C | 0 | 10 | 0 |
| D | 0 | 10 | 0 |
| Quadrant | Total seconds | Saturated seconds | Saturation percentage |
|---|---|---|---|
| A | 12818 | 230 | 1.794352% |
| B | 12818 | 253 | 1.973787% |
| C | 12819 | 2998 | 23.387160% |
| D | 12818 | 2582 | 20.143548% |
Noise dominated data is calculated using 1-second bins in cleaned event files. If a bin has >2000 counts, and if more than 50% of those come from <1% of pixels, then it is considered to be noise-dominated and hence unusable.
| Quadrant | # 1 sec bins | Bins with >0 counts | Bins with >2000 counts | High rate bins dominated by noise | Noise dominated (total time) | Noise dominated (detector-on time) | Marked lightcurve |
|---|---|---|---|---|---|---|---|
| A | 13838 | 12819 | 0 | 0 | 0.00% | 0.00% |  |
| B | 13839 | 12819 | 8 | 8 | 0.06% | 0.06% |  |
| C | 13838 | 12818 | 2298 | 2298 | 16.61% | 17.93% |  |
| D | 13838 | 12819 | 2203 | 2203 | 15.92% | 17.19% |  |
Top three noisy pixels from each quadrant. If the there are fewer than three noisy pixels in the level2.evt file, extra rows are filled as -1
| Pixel properties | Quadrant properties | ||||||
|---|---|---|---|---|---|---|---|
| Quadrant | DetID | PixID | Counts | Sigma | Mean | Median | Sigma |
| A | 13 | 254 | 21977 | 62.17 | 1630 | 1600 | 327.8 |
| A | 12 | 96 | 16939 | 46.8 | 1630 | 1600 | 327.8 |
| A | 12 | 189 | 16426 | 45.23 | 1630 | 1600 | 327.8 |
| B | 15 | 32 | 58494 | 186.22 | 1601 | 1561 | 305.7 |
| B | 12 | 111 | 37849 | 118.69 | 1601 | 1561 | 305.7 |
| B | 11 | 111 | 33582 | 104.73 | 1601 | 1561 | 305.7 |
| C | 2 | 16 | 7066427 | 22326.77 | 1349 | 1357 | 316.4 |
| C | 14 | 238 | 212023 | 665.74 | 1349 | 1357 | 316.4 |
| C | 0 | 207 | 18174 | 53.14 | 1349 | 1357 | 316.4 |
| D | 1 | 52 | 9470395 | 26988.79 | 1470 | 1437 | 350.8 |
| D | 12 | 227 | 388778 | 1104.01 | 1470 | 1437 | 350.8 |
| D | 2 | 250 | 360052 | 1022.14 | 1470 | 1437 | 350.8 |
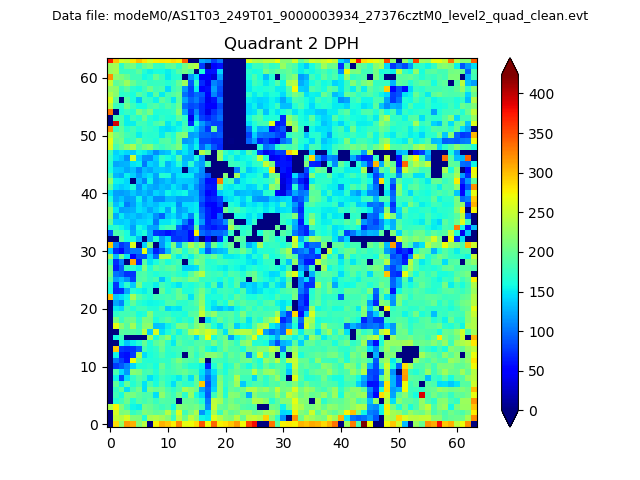
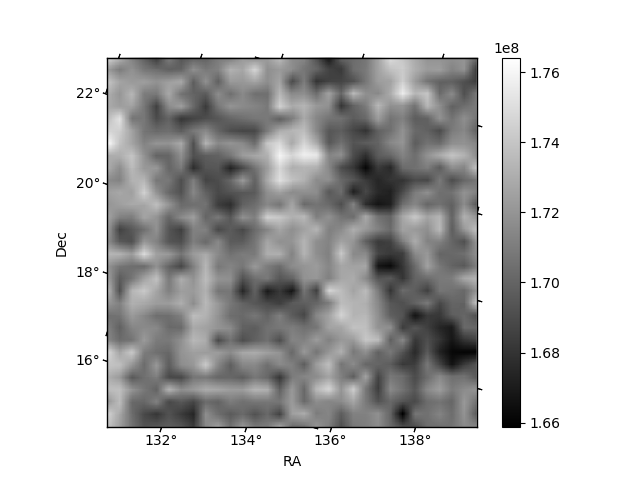
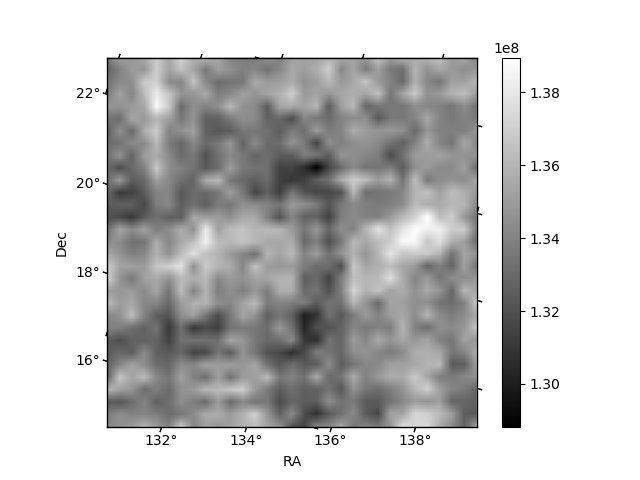
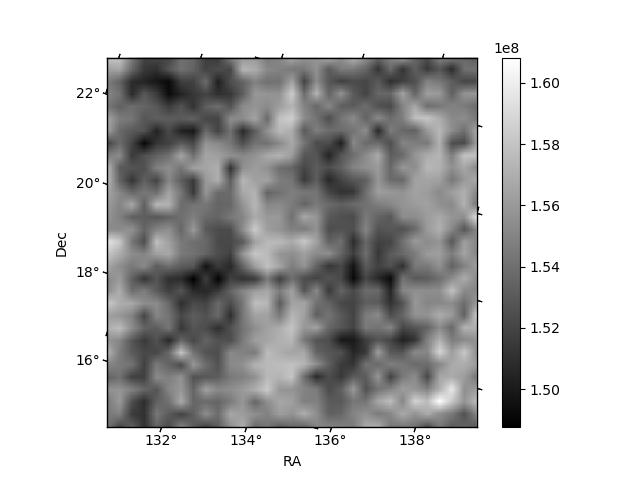
Histogram calculated using DETX and DETY for each event in the final _common_clean file
| Quadrant A |  |
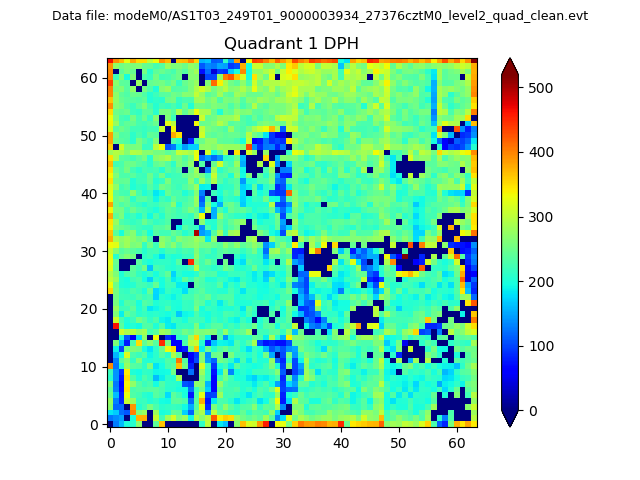 |
Quadrant B |
|---|---|---|---|
| Quadrant D | 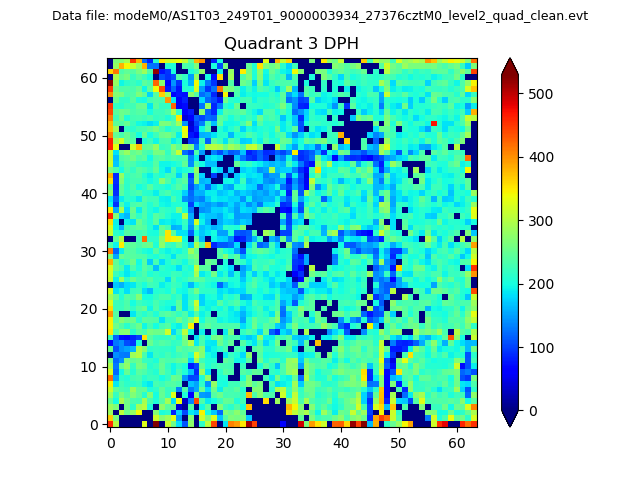 |
 |
Quadrant C |
| Plot type | Count rate plots | Images |
|---|---|---|
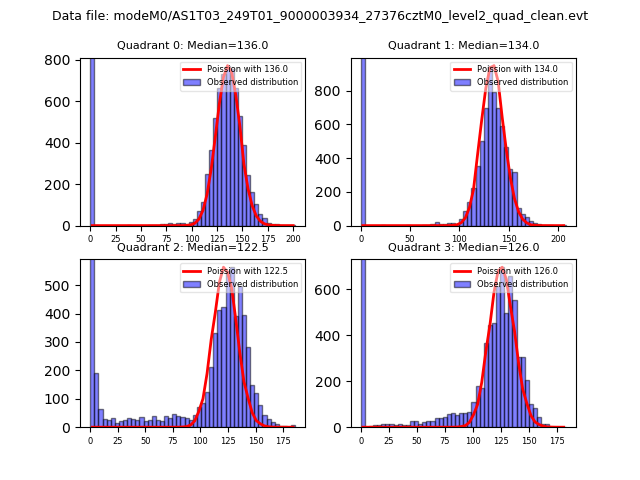
| Comparison with Poisson distribution Blue bars denote a histogram of data divided into 1 sec bins. Red curve is a Poisson curve with rate = median count rate of data. |
 |
 |
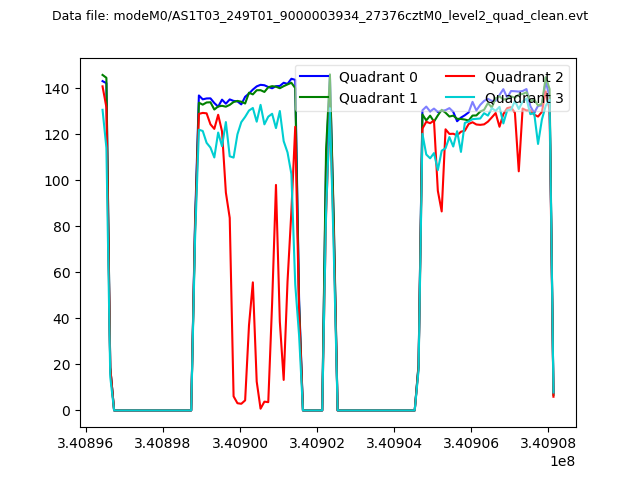
| Quadrant-wise count rates Data is divided into 100 sec bins |
 |
|
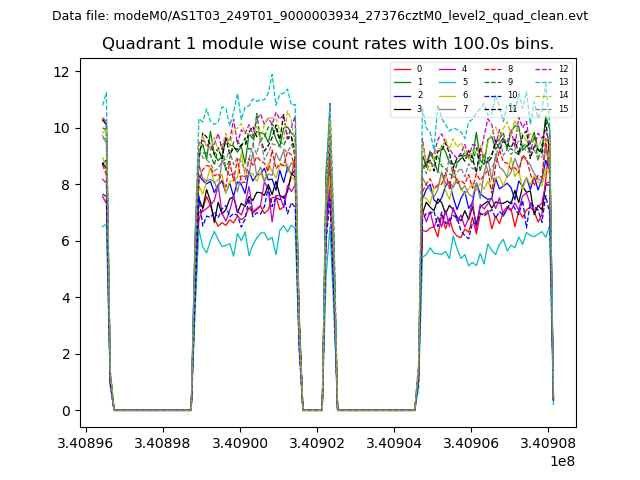
| Module-wise count rates for Quadrant A Data is divided into 100 sec bins |
 |
 |
| Module-wise count rates for Quadrant B Data is divided into 100 sec bins |
 |
 |
| Module-wise count rates for Quadrant C Data is divided into 100 sec bins |
 |
 |
| Module-wise count rates for Quadrant D Data is divided into 100 sec bins |
 |
 |
| Parameter | Plot |
|---|---|
| CZT HV Monitor | 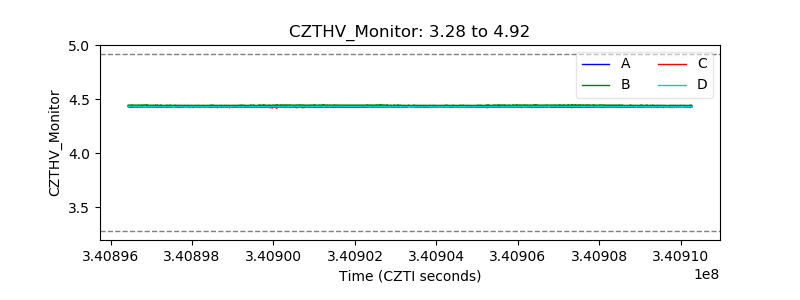 |
| D_VDD | 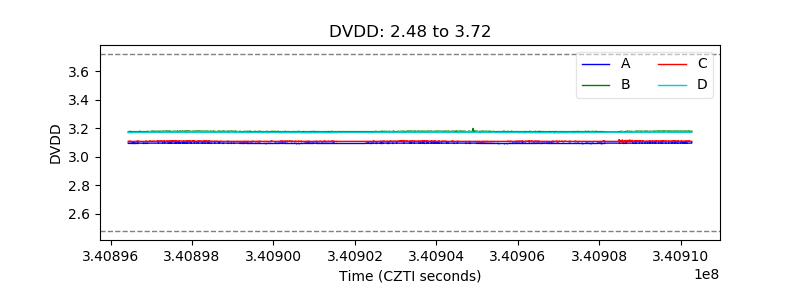 |
| Temperature 1 | 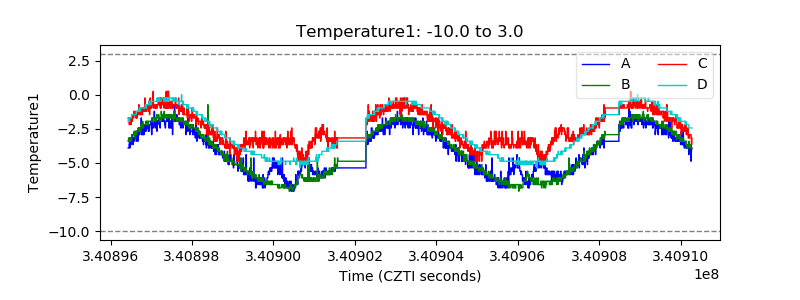 |
| Veto HV Monitor |  |
| Veto LLD | 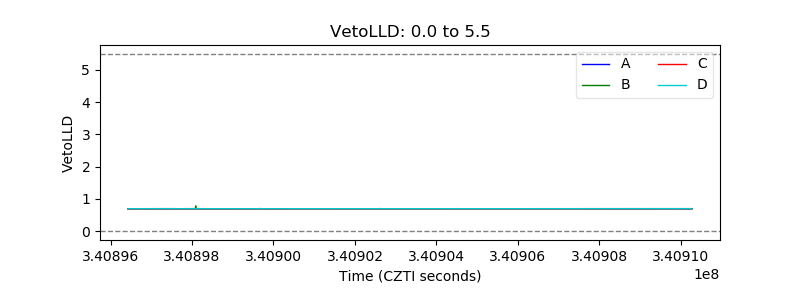 |
| Alpha Counter | 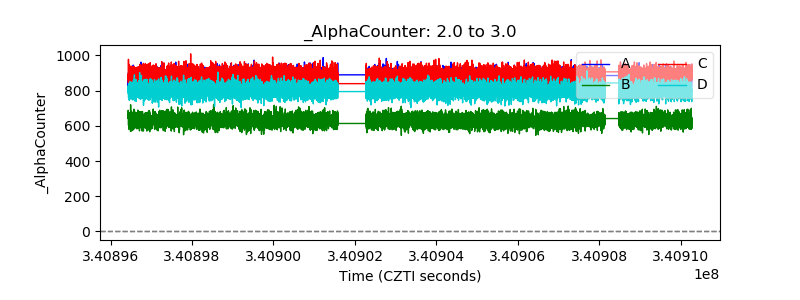 |
| _CPM_Rate | 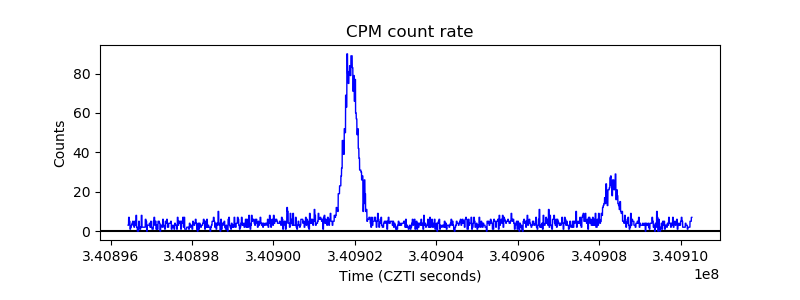 |
| CZT Counter | 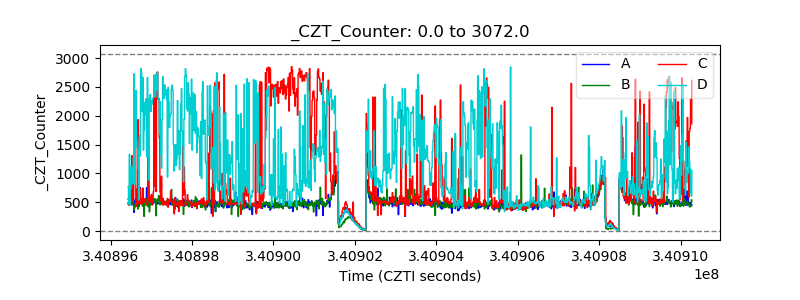 |
| +2.5 Volts monitor | 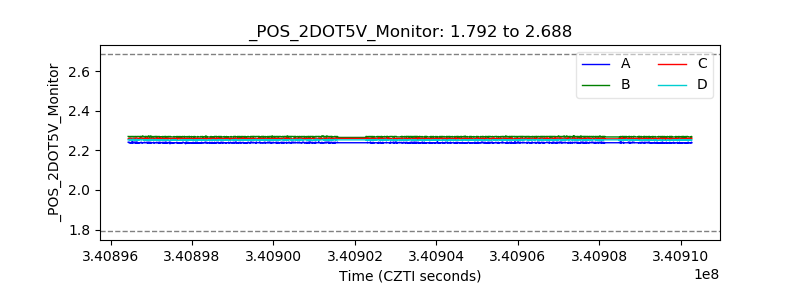 |
| +5 Volts monitor |  |
| _ROLL_ROT | 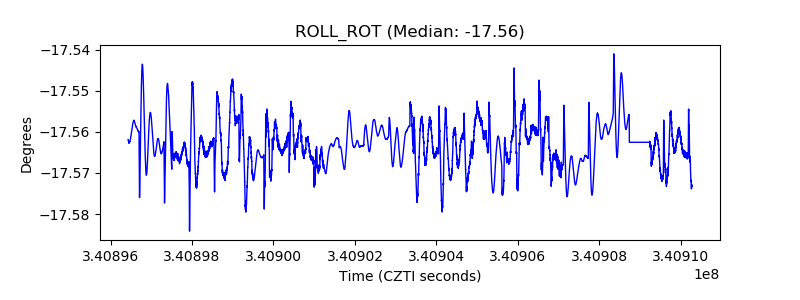 |
| _Roll_DEC |  |
| _Roll_RA | 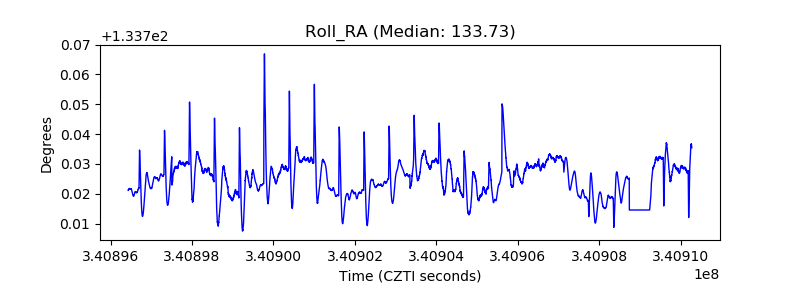 |
| Veto Counter | 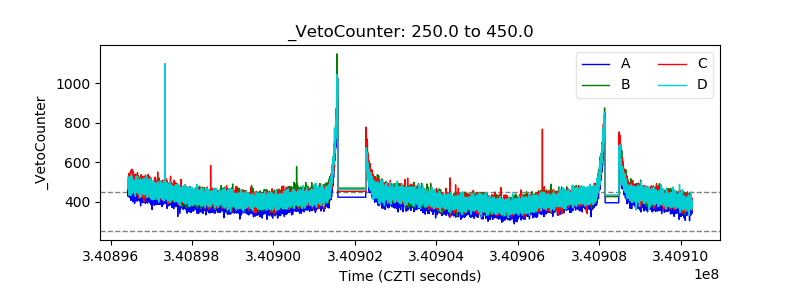 |