| Param | Original file | Final file |
|---|---|---|
| Filename | modeM0/AS1T03_249T01_9000003934_27377cztM0_level2.evt | modeM0/AS1T03_249T01_9000003934_27377cztM0_level2_quad_clean.evt |
| Size (bytes) | 37,788,480 | 9,472,320 |
| Size | 36.0 MB | 9.0 MB |
| Events in quadrant A | 277,204 | 56,453 |
| Events in quadrant B | 284,108 | 56,654 |
| Events in quadrant C | 252,782 | 49,864 |
| Events in quadrant D | 262,207 | 50,072 |
| Mode M0 | |||
|---|---|---|---|
| Quadrant | BADHDUFLAG | Total packets | Discarded packets |
| A | 0 | 1247 | 0 |
| B | 0 | 1279 | 0 |
| C | 0 | 1091 | 0 |
| D | 0 | 1113 | 0 |
| Mode M9 | |||
|---|---|---|---|
| Quadrant | BADHDUFLAG | Total packets | Discarded packets |
| A | 0 | 3 | 3 |
| B | 0 | 3 | 3 |
| C | 0 | 3 | 3 |
| D | 0 | 3 | 3 |
| Quadrant | Total seconds | Saturated seconds | Saturation percentage |
|---|---|---|---|
| A | 622 | 0 | 0.000000% |
| B | 638 | 2 | 0.313480% |
| C | 505 | 10 | 1.980198% |
| D | 480 | 3 | 0.625000% |
Noise dominated data is calculated using 1-second bins in cleaned event files. If a bin has >2000 counts, and if more than 50% of those come from <1% of pixels, then it is considered to be noise-dominated and hence unusable.
| Quadrant | # 1 sec bins | Bins with >0 counts | Bins with >2000 counts | High rate bins dominated by noise | Noise dominated (total time) | Noise dominated (detector-on time) | Marked lightcurve |
|---|---|---|---|---|---|---|---|
| A | 7674 | 1021 | 0 | 0 | 0.00% | 0.00% | 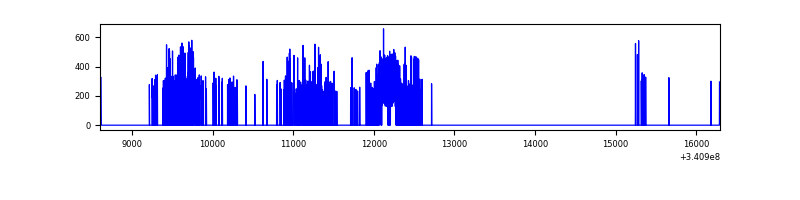 |
| B | 6439 | 1034 | 0 | 0 | 0.00% | 0.00% | 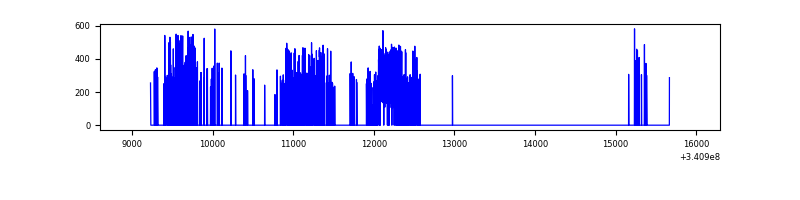 |
| C | 7682 | 802 | 1 | 1 | 0.01% | 0.12% | 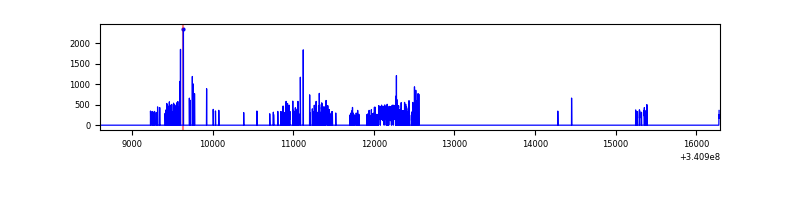 |
| D | 7034 | 769 | 3 | 3 | 0.04% | 0.39% | 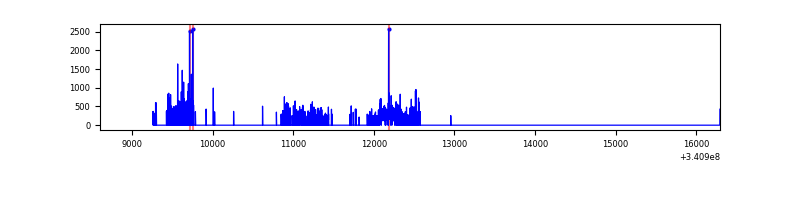 |
Top three noisy pixels from each quadrant. If the there are fewer than three noisy pixels in the level2.evt file, extra rows are filled as -1
| Pixel properties | Quadrant properties | ||||||
|---|---|---|---|---|---|---|---|
| Quadrant | DetID | PixID | Counts | Sigma | Mean | Median | Sigma |
| A | 12 | 189 | 1194 | 67.89 | 71 | 69 | 16.6 |
| A | 13 | 254 | 1154 | 65.47 | 71 | 69 | 16.6 |
| A | 3 | 137 | 655 | 35.36 | 71 | 69 | 16.6 |
| B | 12 | 111 | 1601 | 94.26 | 72 | 70 | 16.2 |
| B | 11 | 111 | 1494 | 87.68 | 72 | 70 | 16.2 |
| B | 14 | 111 | 1297 | 75.55 | 72 | 70 | 16.2 |
| C | 2 | 16 | 33937 | 2287.25 | 53 | 53 | 14.8 |
| C | 14 | 238 | 9287 | 623.32 | 53 | 53 | 14.8 |
| C | 13 | 61 | 342 | 19.51 | 53 | 53 | 14.8 |
| D | 1 | 52 | 35556 | 2503.02 | 51 | 49 | 14.2 |
| D | 12 | 227 | 15481 | 1087.86 | 51 | 49 | 14.2 |
| D | 2 | 250 | 13105 | 920.36 | 51 | 49 | 14.2 |
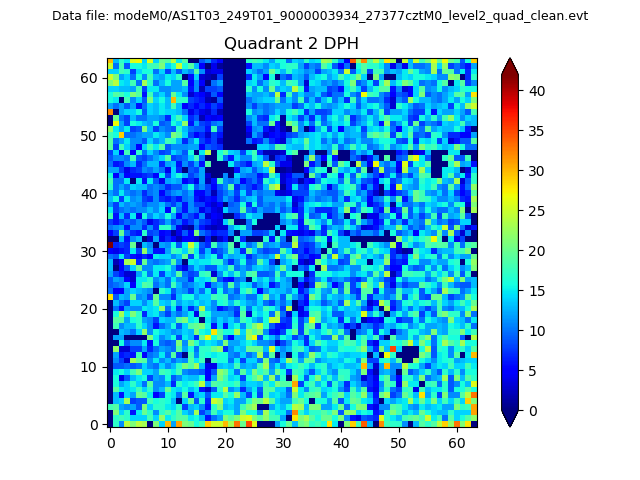
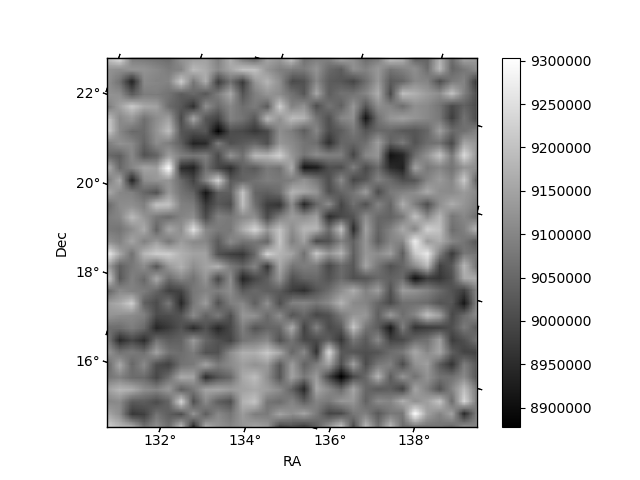
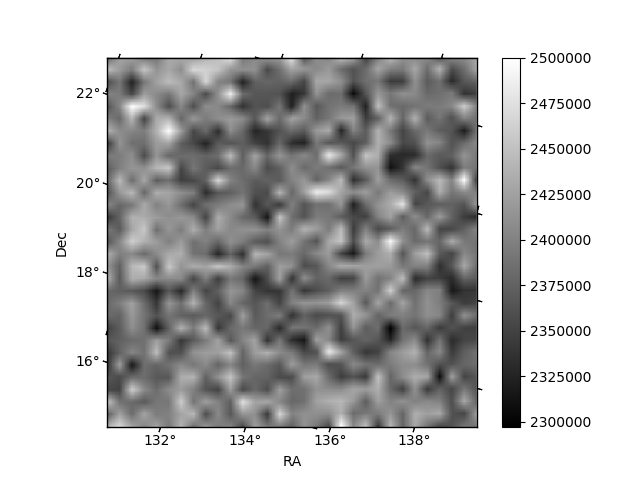
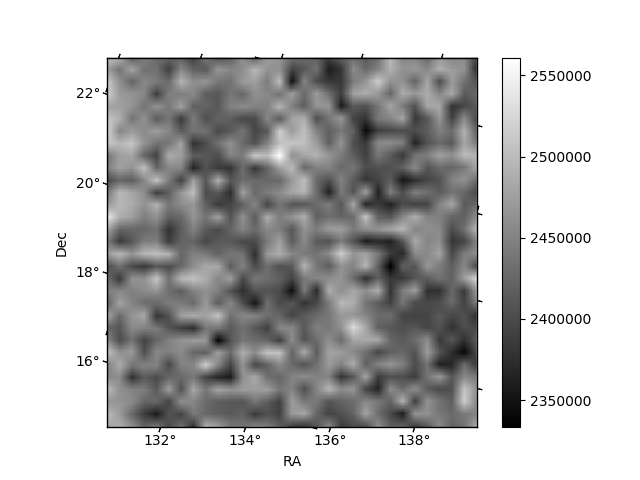
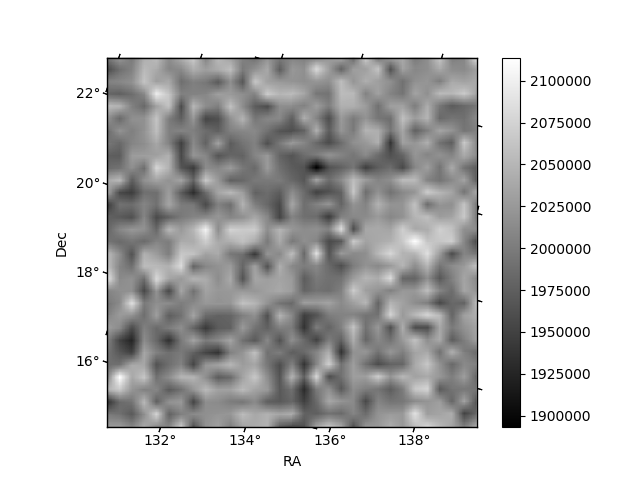
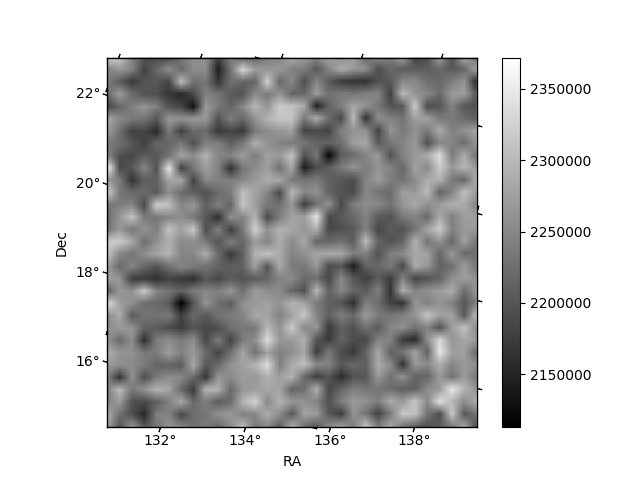
Histogram calculated using DETX and DETY for each event in the final _common_clean file
| Quadrant A | 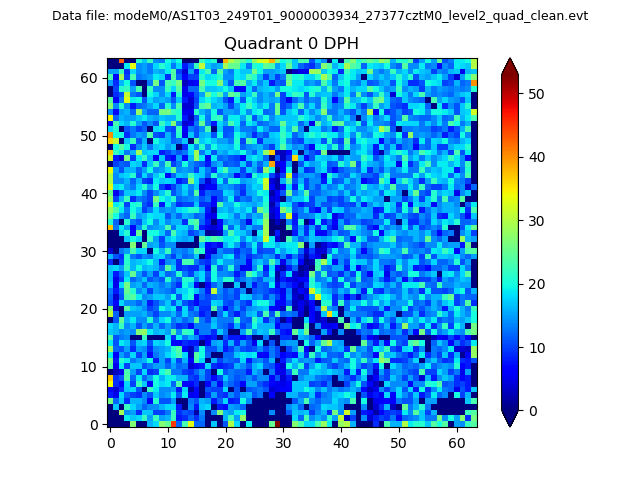 |
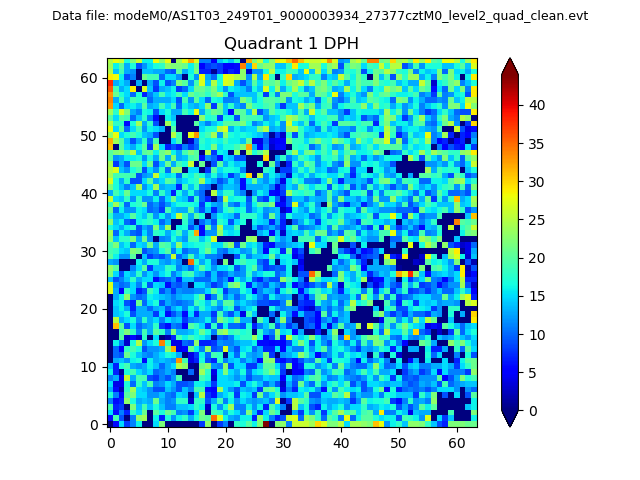 |
Quadrant B |
|---|---|---|---|
| Quadrant D | 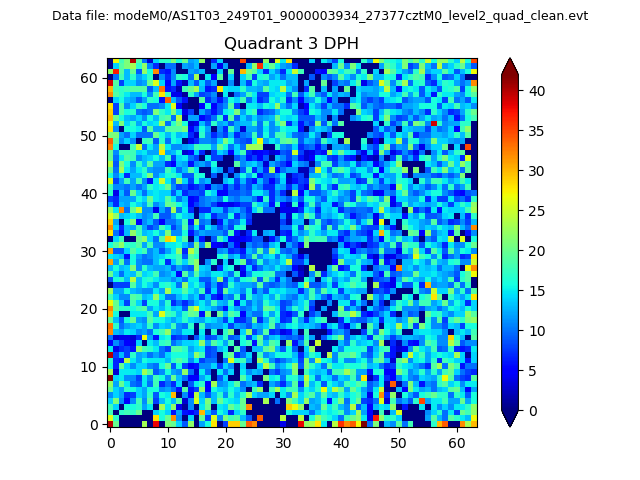 |
 |
Quadrant C |
| Plot type | Count rate plots | Images |
|---|---|---|
| Comparison with Poisson distribution Blue bars denote a histogram of data divided into 1 sec bins. Red curve is a Poisson curve with rate = median count rate of data. |
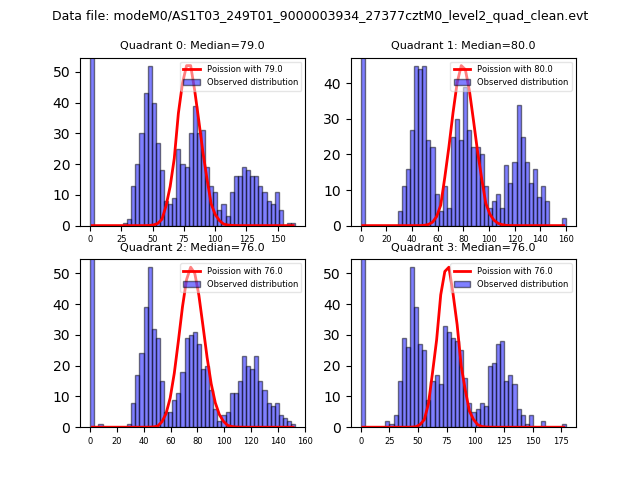 |
 |
| Quadrant-wise count rates Data is divided into 100 sec bins |
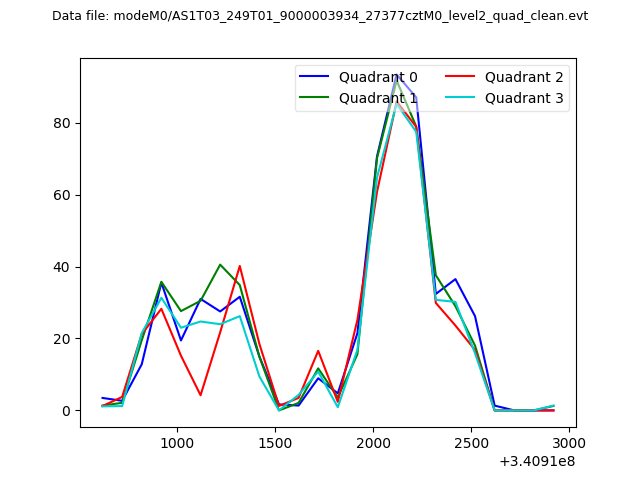 |
|
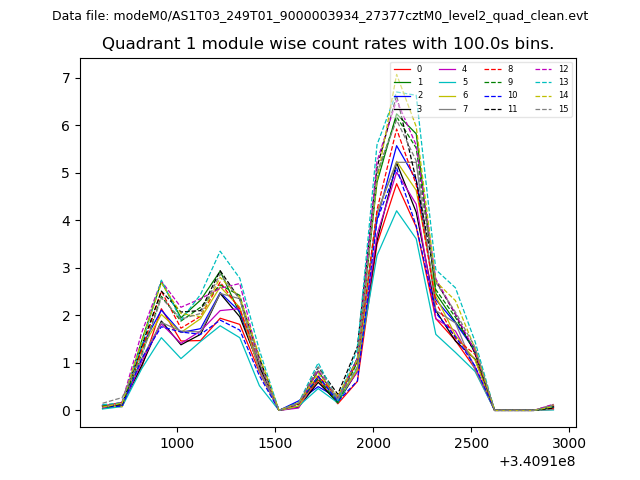
| Module-wise count rates for Quadrant A Data is divided into 100 sec bins |
 |
 |
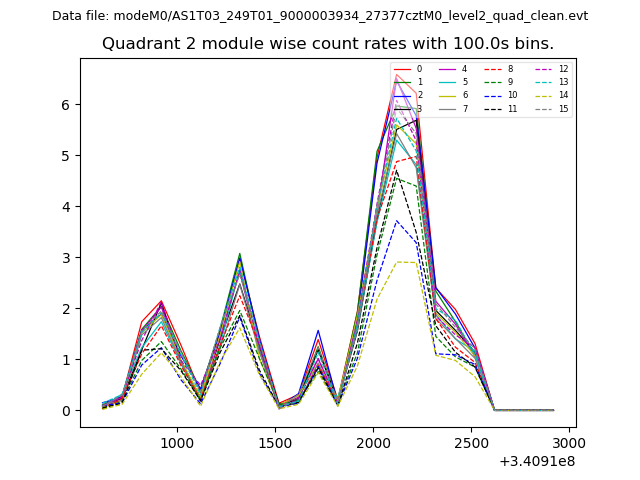
| Module-wise count rates for Quadrant B Data is divided into 100 sec bins |
 |
 |
| Module-wise count rates for Quadrant C Data is divided into 100 sec bins |
 |
 |
| Module-wise count rates for Quadrant D Data is divided into 100 sec bins |
 |
 |
| Parameter | Plot |
|---|---|
| CZT HV Monitor |  |
| D_VDD | 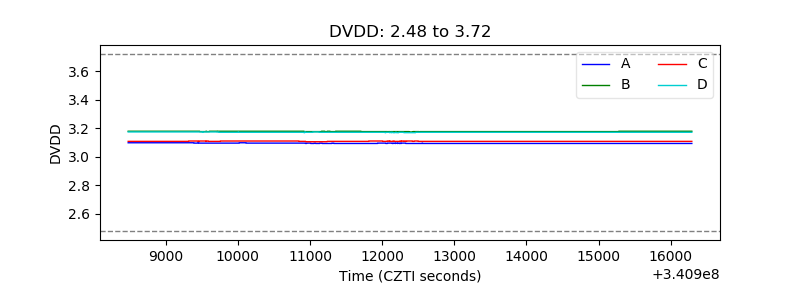 |
| Temperature 1 | 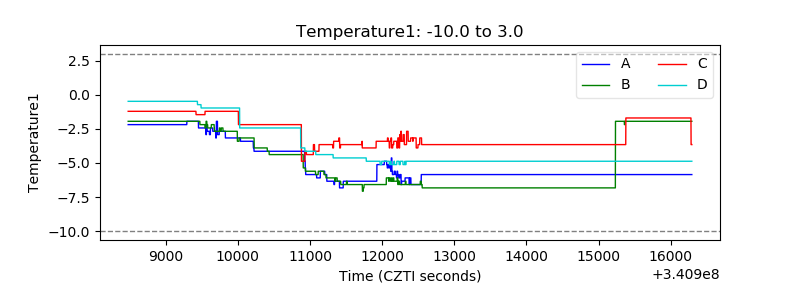 |
| Veto HV Monitor | 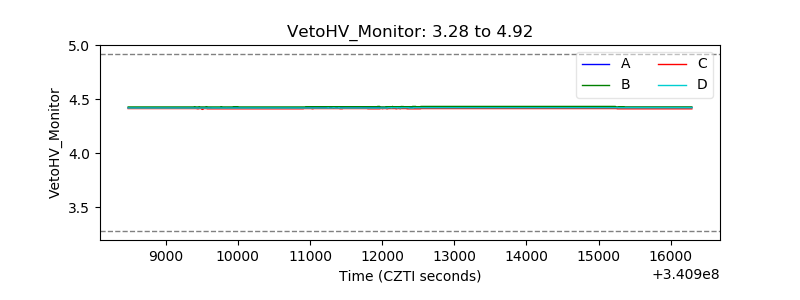 |
| Veto LLD | 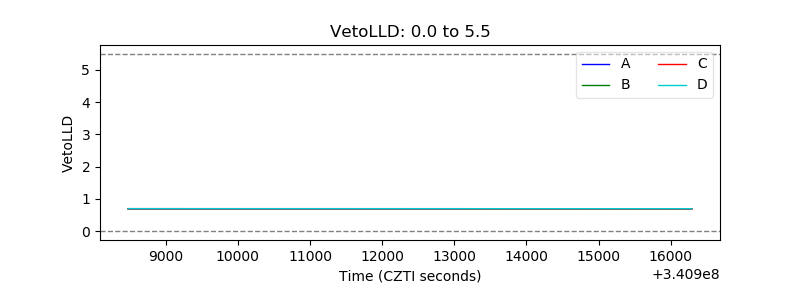 |
| Alpha Counter | 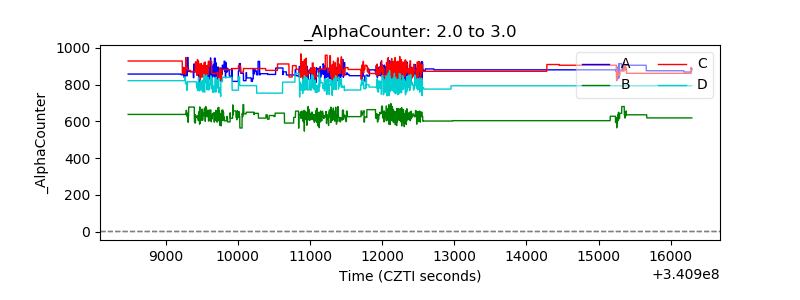 |
| _CPM_Rate | 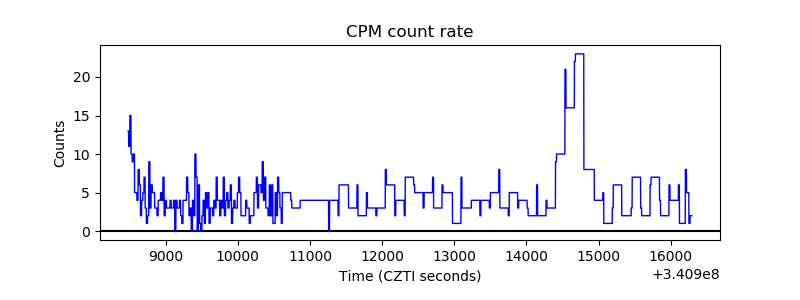 |
| CZT Counter | 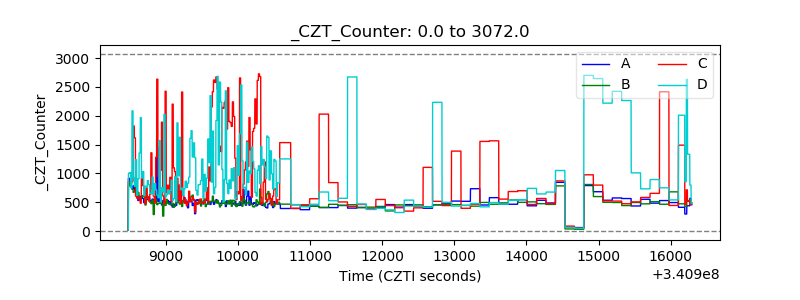 |
| +2.5 Volts monitor |  |
| +5 Volts monitor |  |
| _ROLL_ROT | 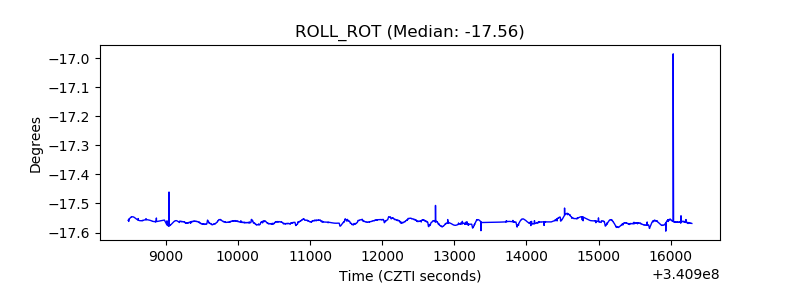 |
| _Roll_DEC | 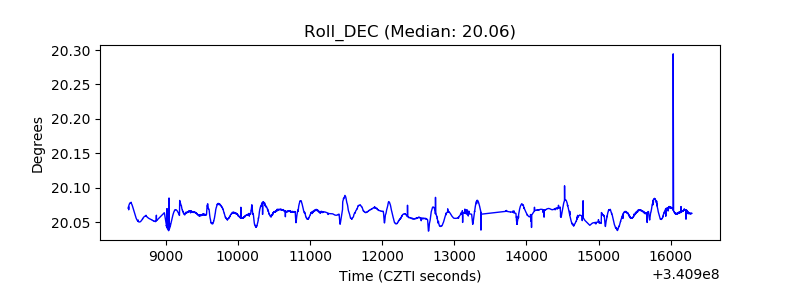 |
| _Roll_RA | 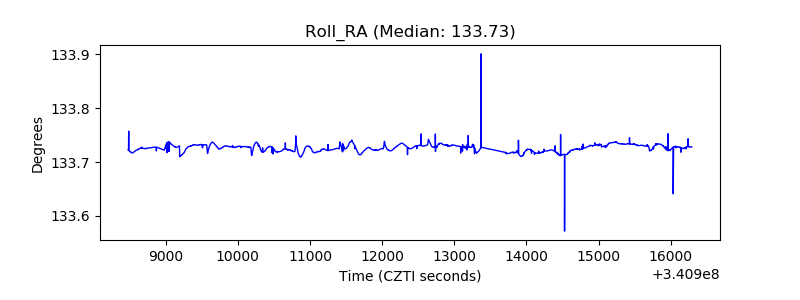 |
| Veto Counter | 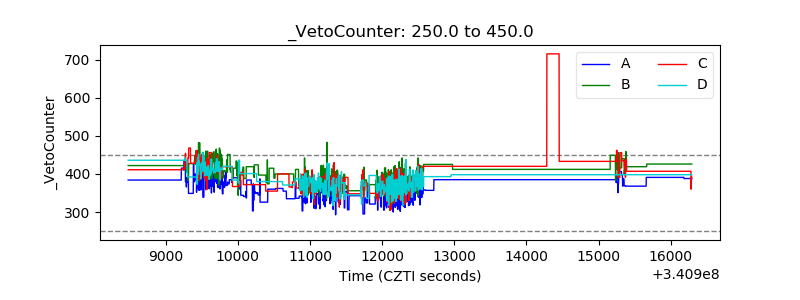 |