| Param | Original file | Final file |
|---|---|---|
| Filename | modeM0/AS1T03_249T01_9000003934_27381cztM0_level2.evt | modeM0/AS1T03_249T01_9000003934_27381cztM0_level2_quad_clean.evt |
| Size (bytes) | 988,620,480 | 120,689,280 |
| Size | 942.8 MB | 115.1 MB |
| Events in quadrant A | 4,619,725 | 816,185 |
| Events in quadrant B | 4,711,042 | 809,779 |
| Events in quadrant C | 11,244,273 | 591,658 |
| Events in quadrant D | 8,699,248 | 752,418 |
| Mode M0 | |||
|---|---|---|---|
| Quadrant | BADHDUFLAG | Total packets | Discarded packets |
| A | 0 | 20226 | 0 |
| B | 0 | 20495 | 0 |
| C | 0 | 40182 | 0 |
| D | 0 | 32901 | 0 |
| Mode M9 | |||
|---|---|---|---|
| Quadrant | BADHDUFLAG | Total packets | Discarded packets |
| A | 0 | 11 | 0 |
| B | 0 | 11 | 0 |
| C | 0 | 11 | 0 |
| D | 0 | 11 | 0 |
| Quadrant | Total seconds | Saturated seconds | Saturation percentage |
|---|---|---|---|
| A | 9866 | 54 | 0.547334% |
| B | 9867 | 90 | 0.912131% |
| C | 9867 | 2924 | 29.634134% |
| D | 9867 | 771 | 7.813925% |
Noise dominated data is calculated using 1-second bins in cleaned event files. If a bin has >2000 counts, and if more than 50% of those come from <1% of pixels, then it is considered to be noise-dominated and hence unusable.
| Quadrant | # 1 sec bins | Bins with >0 counts | Bins with >2000 counts | High rate bins dominated by noise | Noise dominated (total time) | Noise dominated (detector-on time) | Marked lightcurve |
|---|---|---|---|---|---|---|---|
| A | 10941 | 9868 | 0 | 0 | 0.00% | 0.00% | 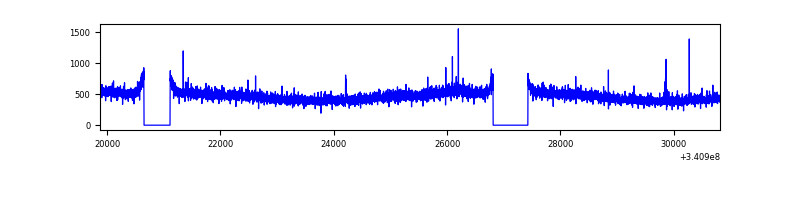 |
| B | 10942 | 9869 | 3 | 3 | 0.03% | 0.03% | 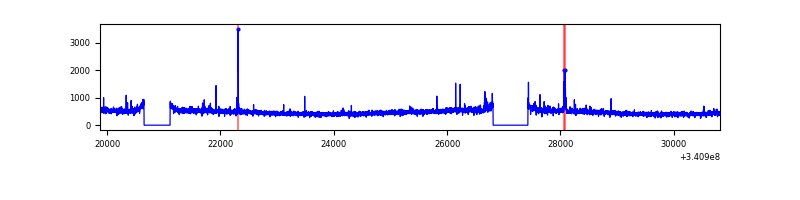 |
| C | 10942 | 9869 | 2397 | 2397 | 21.91% | 24.29% | 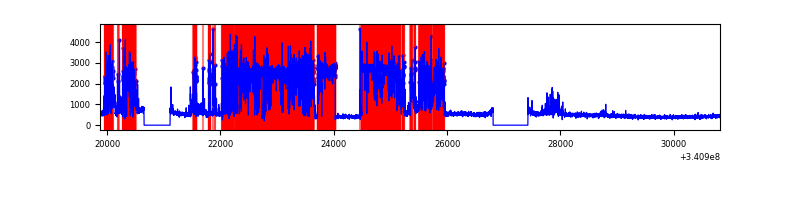 |
| D | 10942 | 9869 | 578 | 578 | 5.28% | 5.86% | 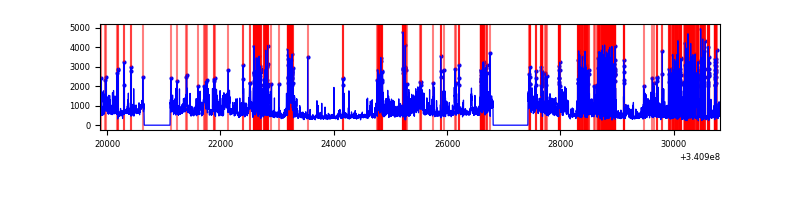 |
Top three noisy pixels from each quadrant. If the there are fewer than three noisy pixels in the level2.evt file, extra rows are filled as -1
| Pixel properties | Quadrant properties | ||||||
|---|---|---|---|---|---|---|---|
| Quadrant | DetID | PixID | Counts | Sigma | Mean | Median | Sigma |
| A | 13 | 254 | 17327 | 67.25 | 1191 | 1167 | 240.3 |
| A | 12 | 96 | 15222 | 58.49 | 1191 | 1167 | 240.3 |
| A | 3 | 137 | 11211 | 41.8 | 1191 | 1167 | 240.3 |
| B | 15 | 32 | 47695 | 206.48 | 1176 | 1143 | 225.4 |
| B | 12 | 111 | 28050 | 119.35 | 1176 | 1143 | 225.4 |
| B | 11 | 111 | 25101 | 106.27 | 1176 | 1143 | 225.4 |
| C | 2 | 16 | 7236550 | 31925.61 | 960 | 964 | 226.6 |
| C | 14 | 238 | 152028 | 666.54 | 960 | 964 | 226.6 |
| C | 15 | 208 | 107230 | 468.88 | 960 | 964 | 226.6 |
| D | 1 | 52 | 3010801 | 11233.84 | 1121 | 1095 | 267.9 |
| D | 12 | 227 | 854417 | 3185.06 | 1121 | 1095 | 267.9 |
| D | 2 | 250 | 498256 | 1855.67 | 1121 | 1095 | 267.9 |
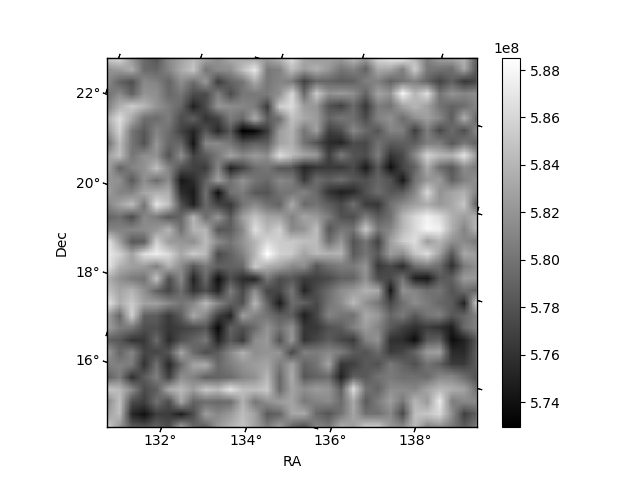
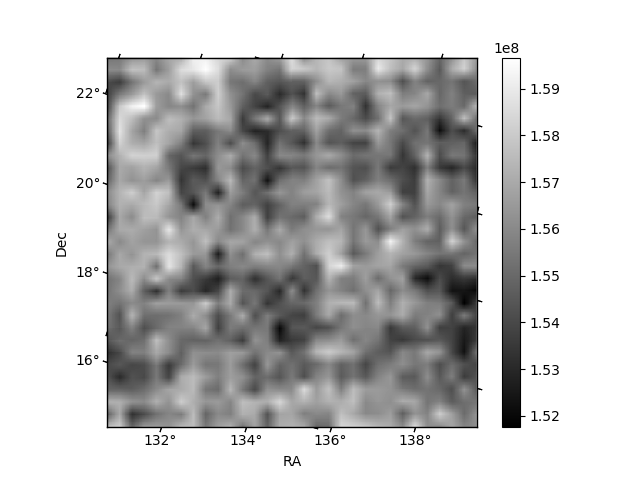
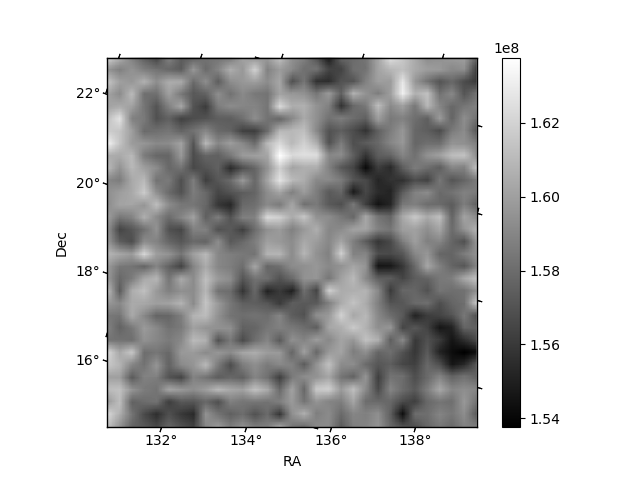
Histogram calculated using DETX and DETY for each event in the final _common_clean file
| Quadrant A | 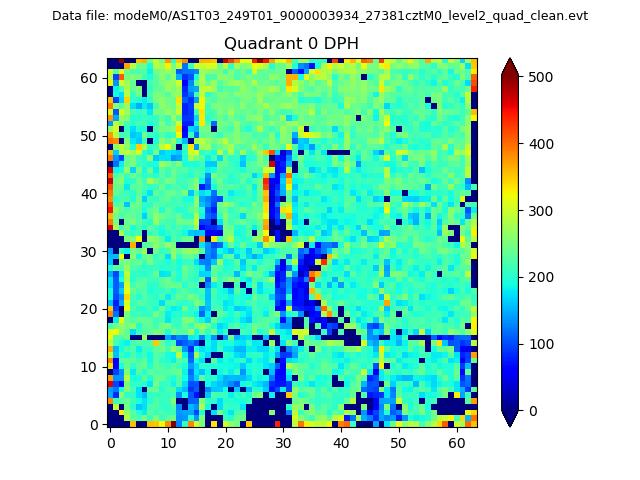 |
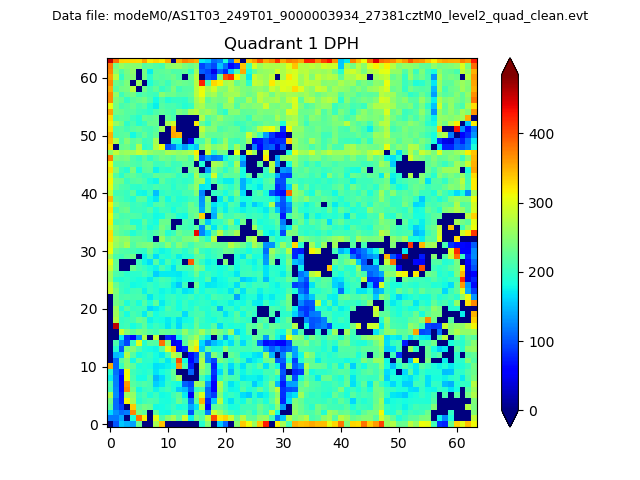 |
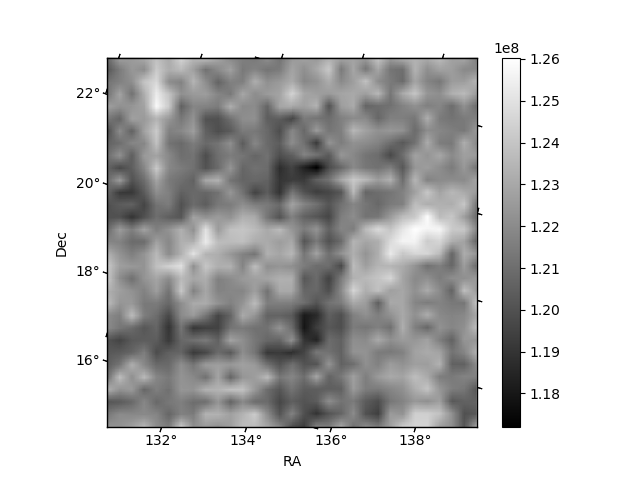
Quadrant B |
|---|---|---|---|
| Quadrant D | 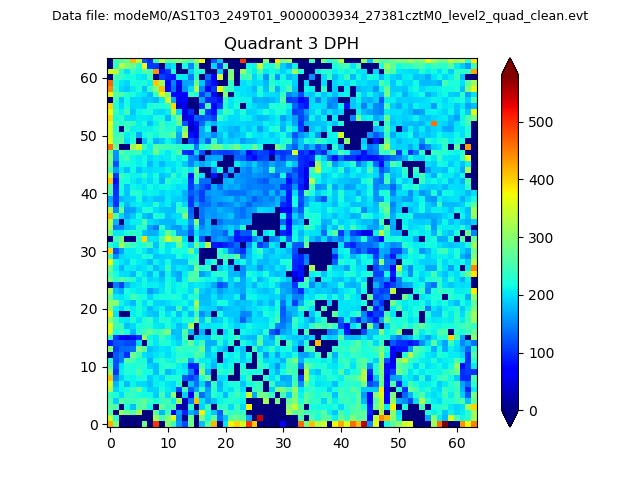 |
 |
Quadrant C |
| Plot type | Count rate plots | Images |
|---|---|---|
| Comparison with Poisson distribution Blue bars denote a histogram of data divided into 1 sec bins. Red curve is a Poisson curve with rate = median count rate of data. |
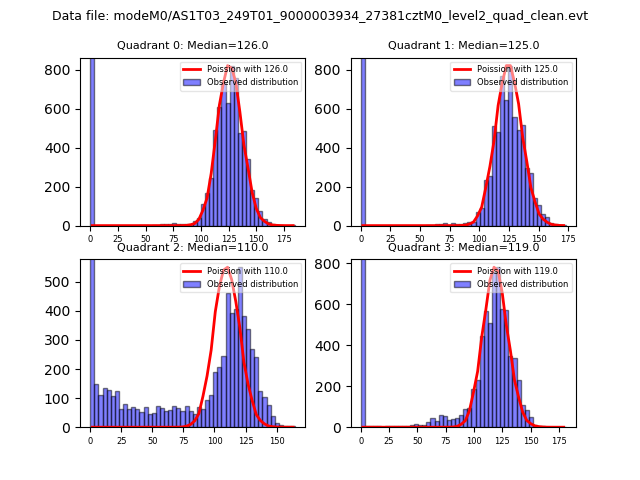 |
 |
| Quadrant-wise count rates Data is divided into 100 sec bins |
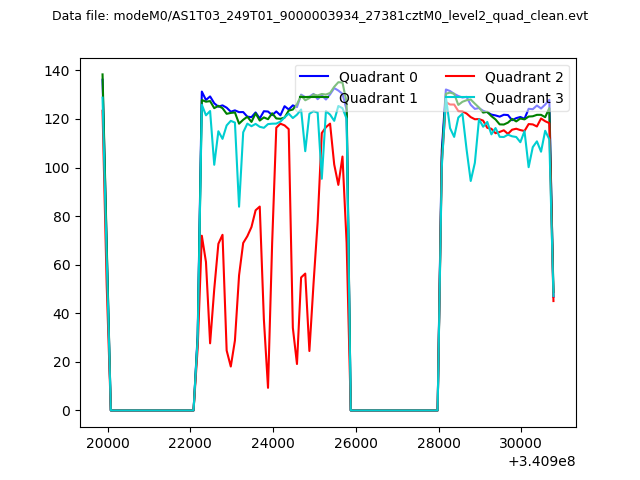 |
|
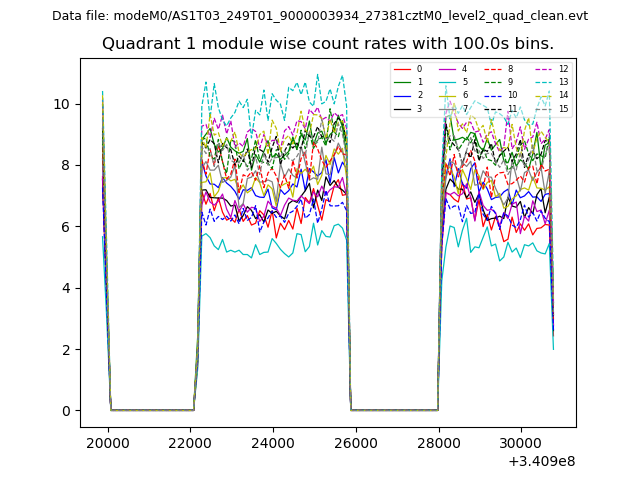
| Module-wise count rates for Quadrant A Data is divided into 100 sec bins |
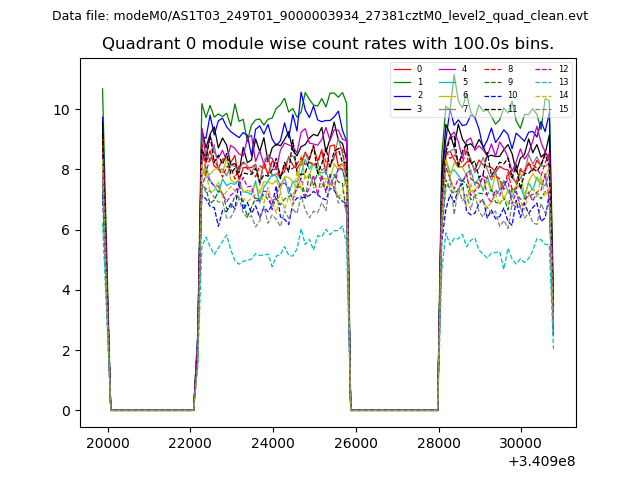 |
 |
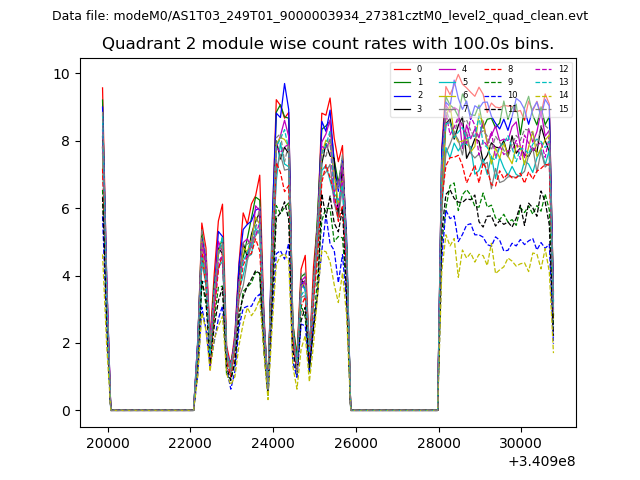
| Module-wise count rates for Quadrant B Data is divided into 100 sec bins |
 |
 |
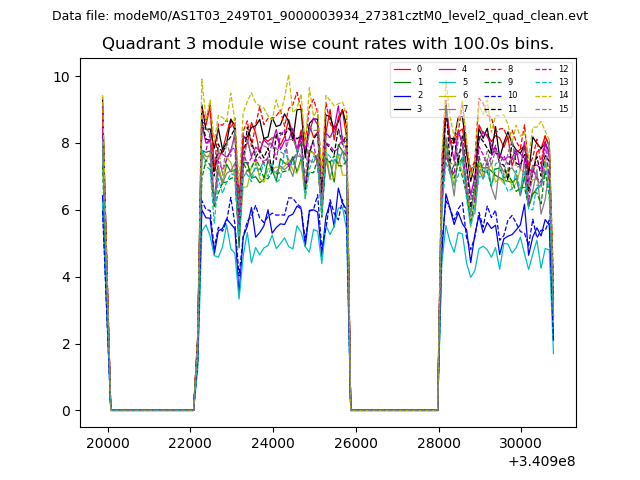
| Module-wise count rates for Quadrant C Data is divided into 100 sec bins |
 |
 |
| Module-wise count rates for Quadrant D Data is divided into 100 sec bins |
 |
 |
| Parameter | Plot |
|---|---|
| CZT HV Monitor | 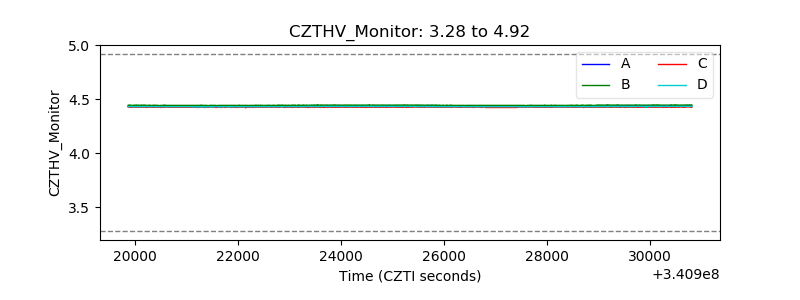 |
| D_VDD | 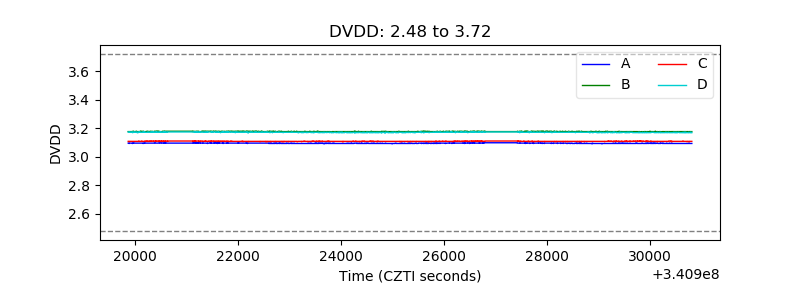 |
| Temperature 1 | 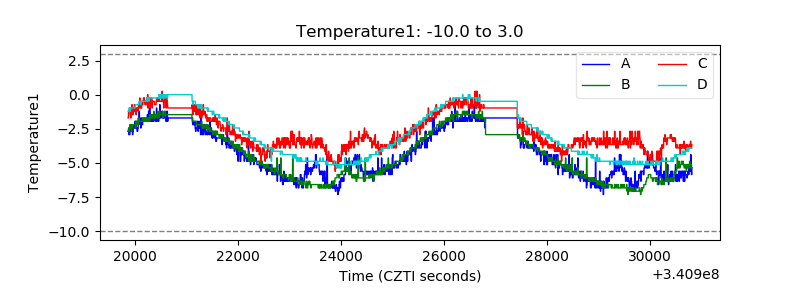 |
| Veto HV Monitor | 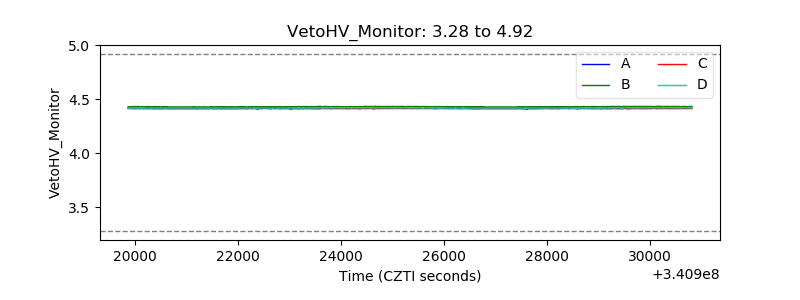 |
| Veto LLD | 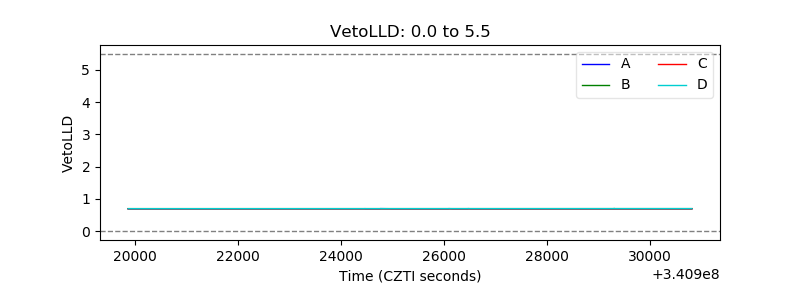 |
| Alpha Counter | 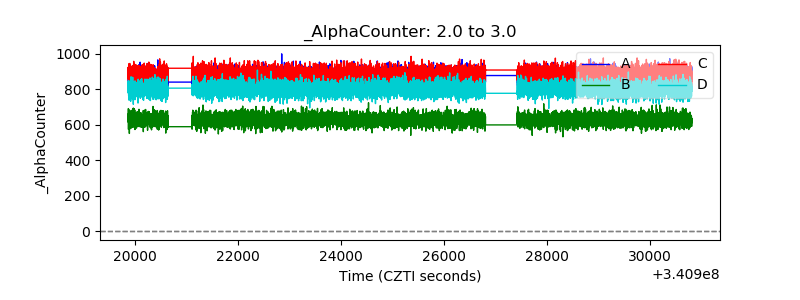 |
| _CPM_Rate | 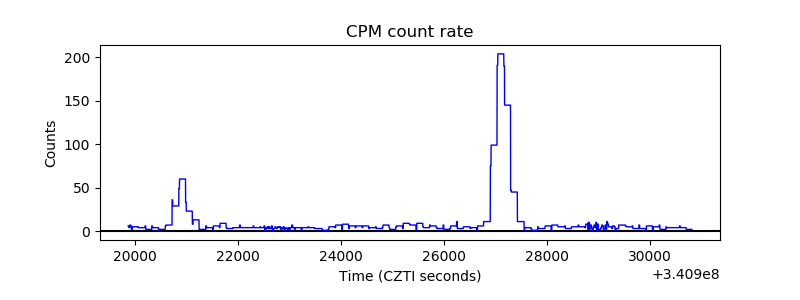 |
| CZT Counter | 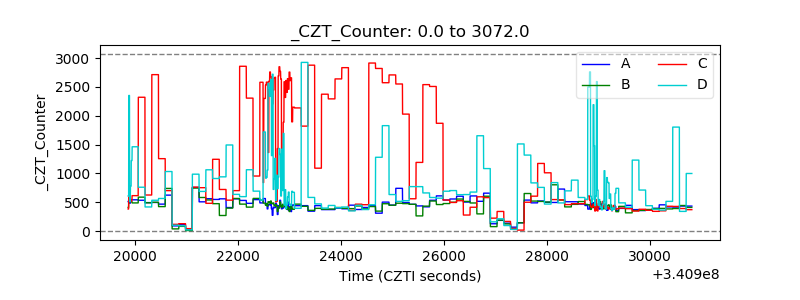 |
| +2.5 Volts monitor | 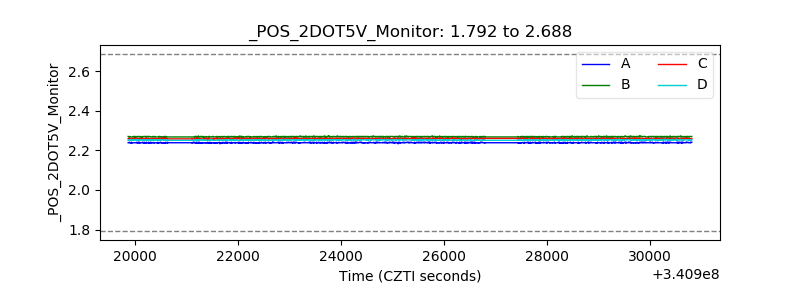 |
| +5 Volts monitor |  |
| _ROLL_ROT | 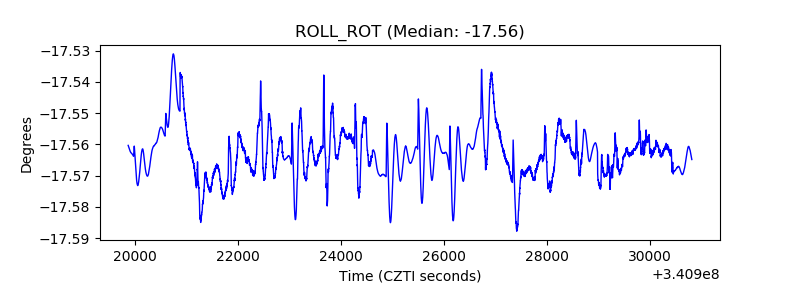 |
| _Roll_DEC |  |
| _Roll_RA | 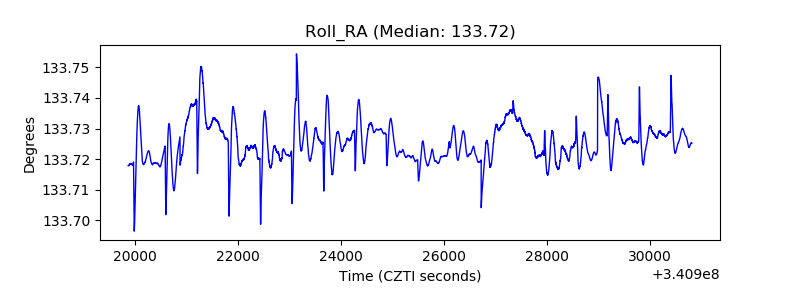 |
| Veto Counter | 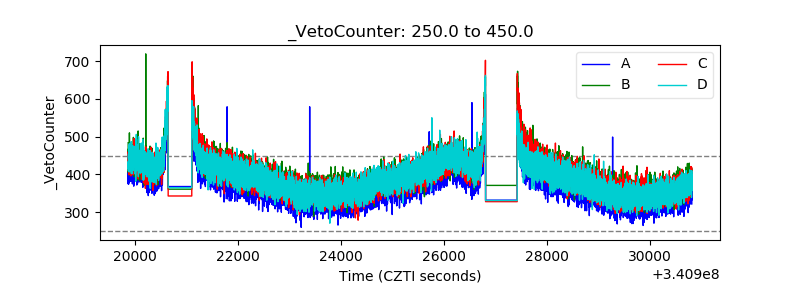 |