| Param | Original file | Final file |
|---|---|---|
| Filename | modeM0/AS1T03_249T01_9000003934_27384cztM0_level2.evt | modeM0/AS1T03_249T01_9000003934_27384cztM0_level2_quad_clean.evt |
| Size (bytes) | 2,855,963,520 | 447,816,960 |
| Size | 2.7 GB | 427.1 MB |
| Events in quadrant A | 15,712,054 | 2,964,558 |
| Events in quadrant B | 15,991,266 | 2,974,659 |
| Events in quadrant C | 22,976,392 | 2,637,257 |
| Events in quadrant D | 29,583,702 | 2,712,687 |
| Mode M0 | |||
|---|---|---|---|
| Quadrant | BADHDUFLAG | Total packets | Discarded packets |
| A | 0 | 68008 | 0 |
| B | 0 | 68838 | 0 |
| C | 0 | 89843 | 0 |
| D | 0 | 110847 | 0 |
| Mode M9 | |||
|---|---|---|---|
| Quadrant | BADHDUFLAG | Total packets | Discarded packets |
| A | 0 | 50 | 0 |
| B | 0 | 50 | 0 |
| C | 0 | 50 | 0 |
| D | 0 | 50 | 0 |
| Quadrant | Total seconds | Saturated seconds | Saturation percentage |
|---|---|---|---|
| A | 33089 | 139 | 0.420079% |
| B | 33088 | 254 | 0.767650% |
| C | 33090 | 3273 | 9.891206% |
| D | 33090 | 3920 | 11.846479% |
Noise dominated data is calculated using 1-second bins in cleaned event files. If a bin has >2000 counts, and if more than 50% of those come from <1% of pixels, then it is considered to be noise-dominated and hence unusable.
| Quadrant | # 1 sec bins | Bins with >0 counts | Bins with >2000 counts | High rate bins dominated by noise | Noise dominated (total time) | Noise dominated (detector-on time) | Marked lightcurve |
|---|---|---|---|---|---|---|---|
| A | 38069 | 33095 | 2 | 2 | 0.01% | 0.01% | 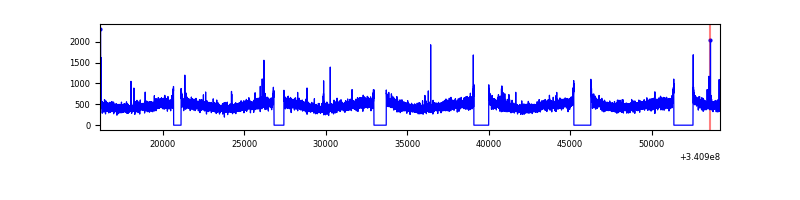 |
| B | 38069 | 33095 | 7 | 7 | 0.02% | 0.02% | 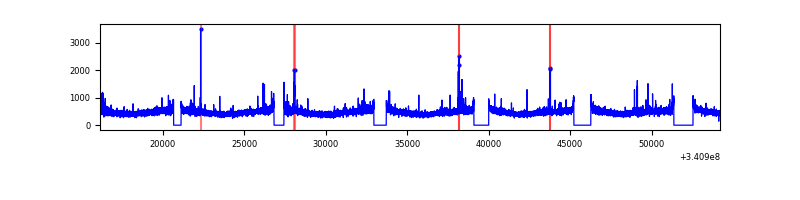 |
| C | 38070 | 33094 | 2506 | 2506 | 6.58% | 7.57% | 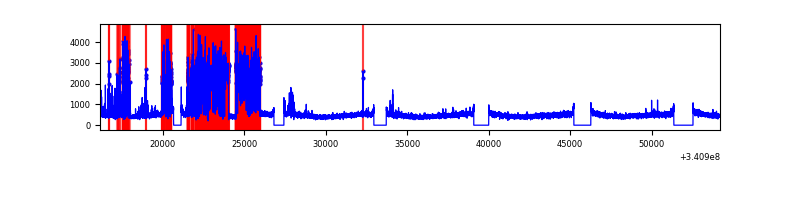 |
| D | 38070 | 33094 | 3147 | 3147 | 8.27% | 9.51% | 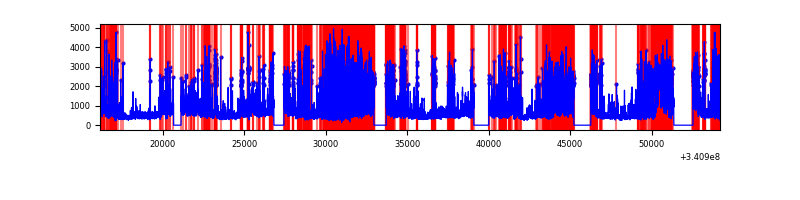 |
Top three noisy pixels from each quadrant. If the there are fewer than three noisy pixels in the level2.evt file, extra rows are filled as -1
| Pixel properties | Quadrant properties | ||||||
|---|---|---|---|---|---|---|---|
| Quadrant | DetID | PixID | Counts | Sigma | Mean | Median | Sigma |
| A | 13 | 254 | 53705 | 61.46 | 4054 | 3973 | 809.2 |
| A | 12 | 96 | 48612 | 55.16 | 4054 | 3973 | 809.2 |
| A | 3 | 137 | 37811 | 41.82 | 4054 | 3973 | 809.2 |
| B | 15 | 32 | 118400 | 151.05 | 4012 | 3911 | 758.0 |
| B | 12 | 111 | 93870 | 118.69 | 4012 | 3911 | 758.0 |
| B | 11 | 111 | 84027 | 105.7 | 4012 | 3911 | 758.0 |
| C | 2 | 16 | 7879820 | 9081.32 | 3685 | 3704 | 867.3 |
| C | 14 | 238 | 588821 | 674.65 | 3685 | 3704 | 867.3 |
| C | 15 | 208 | 141672 | 159.08 | 3685 | 3704 | 867.3 |
| D | 1 | 52 | 13256294 | 15308.78 | 3695 | 3619 | 865.7 |
| D | 12 | 227 | 1066606 | 1227.91 | 3695 | 3619 | 865.7 |
| D | 2 | 250 | 885847 | 1019.1 | 3695 | 3619 | 865.7 |
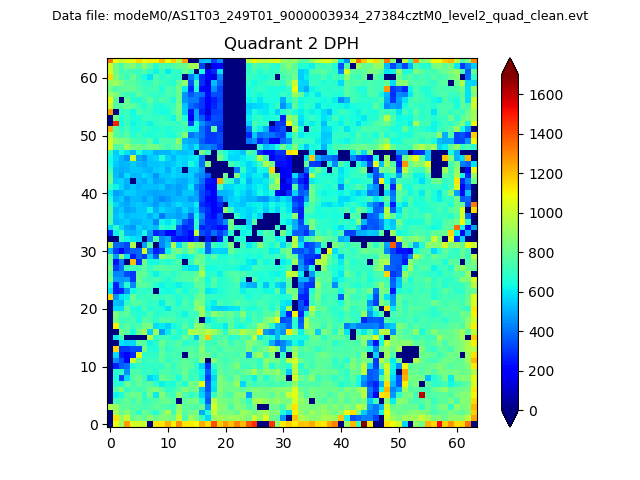
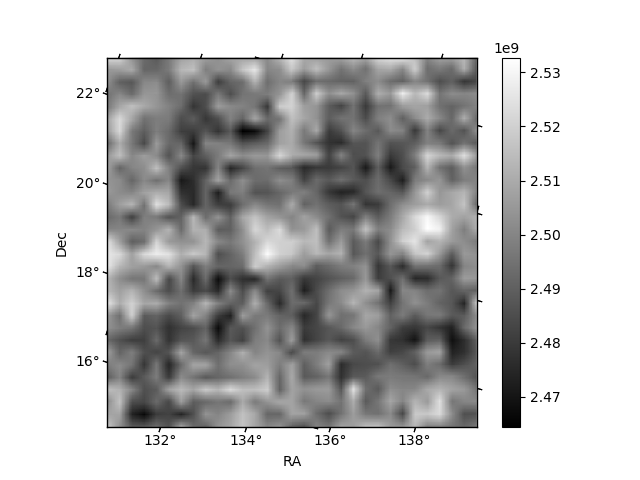
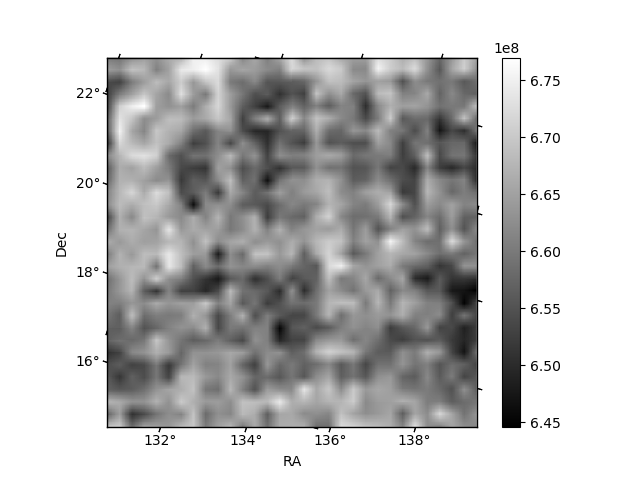
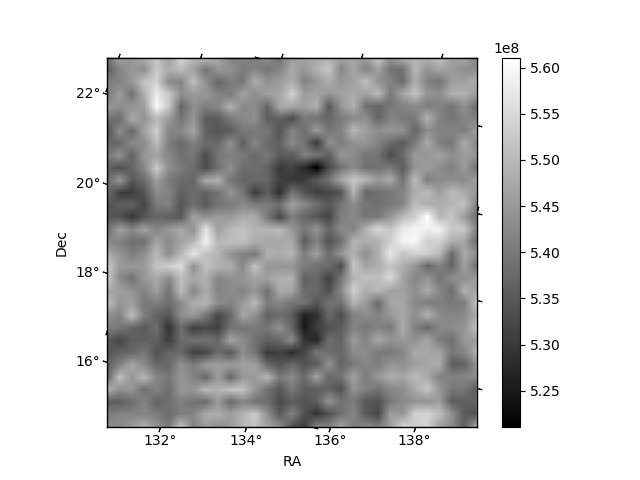
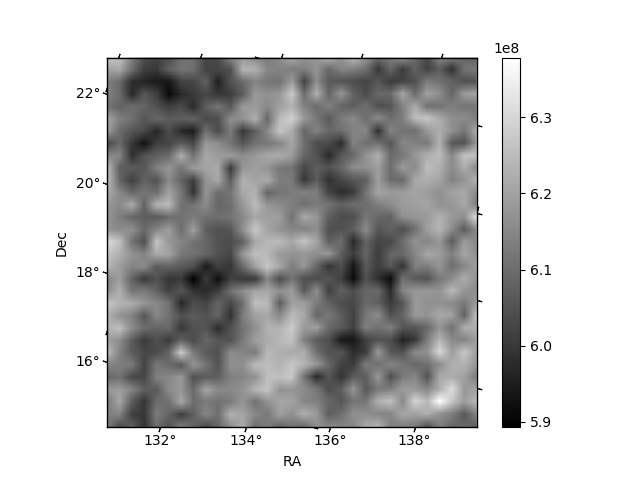
Histogram calculated using DETX and DETY for each event in the final _common_clean file
| Quadrant A | 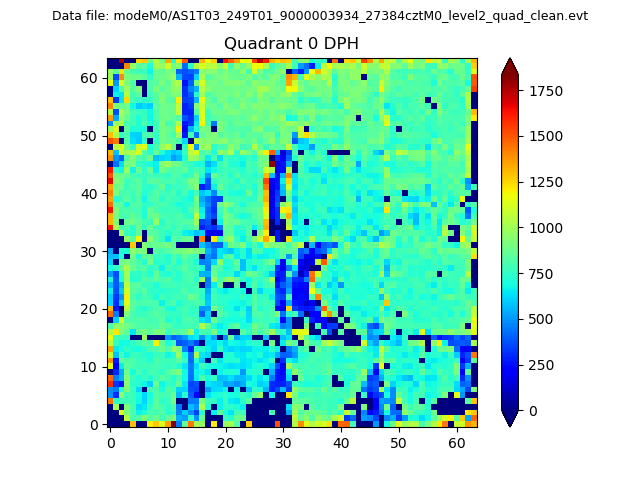 |
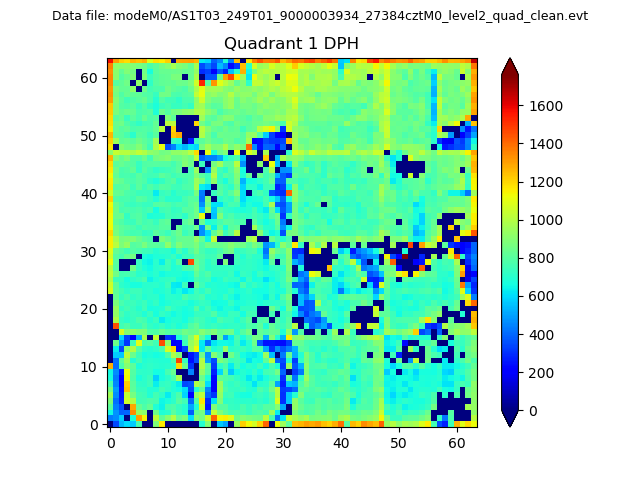 |
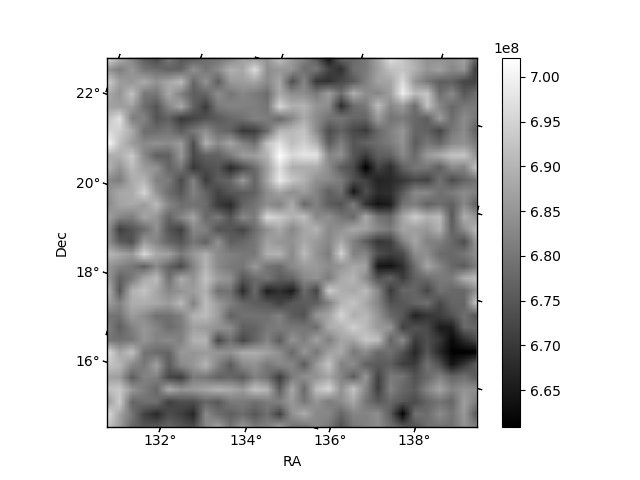
Quadrant B |
|---|---|---|---|
| Quadrant D | 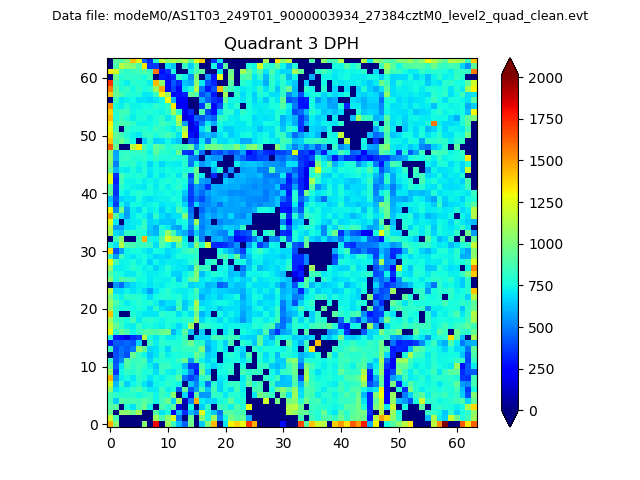 |
 |
Quadrant C |
| Plot type | Count rate plots | Images |
|---|---|---|
| Comparison with Poisson distribution Blue bars denote a histogram of data divided into 1 sec bins. Red curve is a Poisson curve with rate = median count rate of data. |
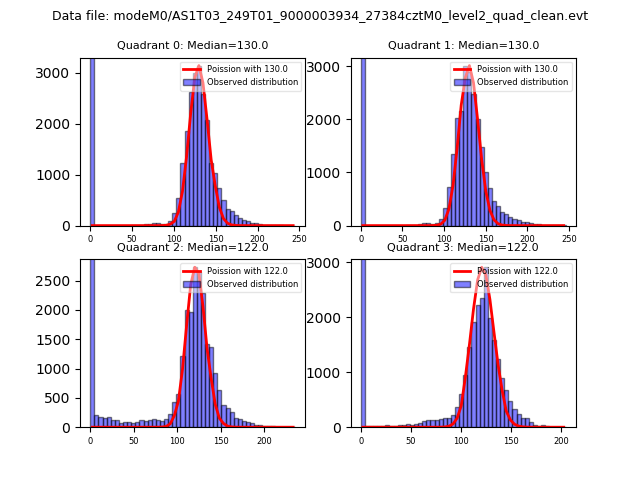 |
 |
| Quadrant-wise count rates Data is divided into 100 sec bins |
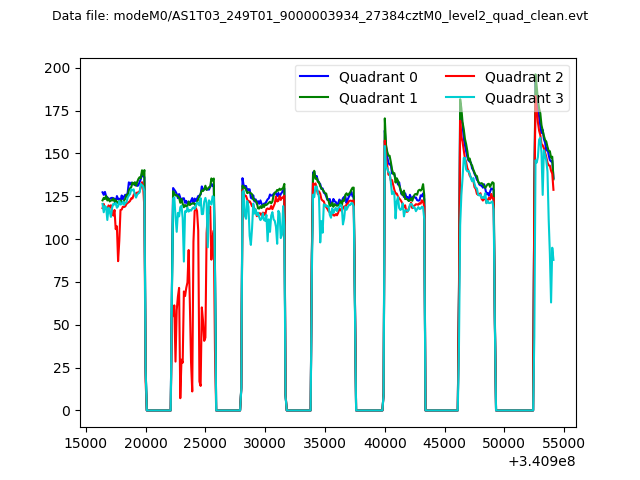 |
|
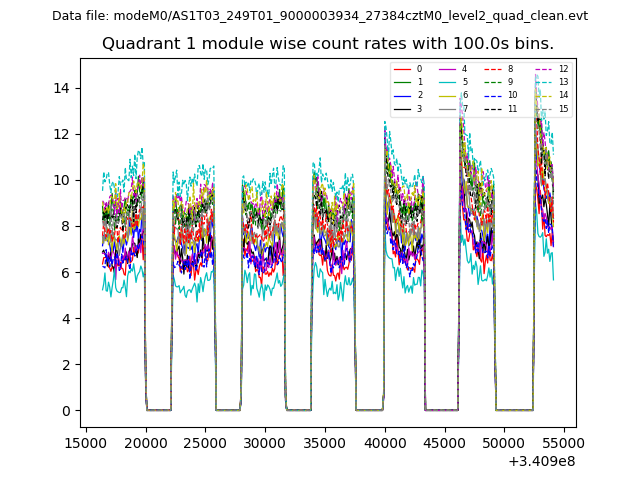
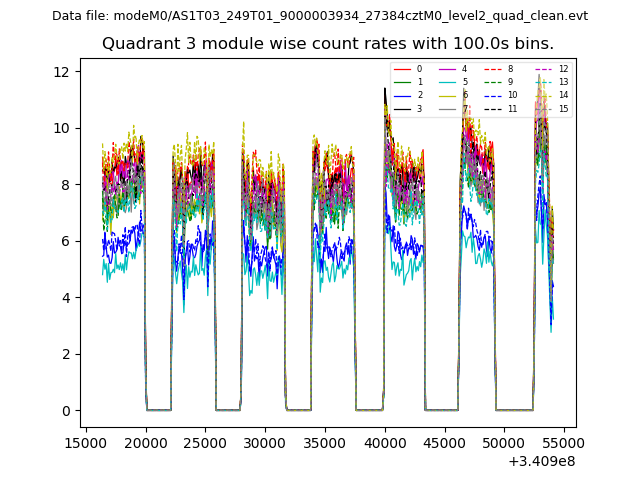
| Module-wise count rates for Quadrant A Data is divided into 100 sec bins |
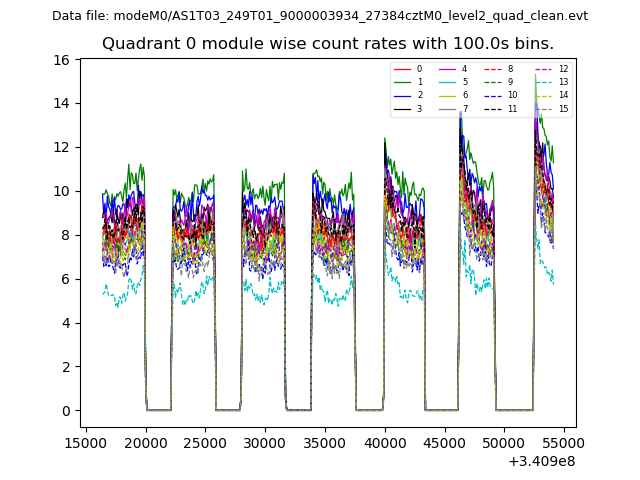 |
 |
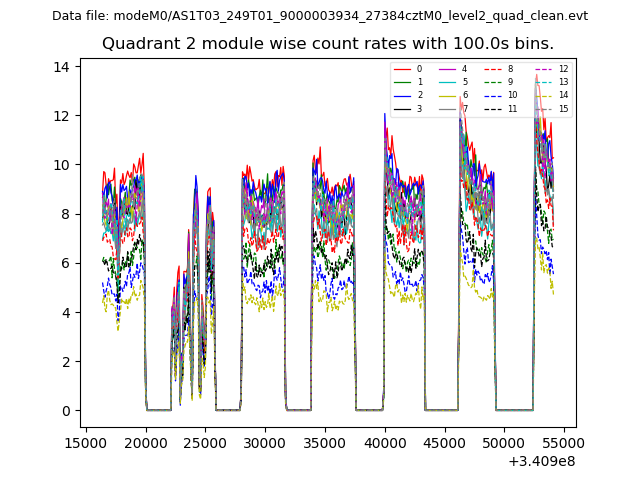
| Module-wise count rates for Quadrant B Data is divided into 100 sec bins |
 |
 |
| Module-wise count rates for Quadrant C Data is divided into 100 sec bins |
 |
 |
| Module-wise count rates for Quadrant D Data is divided into 100 sec bins |
 |
 |
| Parameter | Plot |
|---|---|
| CZT HV Monitor | 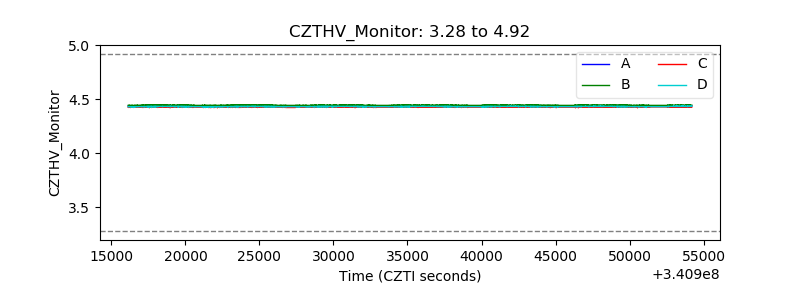 |
| D_VDD | 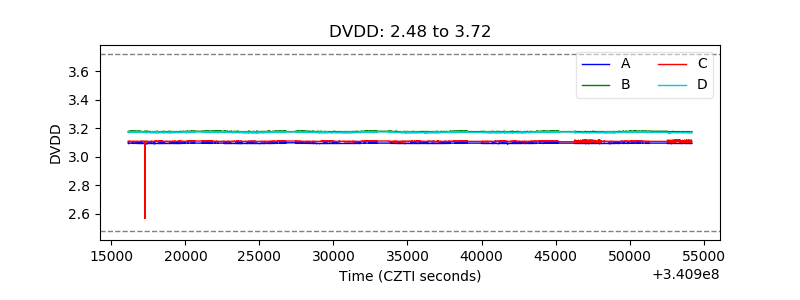 |
| Temperature 1 | 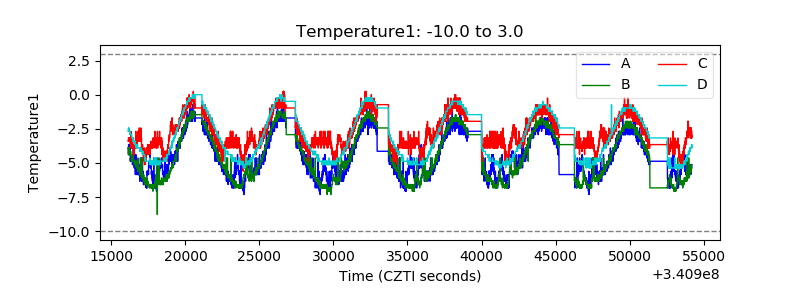 |
| Veto HV Monitor | 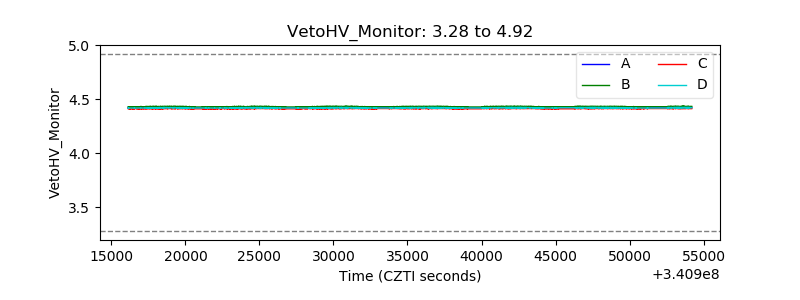 |
| Veto LLD | 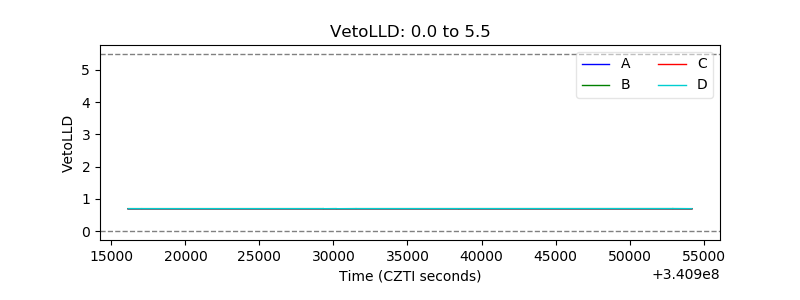 |
| Alpha Counter | 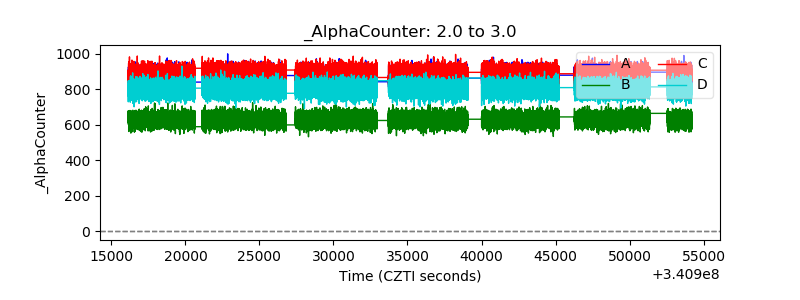 |
| _CPM_Rate | 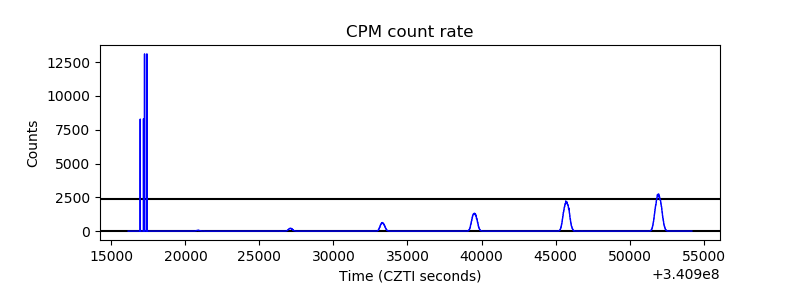 |
| CZT Counter | 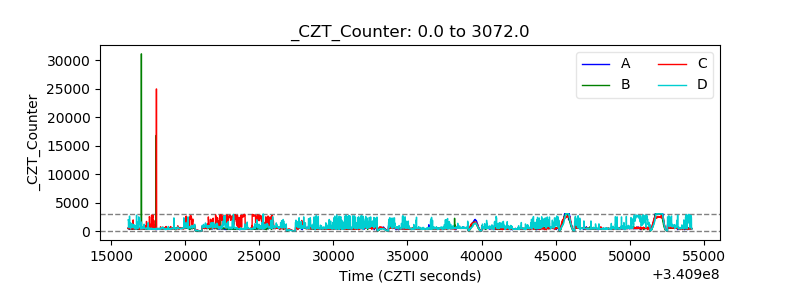 |
| +2.5 Volts monitor |  |
| +5 Volts monitor | 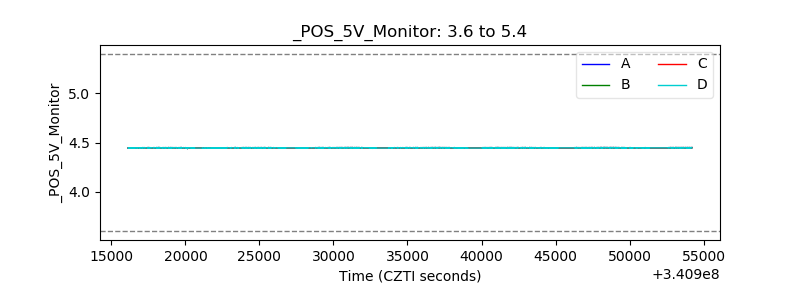 |
| _ROLL_ROT |  |
| _Roll_DEC | 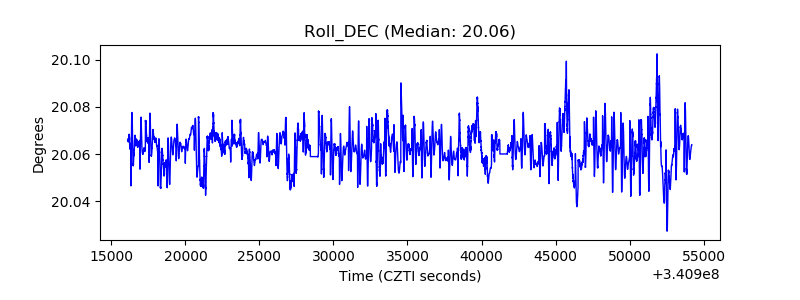 |
| _Roll_RA | 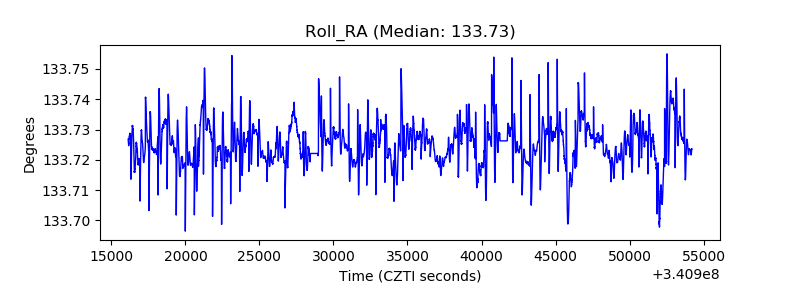 |
| Veto Counter |  |