| Param | Original file | Final file |
|---|---|---|
| Filename | modeM0/AS1T03_249T01_9000003934_27385cztM0_level2.evt | modeM0/AS1T03_249T01_9000003934_27385cztM0_level2_quad_clean.evt |
| Size (bytes) | 719,714,880 | 87,975,360 |
| Size | 686.4 MB | 83.9 MB |
| Events in quadrant A | 3,137,259 | 609,092 |
| Events in quadrant B | 3,176,470 | 619,787 |
| Events in quadrant C | 3,166,076 | 584,029 |
| Events in quadrant D | 11,903,630 | 424,398 |
| Mode M0 | |||
|---|---|---|---|
| Quadrant | BADHDUFLAG | Total packets | Discarded packets |
| A | 0 | 12814 | 0 |
| B | 0 | 12935 | 0 |
| C | 0 | 12924 | 0 |
| D | 0 | 39522 | 0 |
| Mode M9 | |||
|---|---|---|---|
| Quadrant | BADHDUFLAG | Total packets | Discarded packets |
| A | 0 | 13 | 0 |
| B | 0 | 13 | 0 |
| C | 0 | 13 | 0 |
| D | 0 | 13 | 0 |
| Quadrant | Total seconds | Saturated seconds | Saturation percentage |
|---|---|---|---|
| A | 6103 | 30 | 0.491562% |
| B | 6104 | 44 | 0.720839% |
| C | 6104 | 73 | 1.195937% |
| D | 6103 | 3870 | 63.411437% |
Noise dominated data is calculated using 1-second bins in cleaned event files. If a bin has >2000 counts, and if more than 50% of those come from <1% of pixels, then it is considered to be noise-dominated and hence unusable.
| Quadrant | # 1 sec bins | Bins with >0 counts | Bins with >2000 counts | High rate bins dominated by noise | Noise dominated (total time) | Noise dominated (detector-on time) | Marked lightcurve |
|---|---|---|---|---|---|---|---|
| A | 7363 | 6104 | 2 | 2 | 0.03% | 0.03% | 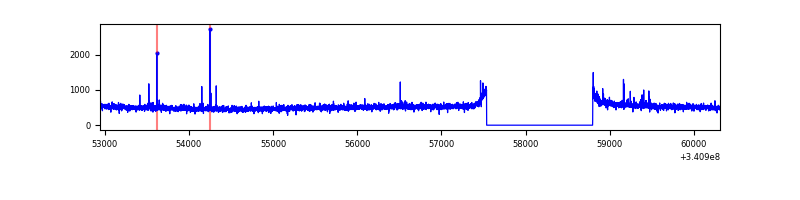 |
| B | 7364 | 6104 | 5 | 5 | 0.07% | 0.08% | 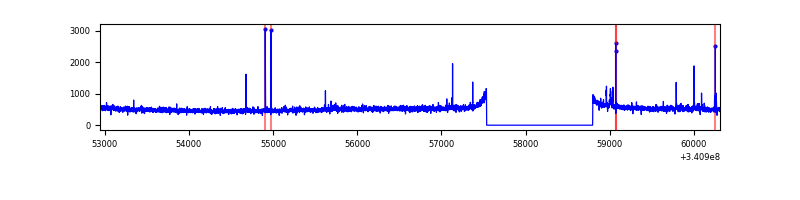 |
| C | 7364 | 6105 | 4 | 4 | 0.05% | 0.07% | 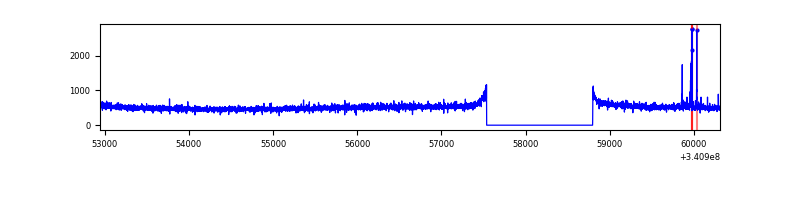 |
| D | 7362 | 6102 | 3796 | 3796 | 51.56% | 62.21% | 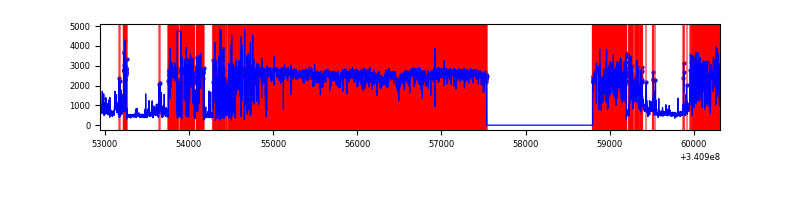 |
Top three noisy pixels from each quadrant. If the there are fewer than three noisy pixels in the level2.evt file, extra rows are filled as -1
| Pixel properties | Quadrant properties | ||||||
|---|---|---|---|---|---|---|---|
| Quadrant | DetID | PixID | Counts | Sigma | Mean | Median | Sigma |
| A | 12 | 96 | 35845 | 219.07 | 805 | 793 | 160.0 |
| A | 13 | 254 | 9236 | 52.77 | 805 | 793 | 160.0 |
| A | 0 | 226 | 6974 | 38.63 | 805 | 793 | 160.0 |
| B | 0 | 190 | 23621 | 153.26 | 797 | 780 | 149.0 |
| B | 12 | 111 | 17796 | 114.17 | 797 | 780 | 149.0 |
| B | 11 | 111 | 15781 | 100.65 | 797 | 780 | 149.0 |
| C | 14 | 238 | 124211 | 692.8 | 766 | 772 | 178.2 |
| C | 2 | 16 | 38972 | 214.4 | 766 | 772 | 178.2 |
| C | 8 | 128 | 8439 | 43.03 | 766 | 772 | 178.2 |
| D | 1 | 52 | 10319119 | 110181.17 | 405 | 397 | 93.7 |
| D | 2 | 250 | 32273 | 340.37 | 405 | 397 | 93.7 |
| D | 2 | 234 | 11989 | 123.78 | 405 | 397 | 93.7 |
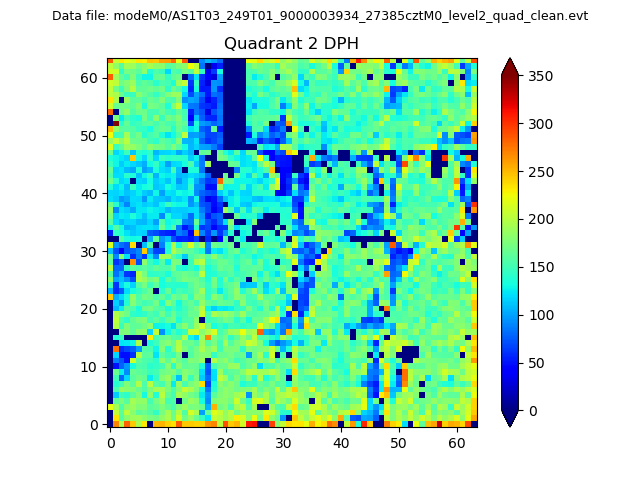
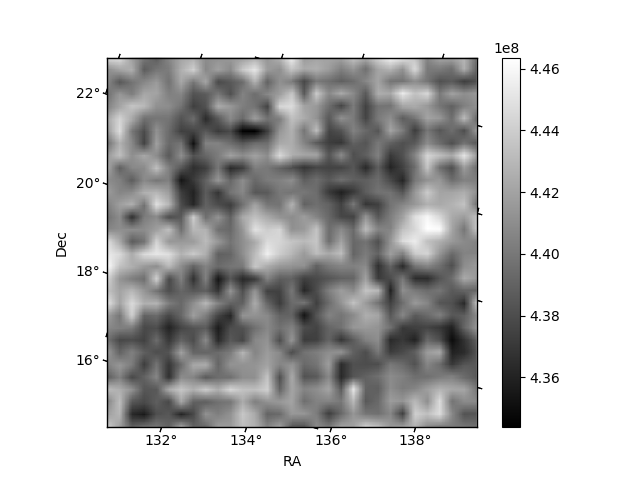
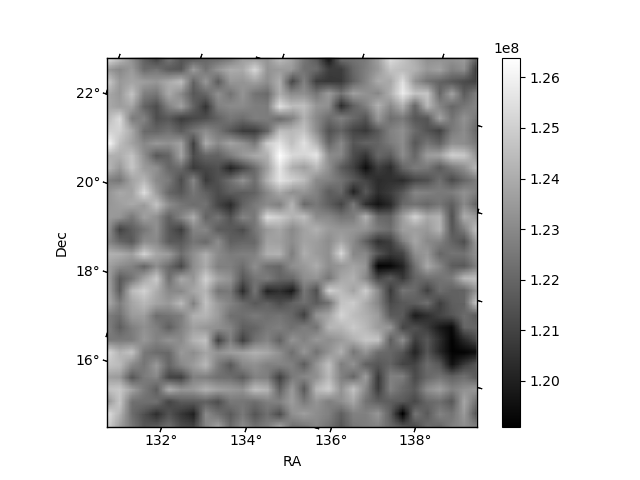
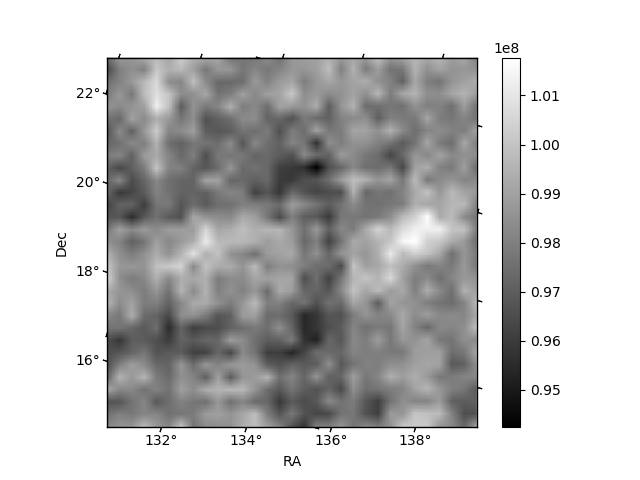
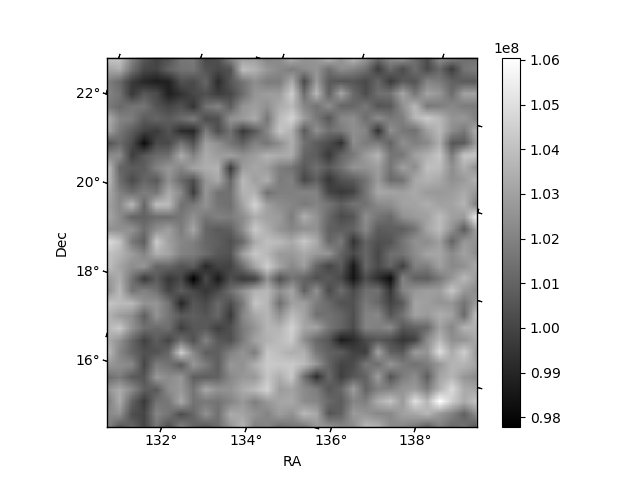
Histogram calculated using DETX and DETY for each event in the final _common_clean file
| Quadrant A | 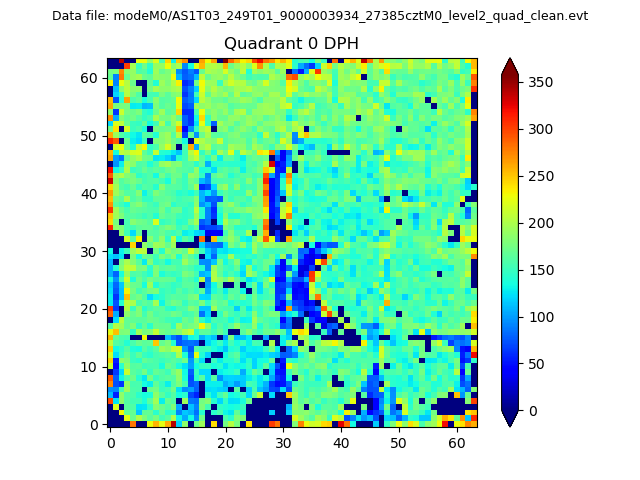 |
 |
Quadrant B |
|---|---|---|---|
| Quadrant D | 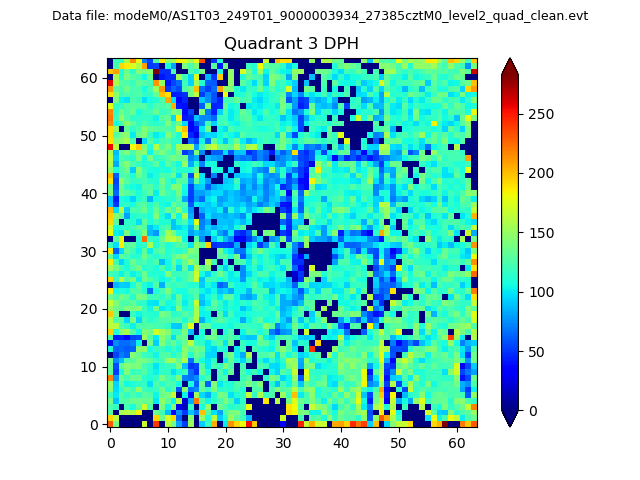 |
 |
Quadrant C |
| Plot type | Count rate plots | Images |
|---|---|---|
| Comparison with Poisson distribution Blue bars denote a histogram of data divided into 1 sec bins. Red curve is a Poisson curve with rate = median count rate of data. |
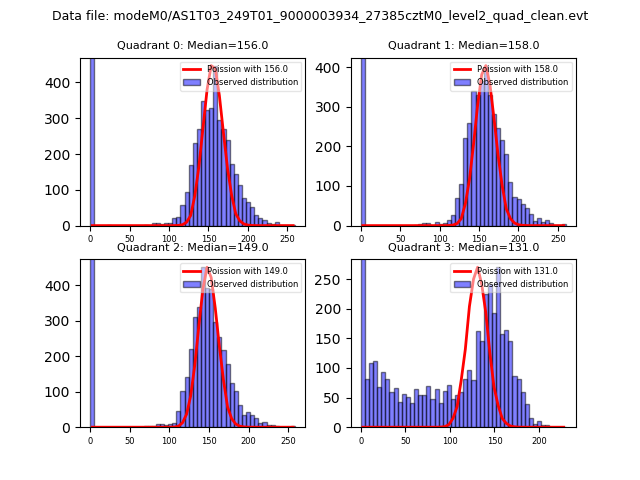 |
 |
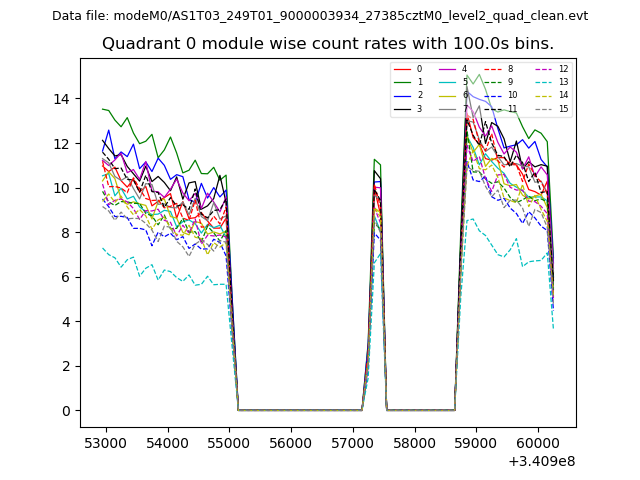
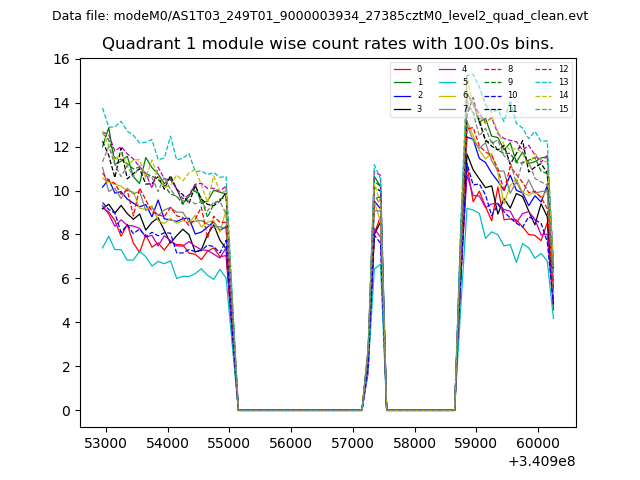
| Quadrant-wise count rates Data is divided into 100 sec bins |
 |
|
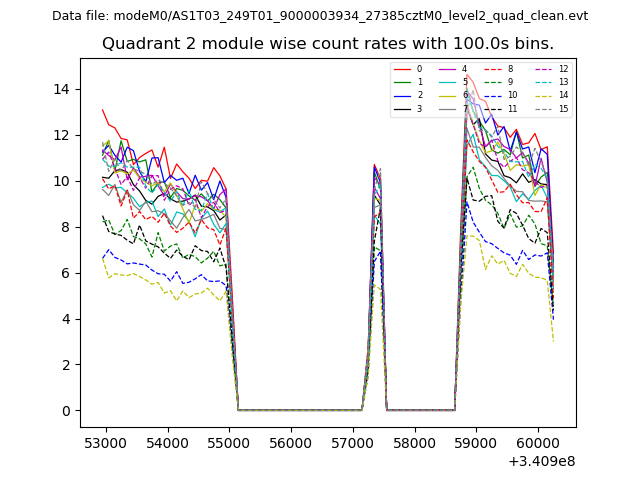
| Module-wise count rates for Quadrant A Data is divided into 100 sec bins |
 |
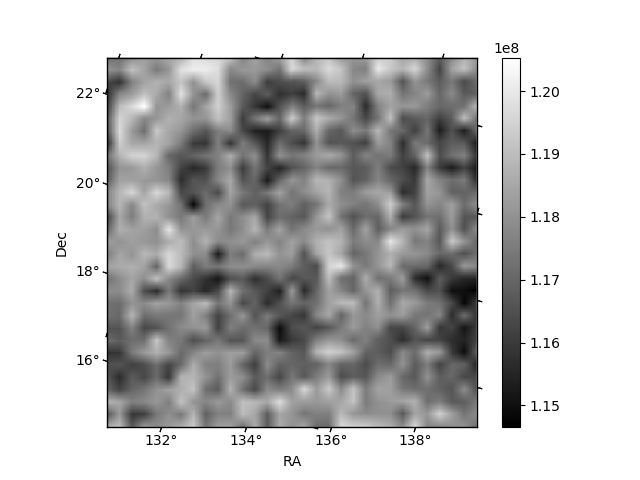 |
| Module-wise count rates for Quadrant B Data is divided into 100 sec bins |
 |
 |
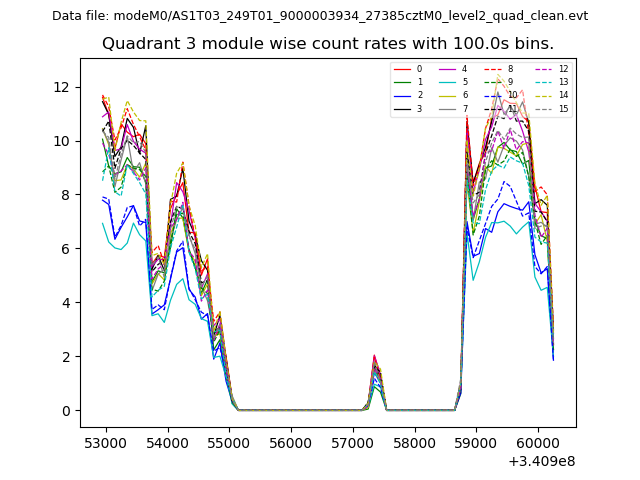
| Module-wise count rates for Quadrant C Data is divided into 100 sec bins |
 |
 |
| Module-wise count rates for Quadrant D Data is divided into 100 sec bins |
 |
 |
| Parameter | Plot |
|---|---|
| CZT HV Monitor | 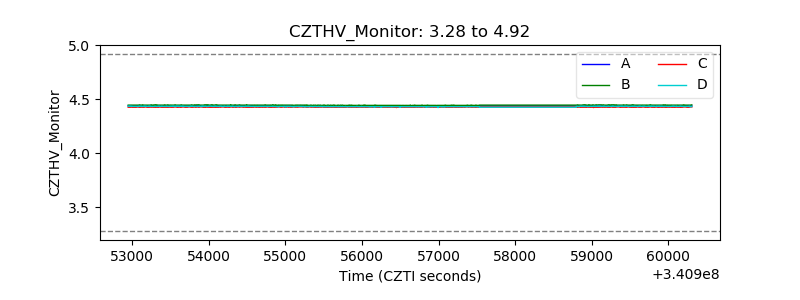 |
| D_VDD | 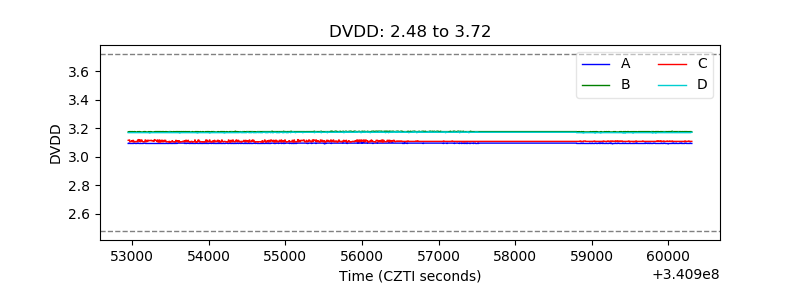 |
| Temperature 1 | 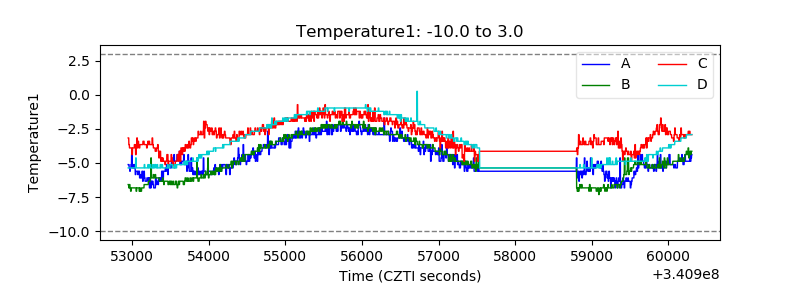 |
| Veto HV Monitor | 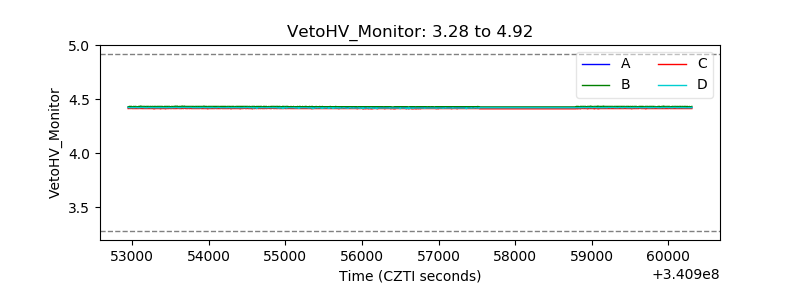 |
| Veto LLD | 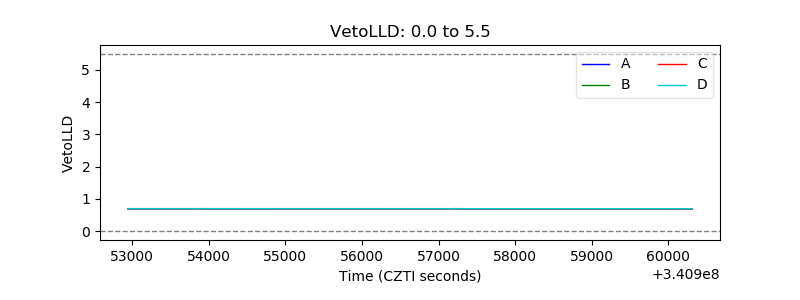 |
| Alpha Counter | 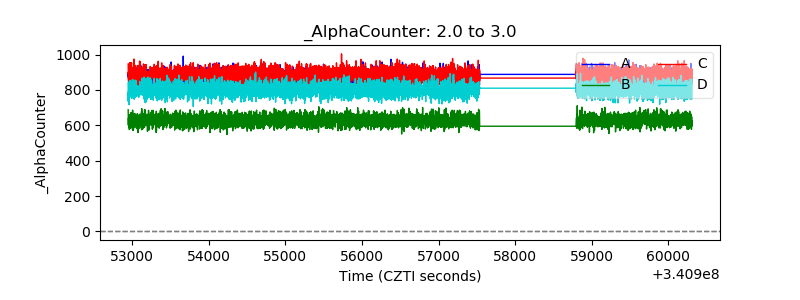 |
| _CPM_Rate | 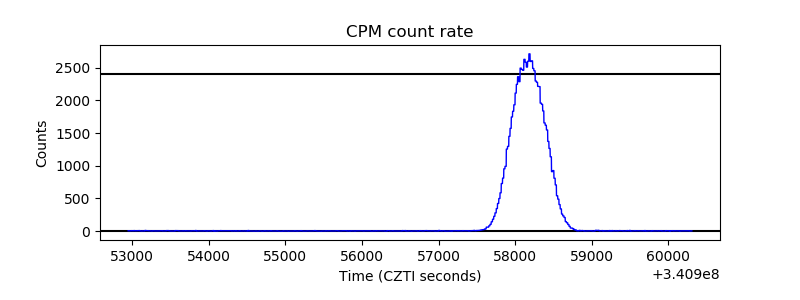 |
| CZT Counter | 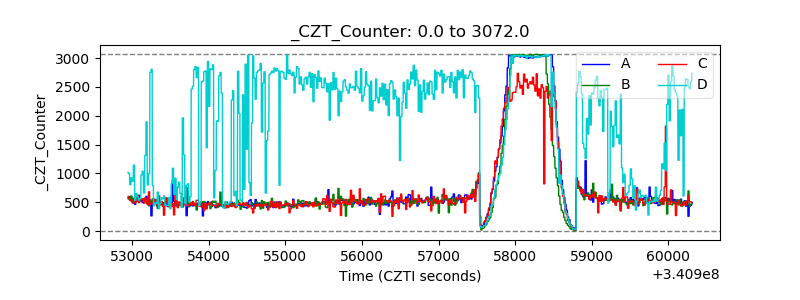 |
| +2.5 Volts monitor | 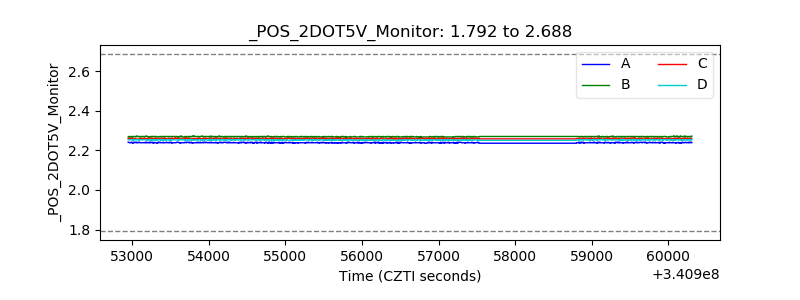 |
| +5 Volts monitor | 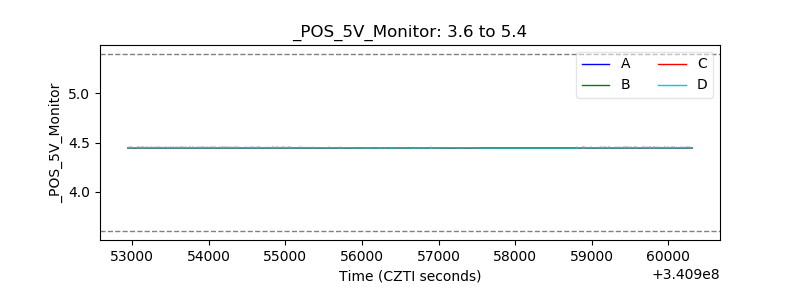 |
| _ROLL_ROT |  |
| _Roll_DEC | 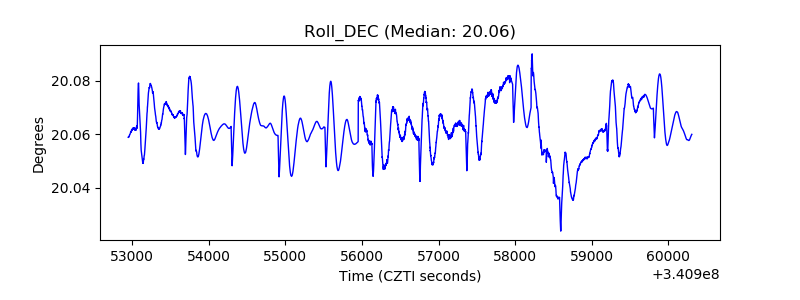 |
| _Roll_RA |  |
| Veto Counter |  |