| Param | Original file | Final file |
|---|---|---|
| Filename | modeM0/AS1T03_249T01_9000003934_27386cztM0_level2.evt | modeM0/AS1T03_249T01_9000003934_27386cztM0_level2_quad_clean.evt |
| Size (bytes) | 650,154,240 | 88,142,400 |
| Size | 620.0 MB | 84.1 MB |
| Events in quadrant A | 3,117,162 | 597,501 |
| Events in quadrant B | 3,158,955 | 603,154 |
| Events in quadrant C | 3,153,003 | 573,438 |
| Events in quadrant D | 9,860,708 | 481,705 |
| Mode M0 | |||
|---|---|---|---|
| Quadrant | BADHDUFLAG | Total packets | Discarded packets |
| A | 0 | 12483 | 0 |
| B | 0 | 12608 | 0 |
| C | 0 | 12607 | 0 |
| D | 0 | 33457 | 0 |
| Mode M9 | |||
|---|---|---|---|
| Quadrant | BADHDUFLAG | Total packets | Discarded packets |
| A | 0 | 13 | 0 |
| B | 0 | 13 | 0 |
| C | 0 | 13 | 0 |
| D | 0 | 13 | 0 |
| Quadrant | Total seconds | Saturated seconds | Saturation percentage |
|---|---|---|---|
| A | 5910 | 45 | 0.761421% |
| B | 5911 | 63 | 1.065810% |
| C | 5911 | 88 | 1.488750% |
| D | 5910 | 2663 | 45.059222% |
Noise dominated data is calculated using 1-second bins in cleaned event files. If a bin has >2000 counts, and if more than 50% of those come from <1% of pixels, then it is considered to be noise-dominated and hence unusable.
| Quadrant | # 1 sec bins | Bins with >0 counts | Bins with >2000 counts | High rate bins dominated by noise | Noise dominated (total time) | Noise dominated (detector-on time) | Marked lightcurve |
|---|---|---|---|---|---|---|---|
| A | 7210 | 5910 | 0 | 0 | 0.00% | 0.00% | 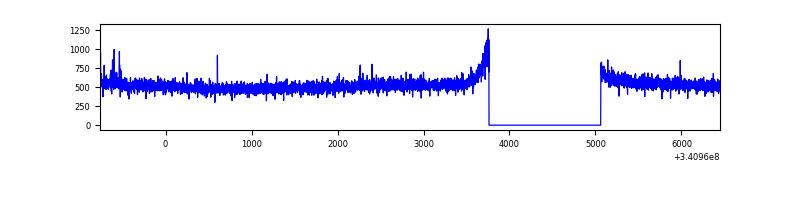 |
| B | 7211 | 5912 | 4 | 4 | 0.06% | 0.07% | 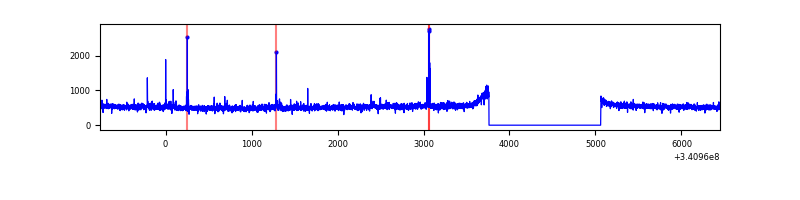 |
| C | 7211 | 5912 | 4 | 4 | 0.06% | 0.07% | 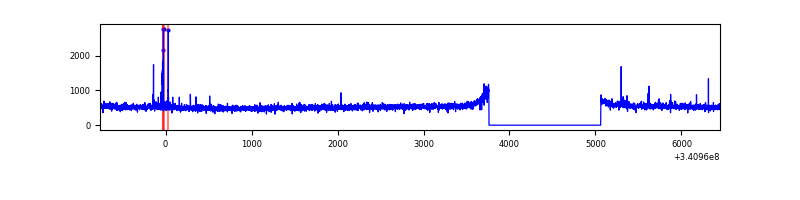 |
| D | 7209 | 5909 | 2520 | 2520 | 34.96% | 42.65% | 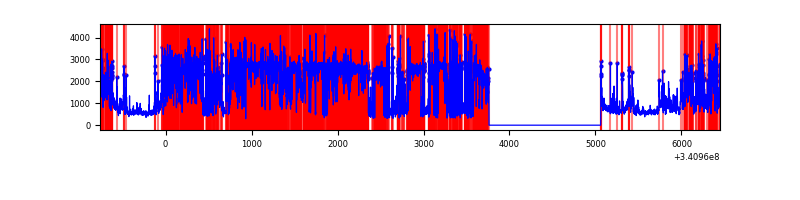 |
Top three noisy pixels from each quadrant. If the there are fewer than three noisy pixels in the level2.evt file, extra rows are filled as -1
| Pixel properties | Quadrant properties | ||||||
|---|---|---|---|---|---|---|---|
| Quadrant | DetID | PixID | Counts | Sigma | Mean | Median | Sigma |
| A | 12 | 96 | 12276 | 72.01 | 804 | 793 | 159.5 |
| A | 13 | 254 | 9738 | 56.1 | 804 | 793 | 159.5 |
| A | 0 | 226 | 7144 | 39.83 | 804 | 793 | 159.5 |
| B | 15 | 32 | 23479 | 152.68 | 792 | 775 | 148.7 |
| B | 0 | 190 | 19914 | 128.71 | 792 | 775 | 148.7 |
| B | 12 | 111 | 17509 | 112.53 | 792 | 775 | 148.7 |
| C | 14 | 238 | 124893 | 699.61 | 763 | 769 | 177.4 |
| C | 2 | 16 | 53452 | 296.94 | 763 | 769 | 177.4 |
| C | 13 | 61 | 5289 | 25.48 | 763 | 769 | 177.4 |
| D | 1 | 52 | 7632008 | 57322.02 | 575 | 565 | 133.1 |
| D | 2 | 250 | 24056 | 176.45 | 575 | 565 | 133.1 |
| D | 2 | 234 | 17946 | 130.55 | 575 | 565 | 133.1 |
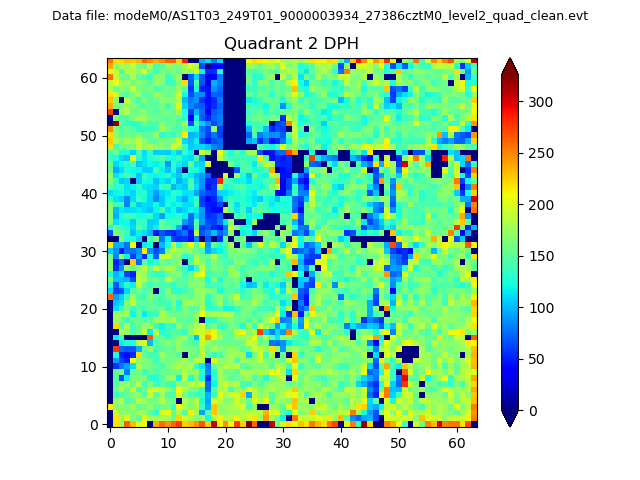
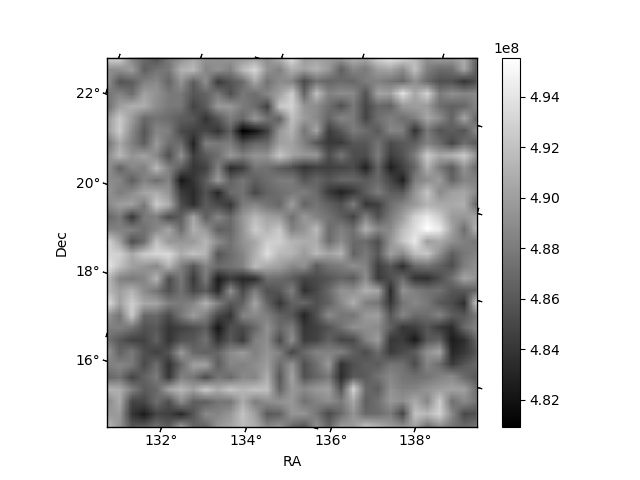
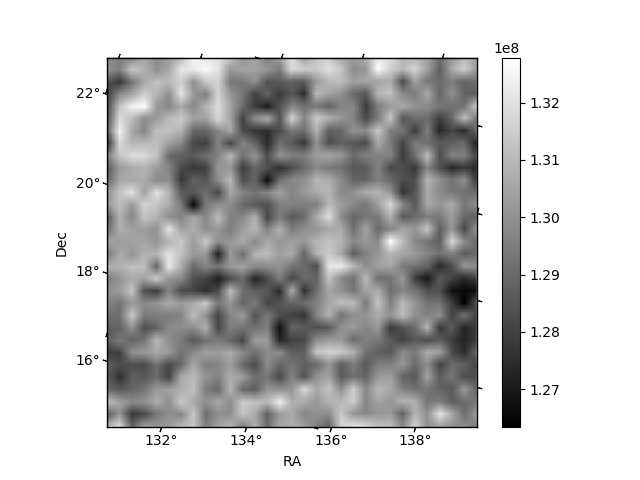
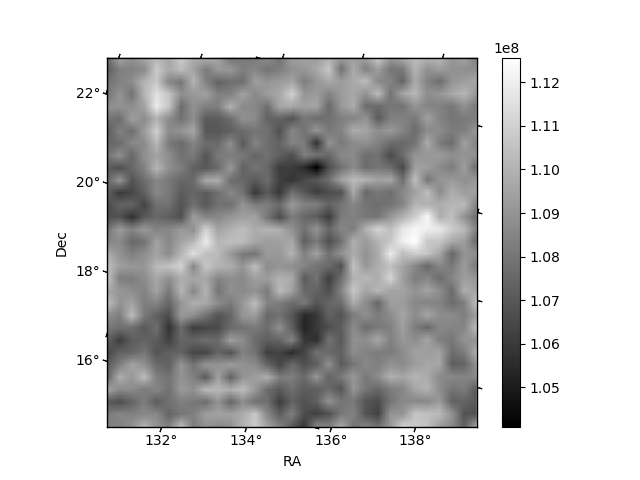
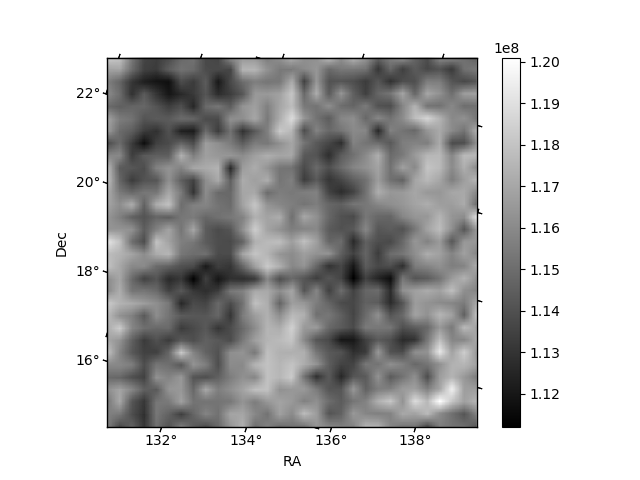
Histogram calculated using DETX and DETY for each event in the final _common_clean file
| Quadrant A | 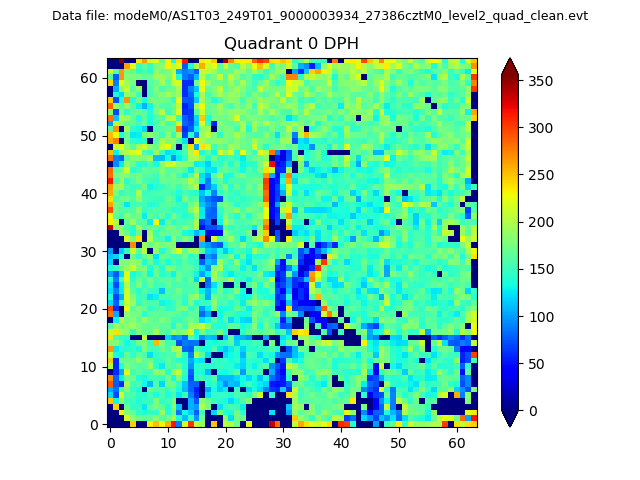 |
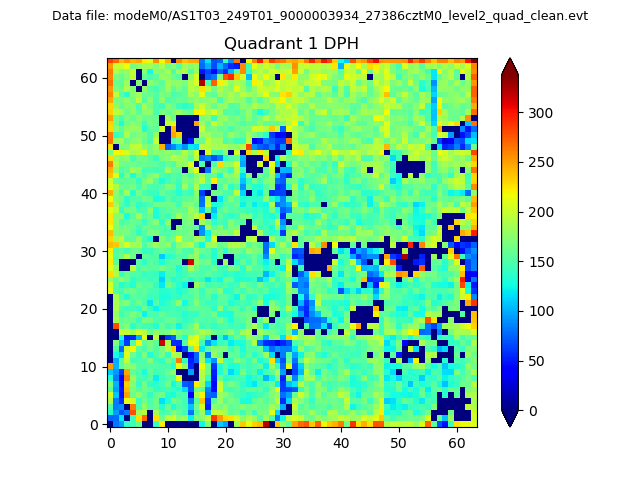 |
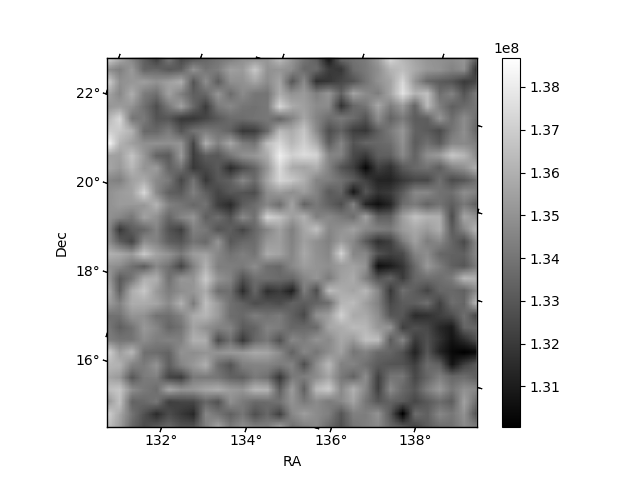
Quadrant B |
|---|---|---|---|
| Quadrant D | 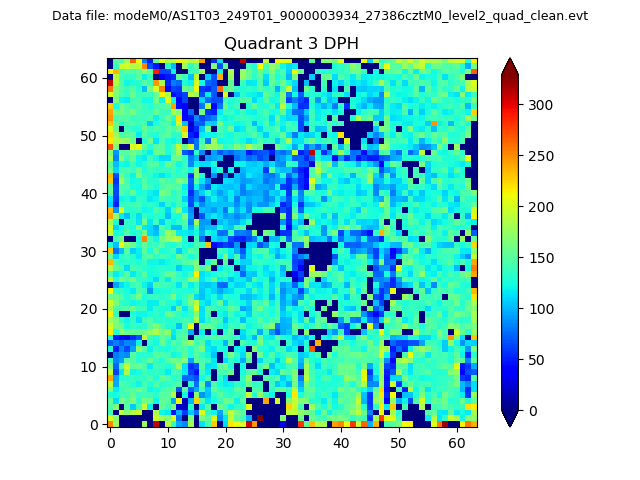 |
 |
Quadrant C |
| Plot type | Count rate plots | Images |
|---|---|---|
| Comparison with Poisson distribution Blue bars denote a histogram of data divided into 1 sec bins. Red curve is a Poisson curve with rate = median count rate of data. |
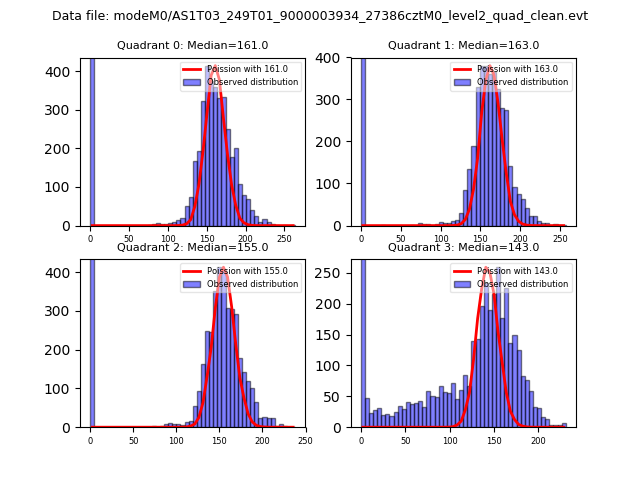 |
 |
| Quadrant-wise count rates Data is divided into 100 sec bins |
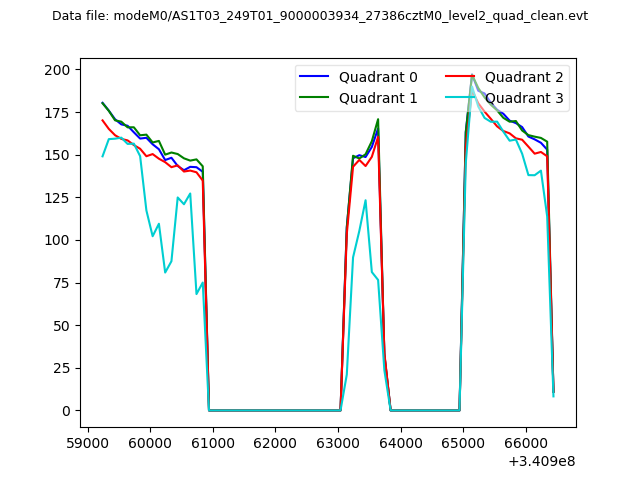 |
|
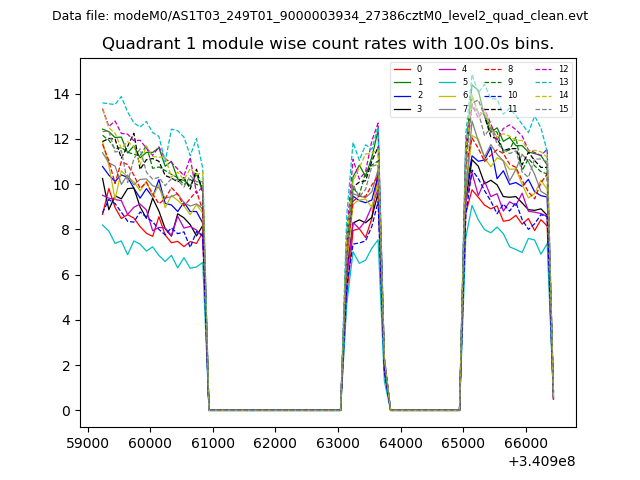
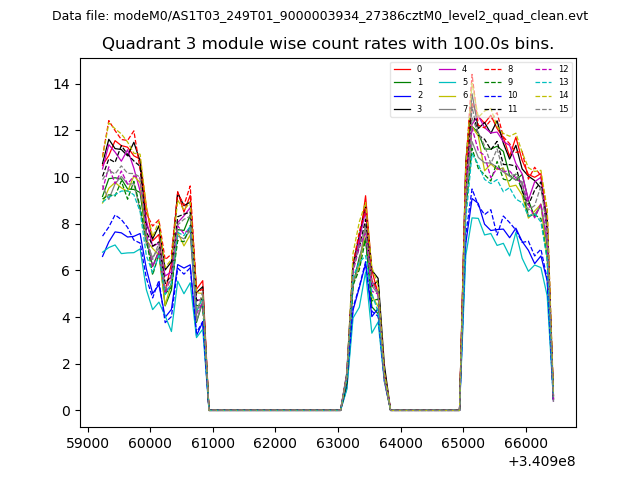
| Module-wise count rates for Quadrant A Data is divided into 100 sec bins |
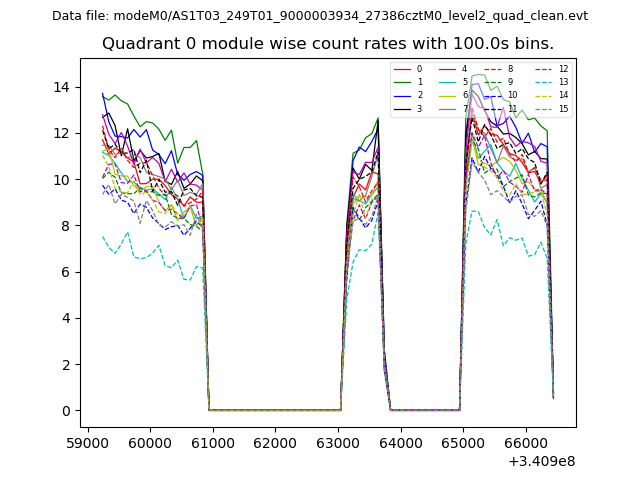 |
 |
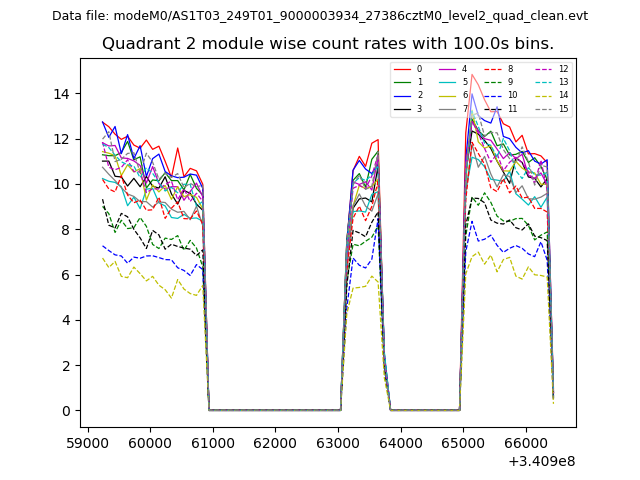
| Module-wise count rates for Quadrant B Data is divided into 100 sec bins |
 |
 |
| Module-wise count rates for Quadrant C Data is divided into 100 sec bins |
 |
 |
| Module-wise count rates for Quadrant D Data is divided into 100 sec bins |
 |
 |
| Parameter | Plot |
|---|---|
| CZT HV Monitor | 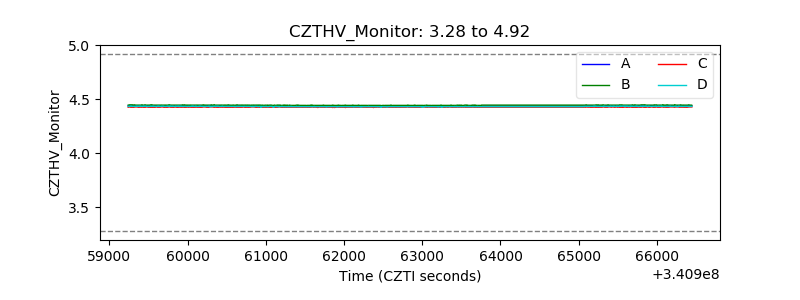 |
| D_VDD | 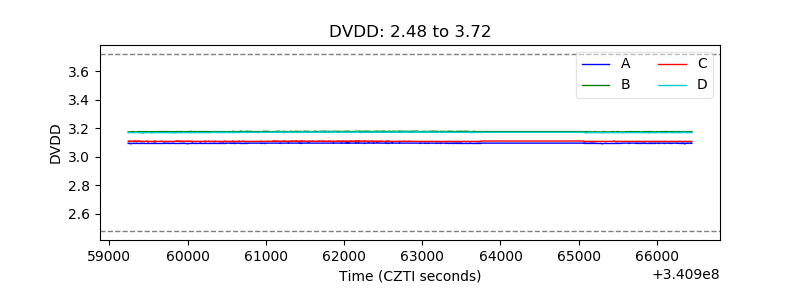 |
| Temperature 1 | 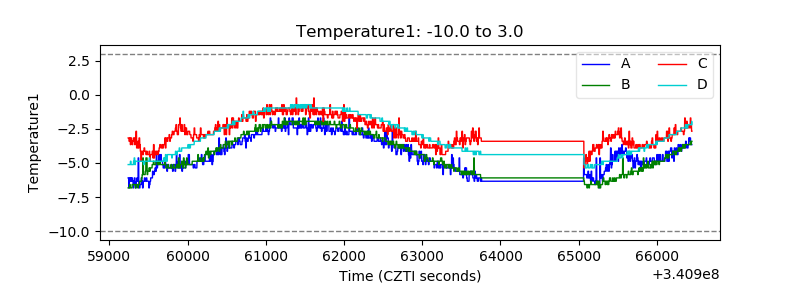 |
| Veto HV Monitor | 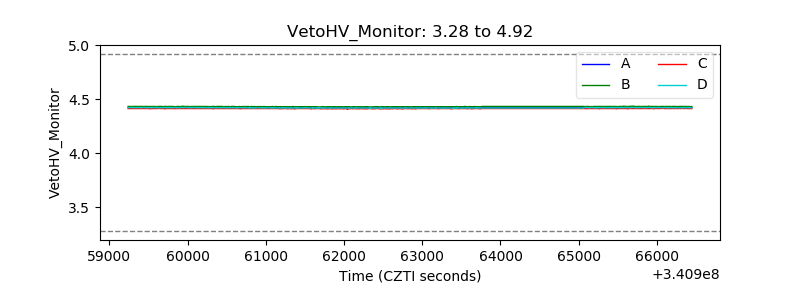 |
| Veto LLD | 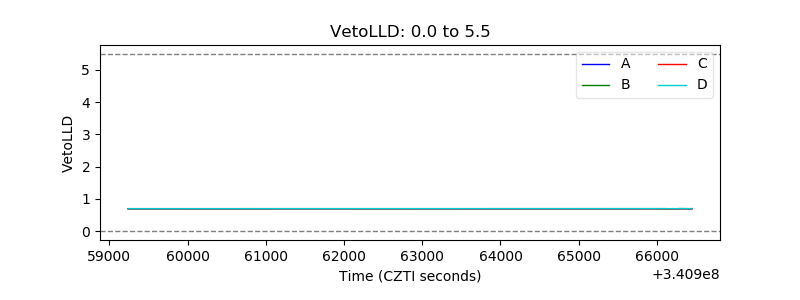 |
| Alpha Counter | 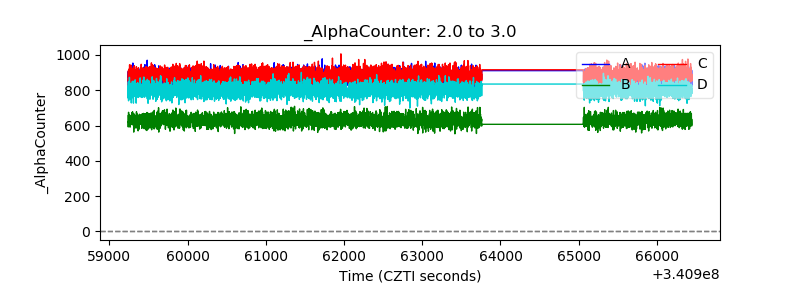 |
| _CPM_Rate | 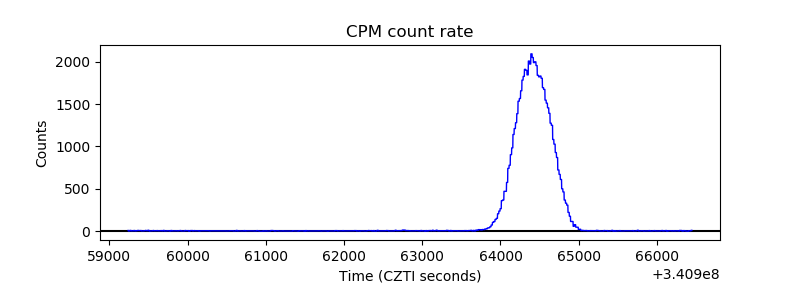 |
| CZT Counter | 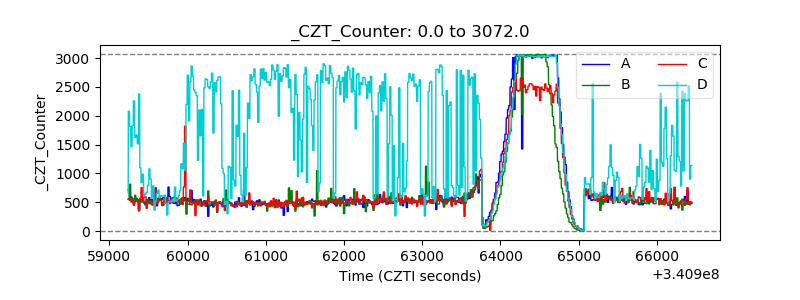 |
| +2.5 Volts monitor | 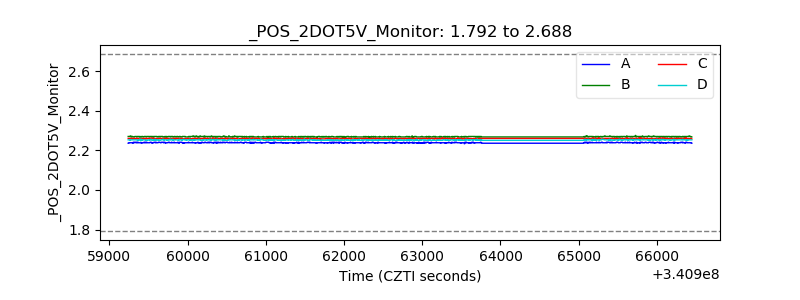 |
| +5 Volts monitor |  |
| _ROLL_ROT | 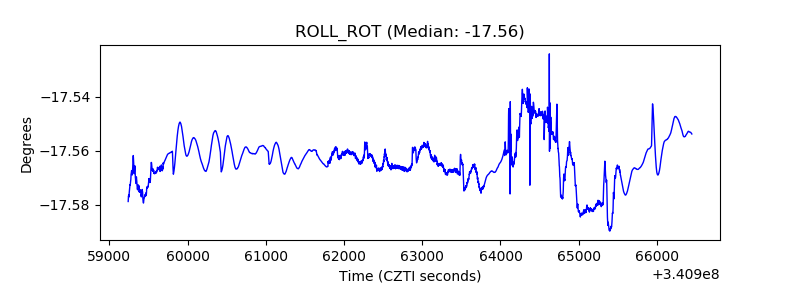 |
| _Roll_DEC | 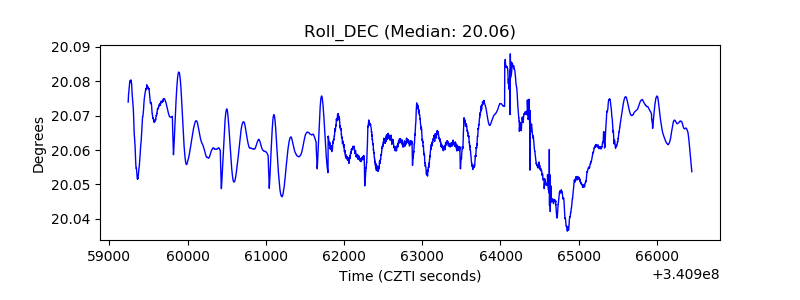 |
| _Roll_RA |  |
| Veto Counter | 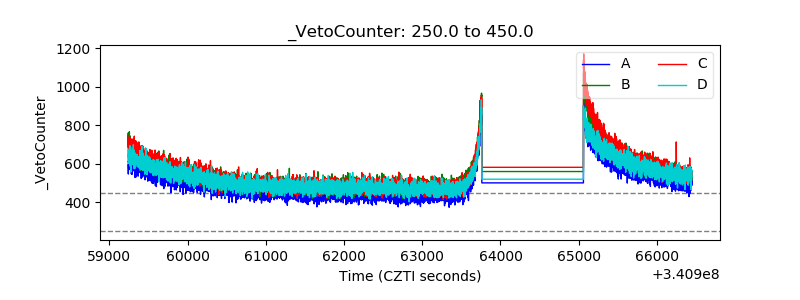 |