| Param | Original file | Final file |
|---|---|---|
| Filename | modeM0/AS1T03_249T01_9000003934_27387cztM0_level2.evt | modeM0/AS1T03_249T01_9000003934_27387cztM0_level2_quad_clean.evt |
| Size (bytes) | 462,222,720 | 81,406,080 |
| Size | 440.8 MB | 77.6 MB |
| Events in quadrant A | 2,970,802 | 533,530 |
| Events in quadrant B | 2,954,017 | 535,742 |
| Events in quadrant C | 2,980,285 | 511,624 |
| Events in quadrant D | 4,713,826 | 493,015 |
| Mode M0 | |||
|---|---|---|---|
| Quadrant | BADHDUFLAG | Total packets | Discarded packets |
| A | 0 | 11819 | 0 |
| B | 0 | 11761 | 0 |
| C | 0 | 11862 | 0 |
| D | 0 | 17704 | 0 |
| Mode M9 | |||
|---|---|---|---|
| Quadrant | BADHDUFLAG | Total packets | Discarded packets |
| A | 0 | 13 | 0 |
| B | 0 | 13 | 0 |
| C | 0 | 13 | 0 |
| D | 0 | 13 | 0 |
| Quadrant | Total seconds | Saturated seconds | Saturation percentage |
|---|---|---|---|
| A | 5590 | 76 | 1.359571% |
| B | 5591 | 82 | 1.466643% |
| C | 5591 | 102 | 1.824361% |
| D | 5591 | 329 | 5.884457% |
Noise dominated data is calculated using 1-second bins in cleaned event files. If a bin has >2000 counts, and if more than 50% of those come from <1% of pixels, then it is considered to be noise-dominated and hence unusable.
| Quadrant | # 1 sec bins | Bins with >0 counts | Bins with >2000 counts | High rate bins dominated by noise | Noise dominated (total time) | Noise dominated (detector-on time) | Marked lightcurve |
|---|---|---|---|---|---|---|---|
| A | 6865 | 5591 | 2 | 2 | 0.03% | 0.04% | 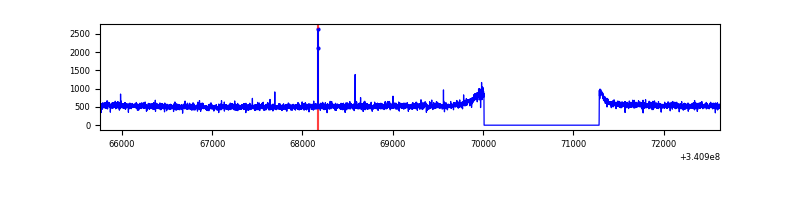 |
| B | 6866 | 5591 | 0 | 0 | 0.00% | 0.00% | 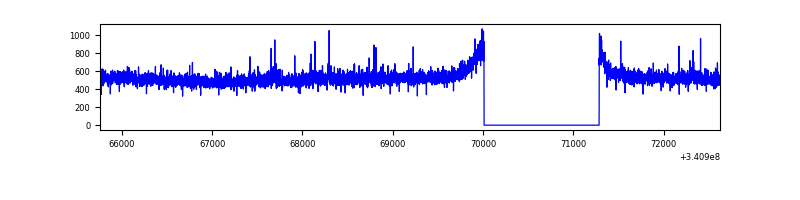 |
| C | 6866 | 5592 | 3 | 3 | 0.04% | 0.05% | 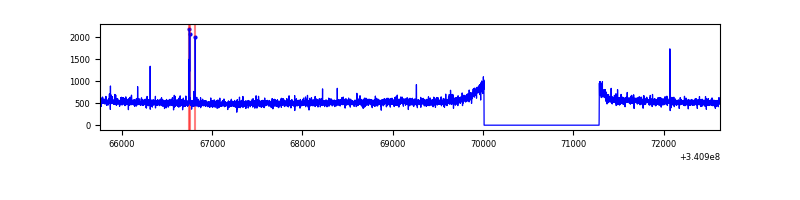 |
| D | 6866 | 5592 | 293 | 293 | 4.27% | 5.24% | 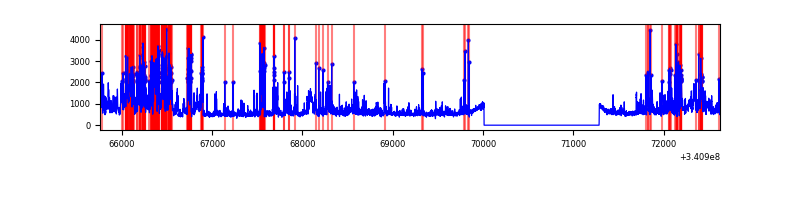 |
Top three noisy pixels from each quadrant. If the there are fewer than three noisy pixels in the level2.evt file, extra rows are filled as -1
| Pixel properties | Quadrant properties | ||||||
|---|---|---|---|---|---|---|---|
| Quadrant | DetID | PixID | Counts | Sigma | Mean | Median | Sigma |
| A | 12 | 96 | 9853 | 59.23 | 766 | 753 | 153.6 |
| A | 13 | 254 | 8801 | 52.38 | 766 | 753 | 153.6 |
| A | 0 | 226 | 6892 | 39.95 | 766 | 753 | 153.6 |
| B | 12 | 111 | 16678 | 112.13 | 748 | 730 | 142.2 |
| B | 11 | 111 | 14883 | 99.51 | 748 | 730 | 142.2 |
| B | 14 | 111 | 13370 | 88.87 | 748 | 730 | 142.2 |
| C | 14 | 238 | 116784 | 689.25 | 725 | 731 | 168.4 |
| C | 2 | 16 | 34678 | 201.61 | 725 | 731 | 168.4 |
| C | 13 | 61 | 5003 | 25.37 | 725 | 731 | 168.4 |
| D | 1 | 52 | 1803668 | 10529.85 | 729 | 714 | 171.2 |
| D | 2 | 250 | 124726 | 724.27 | 729 | 714 | 171.2 |
| D | 2 | 234 | 23590 | 133.6 | 729 | 714 | 171.2 |
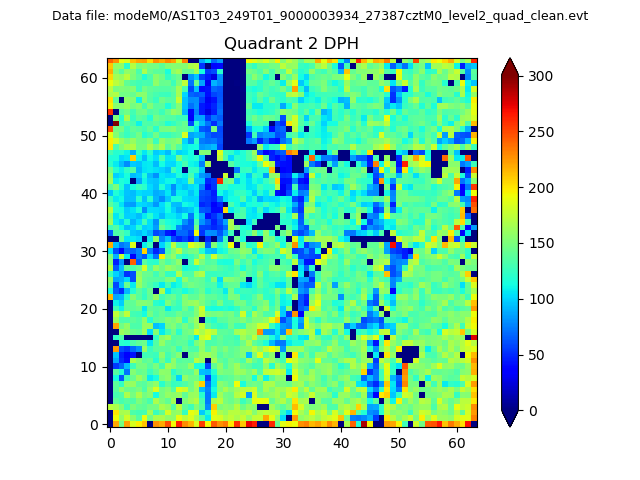
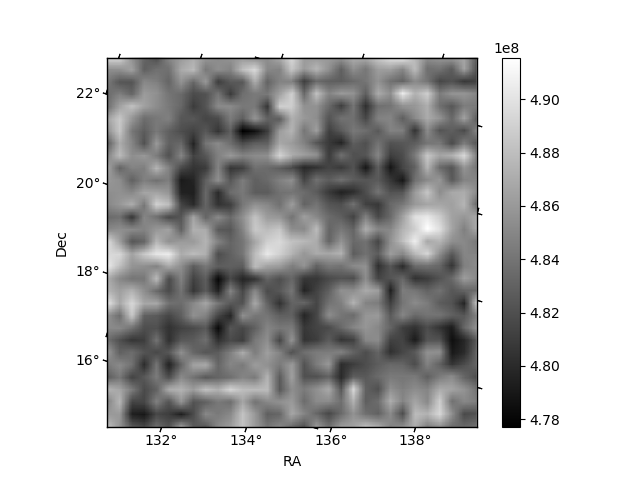
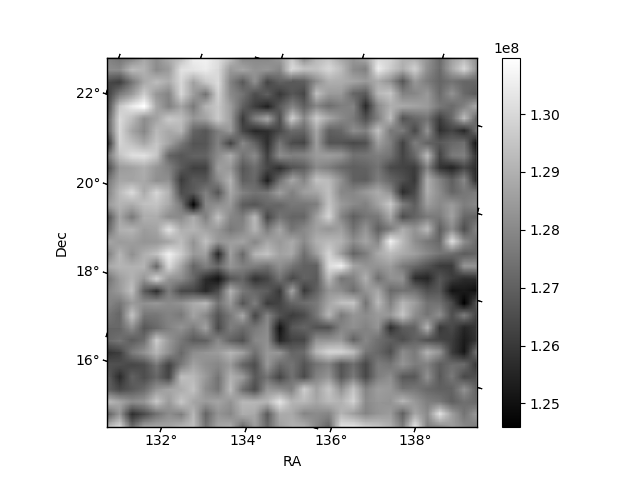
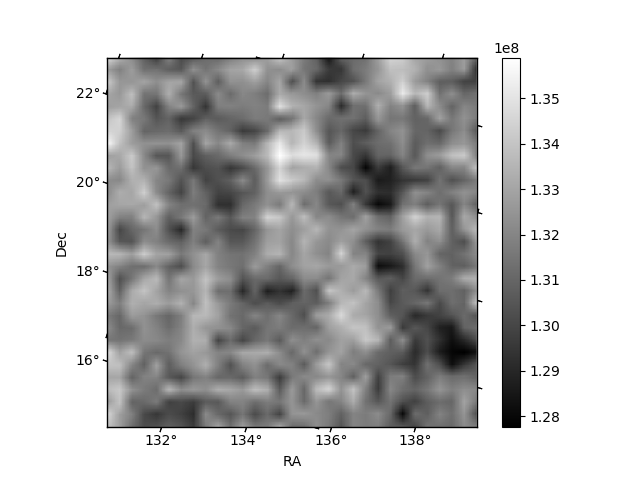
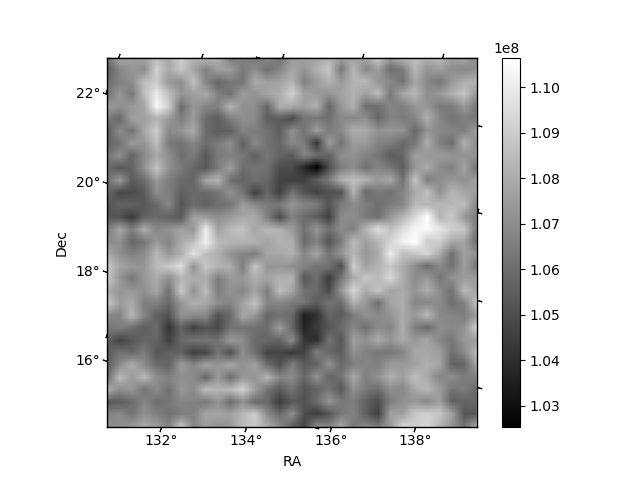
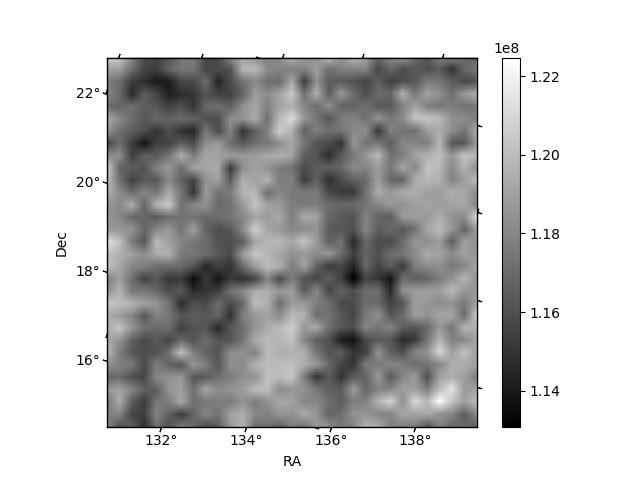
Histogram calculated using DETX and DETY for each event in the final _common_clean file
| Quadrant A | 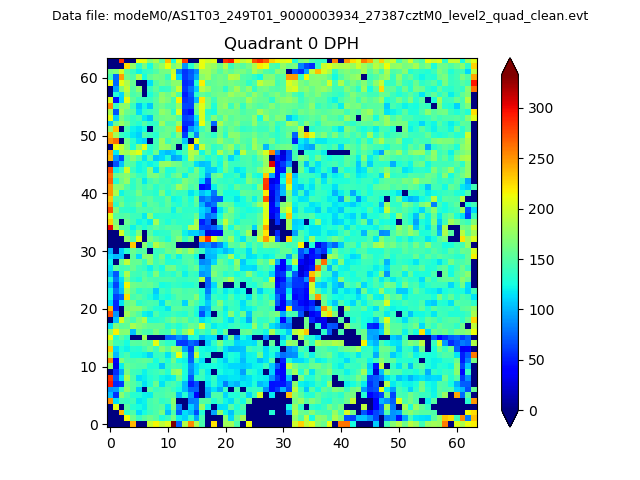 |
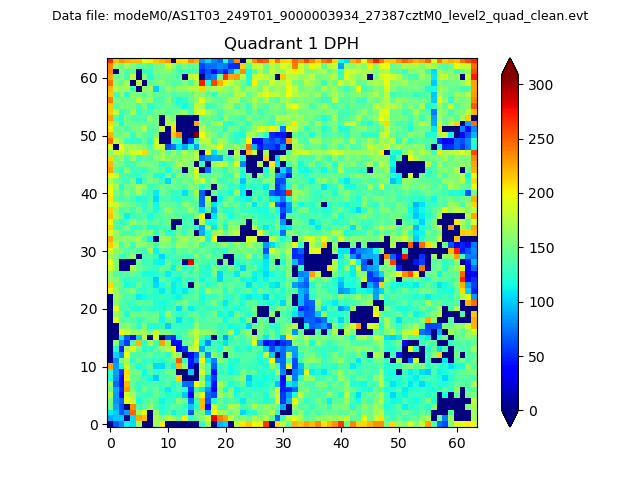 |
Quadrant B |
|---|---|---|---|
| Quadrant D | 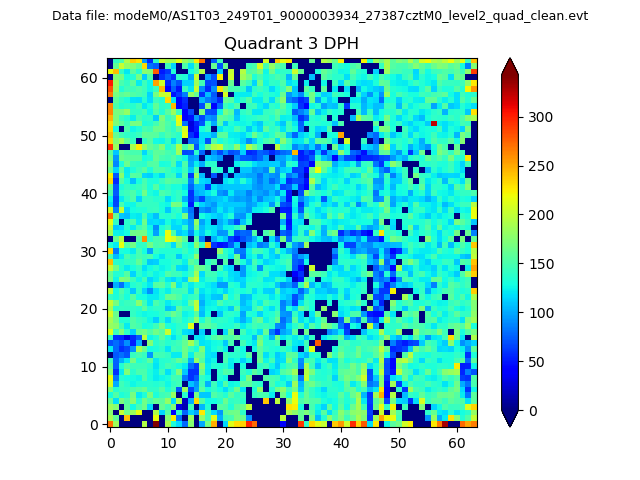 |
 |
Quadrant C |
| Plot type | Count rate plots | Images |
|---|---|---|
| Comparison with Poisson distribution Blue bars denote a histogram of data divided into 1 sec bins. Red curve is a Poisson curve with rate = median count rate of data. |
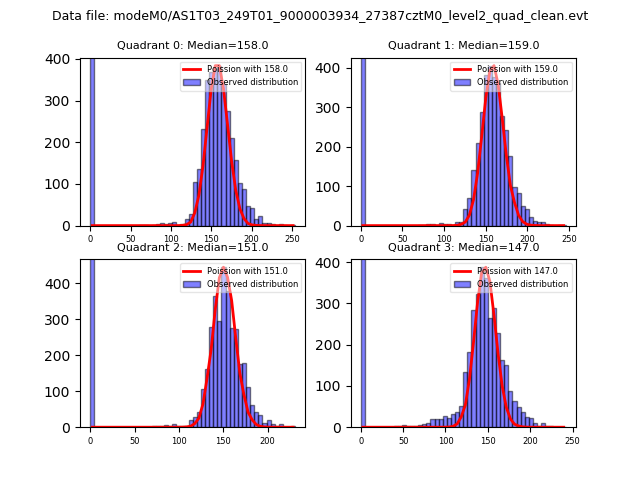 |
 |
| Quadrant-wise count rates Data is divided into 100 sec bins |
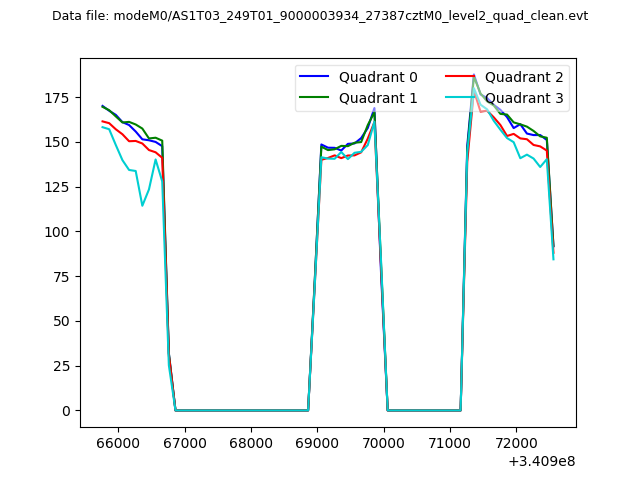 |
|
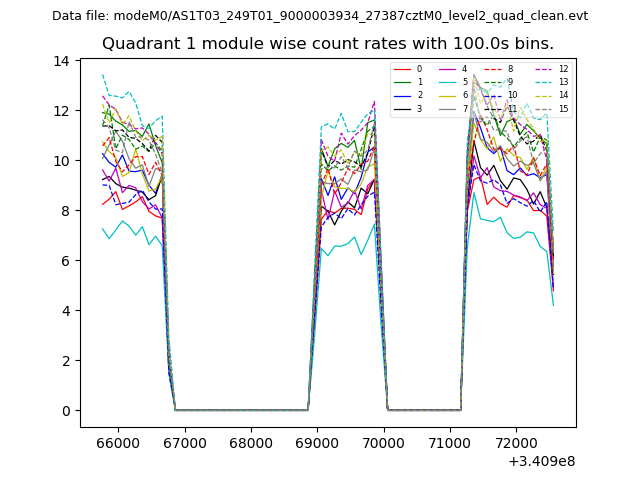
| Module-wise count rates for Quadrant A Data is divided into 100 sec bins |
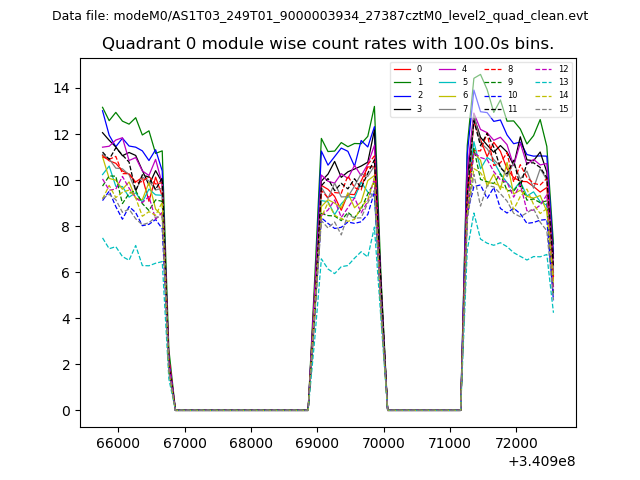 |
 |
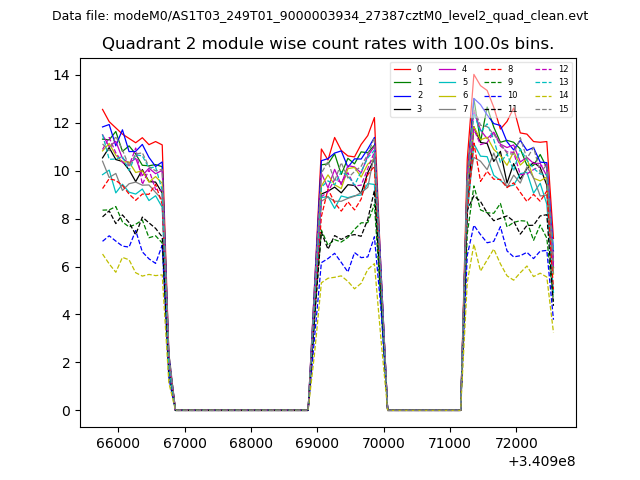
| Module-wise count rates for Quadrant B Data is divided into 100 sec bins |
 |
 |
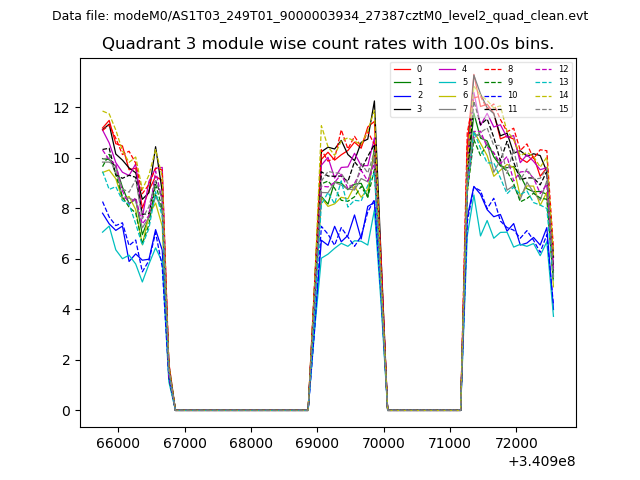
| Module-wise count rates for Quadrant C Data is divided into 100 sec bins |
 |
 |
| Module-wise count rates for Quadrant D Data is divided into 100 sec bins |
 |
 |
| Parameter | Plot |
|---|---|
| CZT HV Monitor | 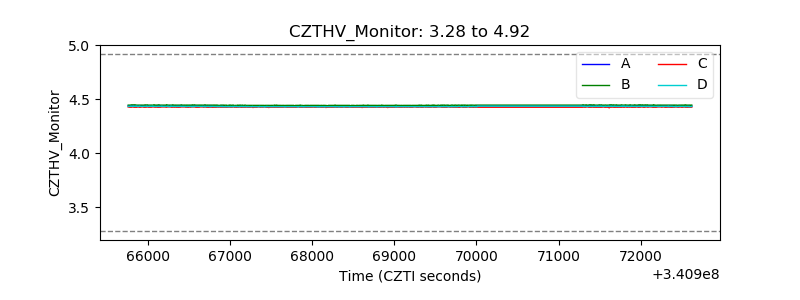 |
| D_VDD | 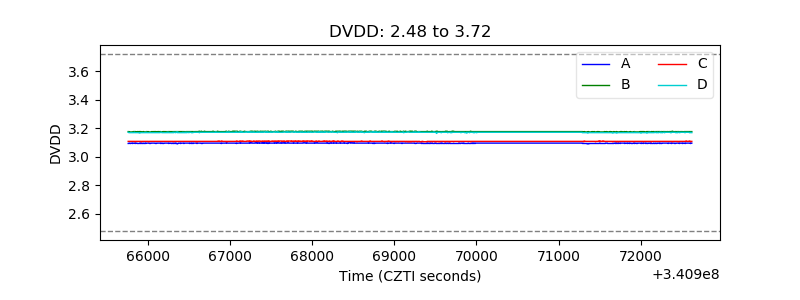 |
| Temperature 1 | 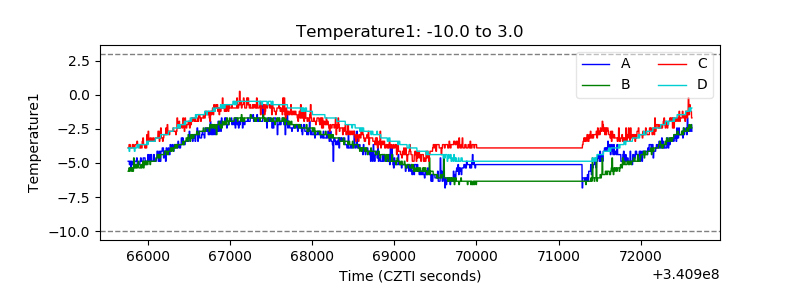 |
| Veto HV Monitor | 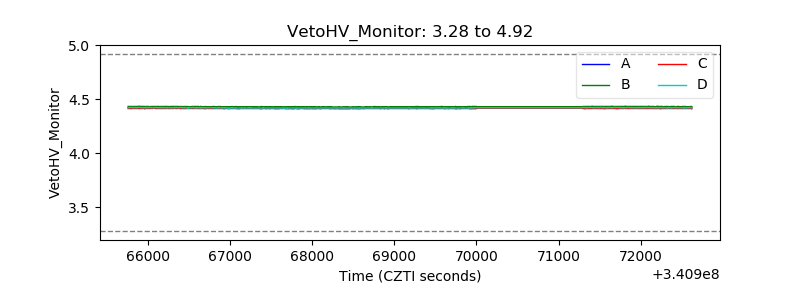 |
| Veto LLD | 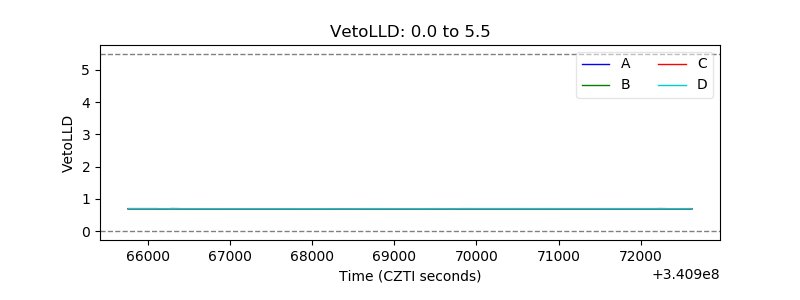 |
| Alpha Counter | 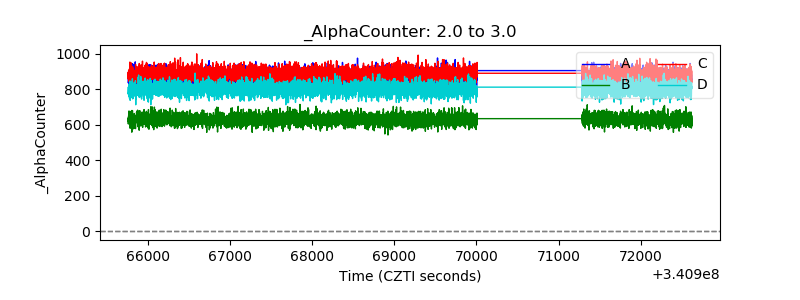 |
| _CPM_Rate | 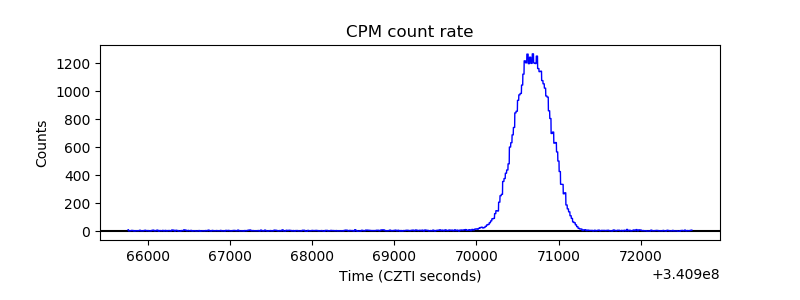 |
| CZT Counter | 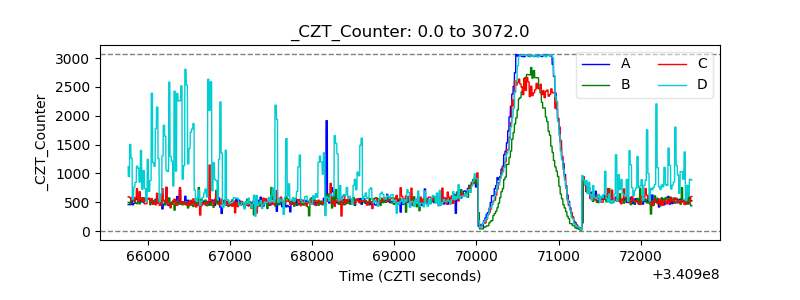 |
| +2.5 Volts monitor | 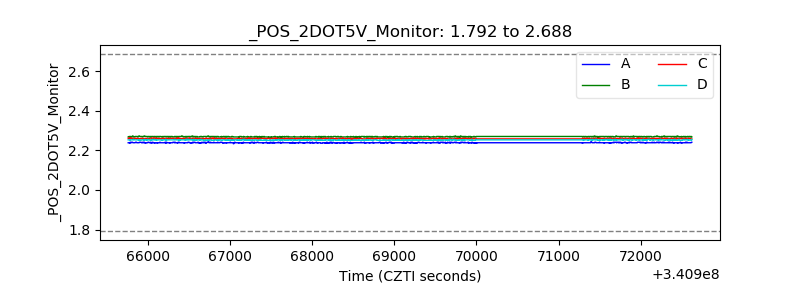 |
| +5 Volts monitor |  |
| _ROLL_ROT | 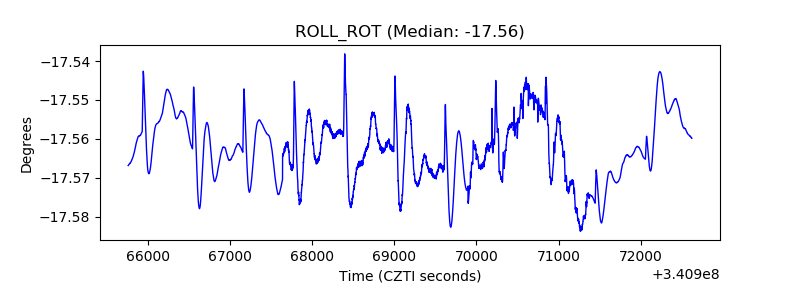 |
| _Roll_DEC | 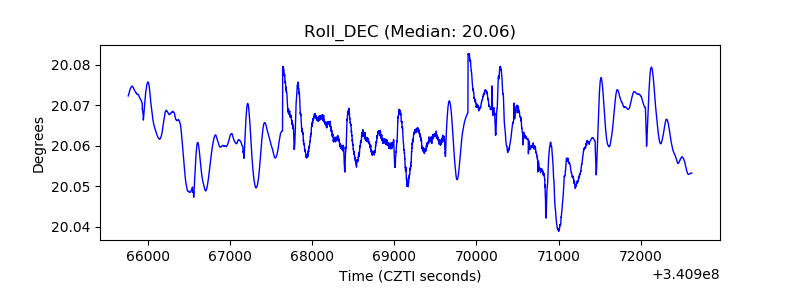 |
| _Roll_RA | 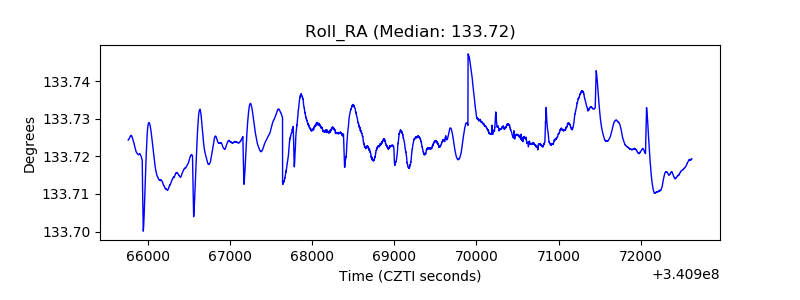 |
| Veto Counter | 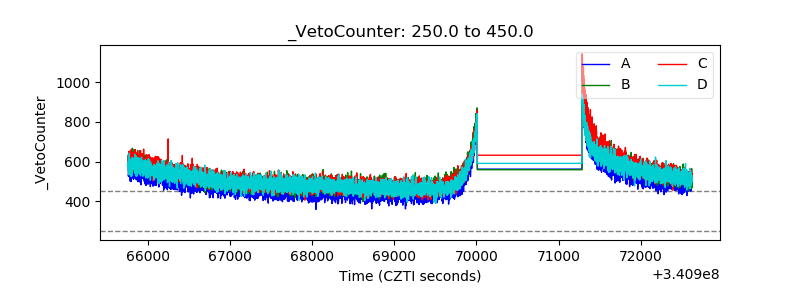 |