| Param | Original file | Final file |
|---|---|---|
| Filename | modeM0/AS1T03_249T01_9000003934_27388cztM0_level2.evt | modeM0/AS1T03_249T01_9000003934_27388cztM0_level2_quad_clean.evt |
| Size (bytes) | 489,634,560 | 75,677,760 |
| Size | 467.0 MB | 72.2 MB |
| Events in quadrant A | 2,988,374 | 483,353 |
| Events in quadrant B | 3,040,196 | 486,254 |
| Events in quadrant C | 3,556,472 | 462,504 |
| Events in quadrant D | 4,850,681 | 454,394 |
| Mode M0 | |||
|---|---|---|---|
| Quadrant | BADHDUFLAG | Total packets | Discarded packets |
| A | 0 | 12052 | 0 |
| B | 0 | 12246 | 0 |
| C | 0 | 13889 | 0 |
| D | 0 | 18315 | 0 |
| Mode M9 | |||
|---|---|---|---|
| Quadrant | BADHDUFLAG | Total packets | Discarded packets |
| A | 0 | 11 | 0 |
| B | 0 | 11 | 0 |
| C | 0 | 11 | 0 |
| D | 0 | 11 | 0 |
| Quadrant | Total seconds | Saturated seconds | Saturation percentage |
|---|---|---|---|
| A | 5788 | 82 | 1.416724% |
| B | 5789 | 93 | 1.606495% |
| C | 5788 | 202 | 3.489979% |
| D | 5788 | 259 | 4.474775% |
Noise dominated data is calculated using 1-second bins in cleaned event files. If a bin has >2000 counts, and if more than 50% of those come from <1% of pixels, then it is considered to be noise-dominated and hence unusable.
| Quadrant | # 1 sec bins | Bins with >0 counts | Bins with >2000 counts | High rate bins dominated by noise | Noise dominated (total time) | Noise dominated (detector-on time) | Marked lightcurve |
|---|---|---|---|---|---|---|---|
| A | 6938 | 5789 | 0 | 0 | 0.00% | 0.00% | 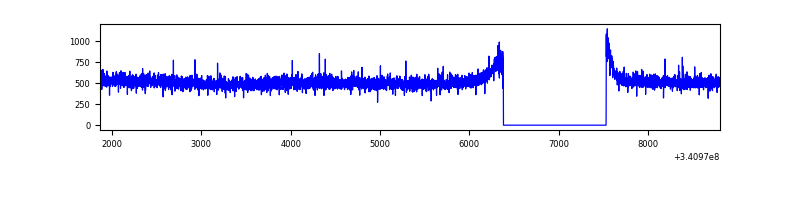 |
| B | 6939 | 5790 | 6 | 6 | 0.09% | 0.10% | 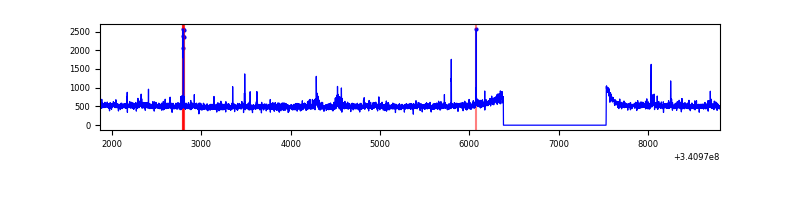 |
| C | 6938 | 5789 | 65 | 65 | 0.94% | 1.12% | 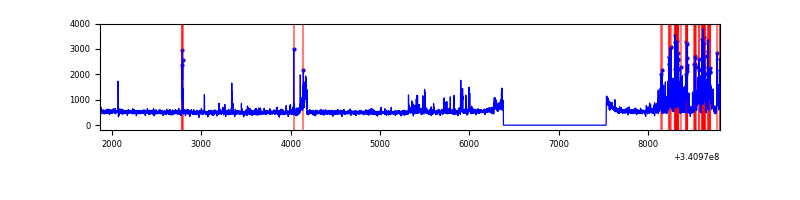 |
| D | 6938 | 5789 | 179 | 179 | 2.58% | 3.09% | 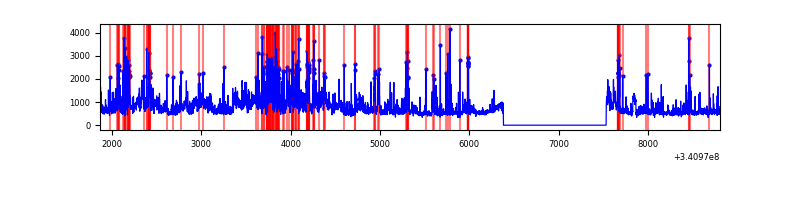 |
Top three noisy pixels from each quadrant. If the there are fewer than three noisy pixels in the level2.evt file, extra rows are filled as -1
| Pixel properties | Quadrant properties | ||||||
|---|---|---|---|---|---|---|---|
| Quadrant | DetID | PixID | Counts | Sigma | Mean | Median | Sigma |
| A | 13 | 254 | 9709 | 57.6 | 772 | 756 | 155.4 |
| A | 3 | 137 | 7026 | 40.34 | 772 | 756 | 155.4 |
| A | 0 | 226 | 6898 | 39.52 | 772 | 756 | 155.4 |
| B | 4 | 52 | 31543 | 215.32 | 755 | 737 | 143.1 |
| B | 0 | 229 | 17803 | 119.28 | 755 | 737 | 143.1 |
| B | 12 | 111 | 16722 | 111.73 | 755 | 737 | 143.1 |
| C | 2 | 16 | 593010 | 3477.08 | 729 | 734 | 170.3 |
| C | 14 | 238 | 116880 | 681.86 | 729 | 734 | 170.3 |
| C | 13 | 61 | 5016 | 25.14 | 729 | 734 | 170.3 |
| D | 1 | 52 | 1836992 | 9392.11 | 733 | 722 | 195.5 |
| D | 2 | 250 | 120423 | 612.24 | 733 | 722 | 195.5 |
| D | 2 | 234 | 24614 | 122.2 | 733 | 722 | 195.5 |
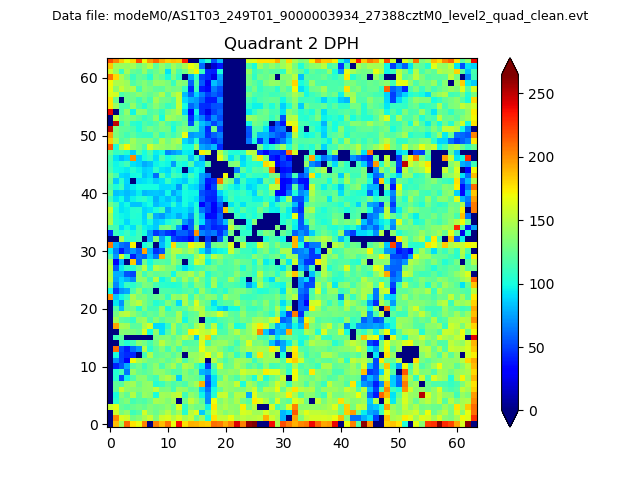
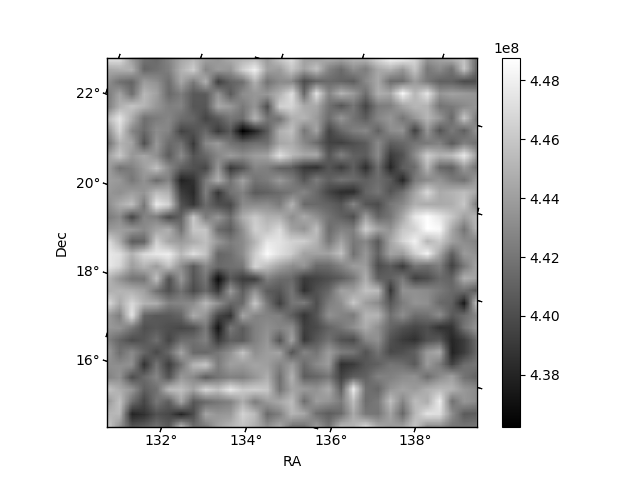
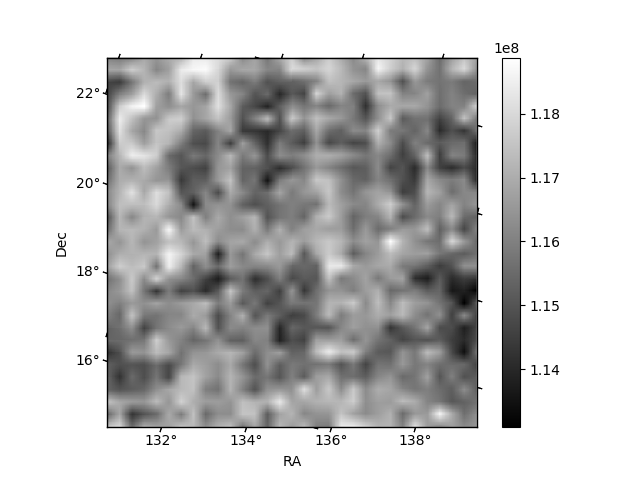
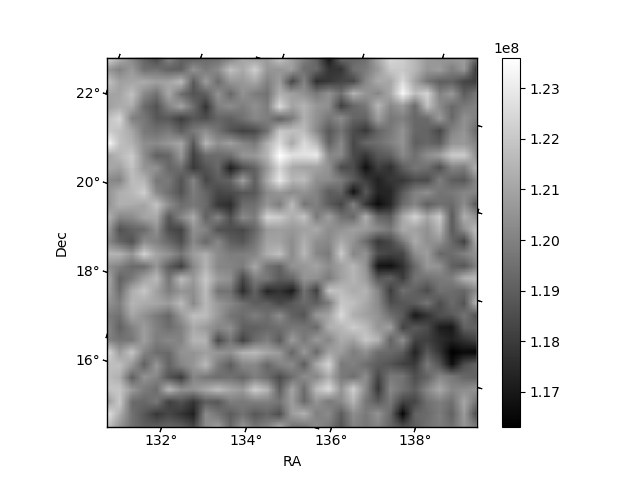
Histogram calculated using DETX and DETY for each event in the final _common_clean file
| Quadrant A | 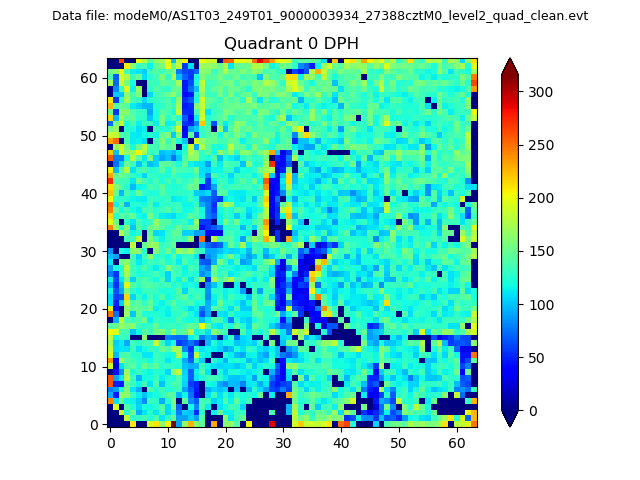 |
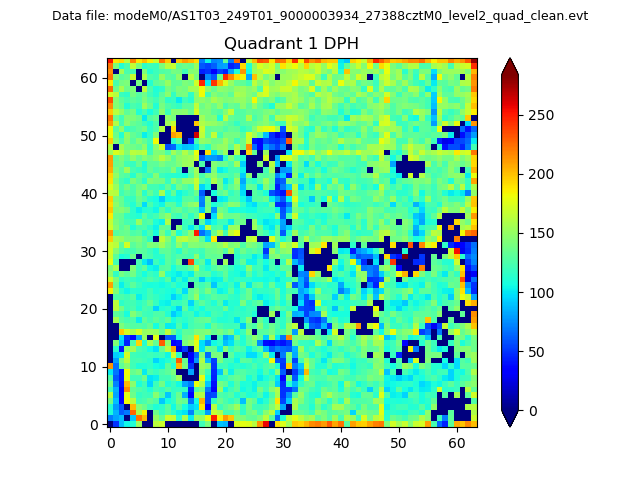 |
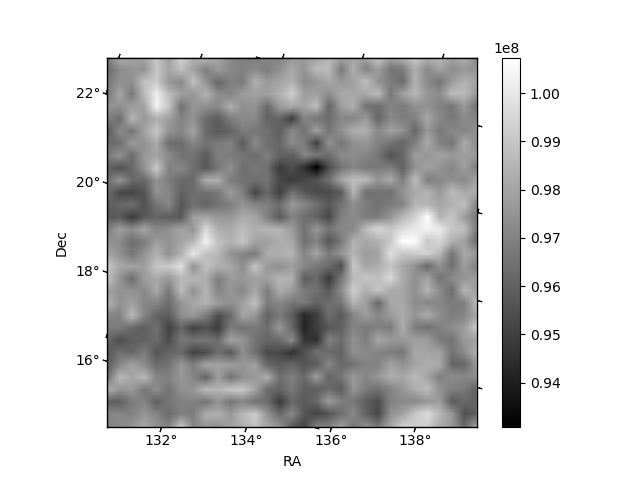
Quadrant B |
|---|---|---|---|
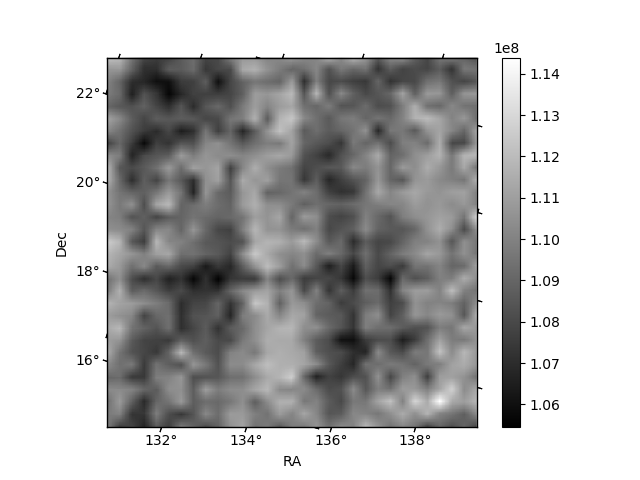
| Quadrant D | 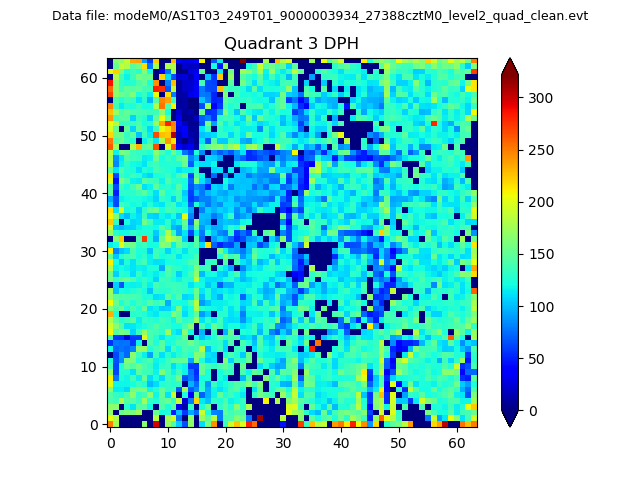 |
 |
Quadrant C |
| Plot type | Count rate plots | Images |
|---|---|---|
| Comparison with Poisson distribution Blue bars denote a histogram of data divided into 1 sec bins. Red curve is a Poisson curve with rate = median count rate of data. |
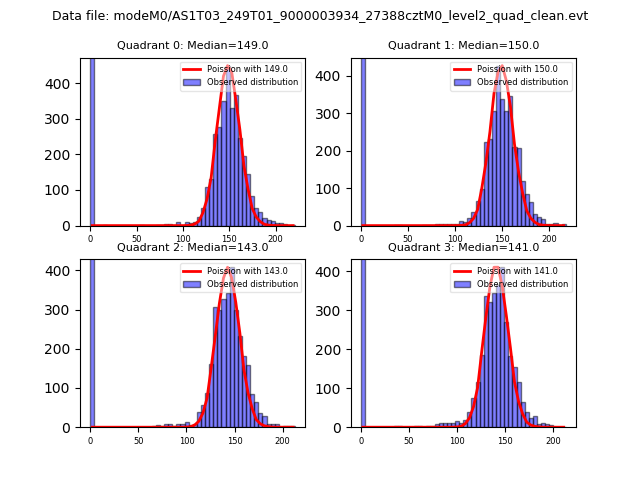 |
 |
| Quadrant-wise count rates Data is divided into 100 sec bins |
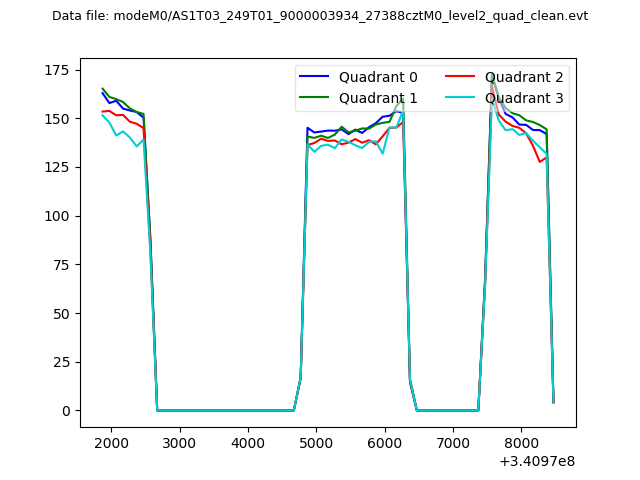 |
|
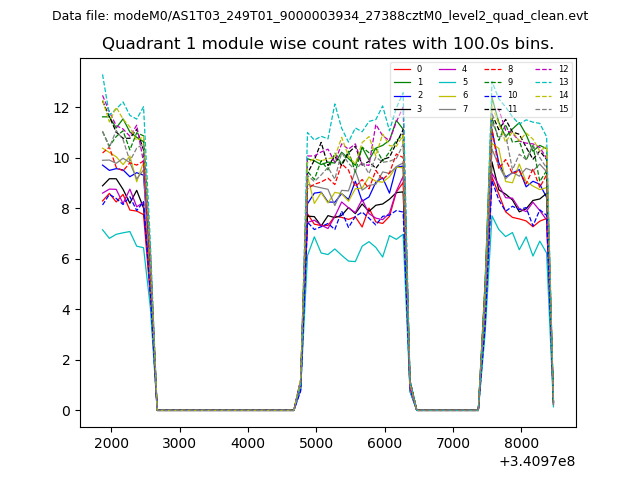
| Module-wise count rates for Quadrant A Data is divided into 100 sec bins |
 |
 |
| Module-wise count rates for Quadrant B Data is divided into 100 sec bins |
 |
 |
| Module-wise count rates for Quadrant C Data is divided into 100 sec bins |
 |
 |
| Module-wise count rates for Quadrant D Data is divided into 100 sec bins |
 |
 |
| Parameter | Plot |
|---|---|
| CZT HV Monitor | 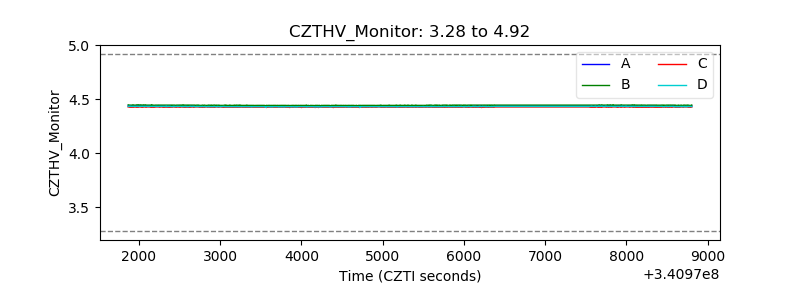 |
| D_VDD | 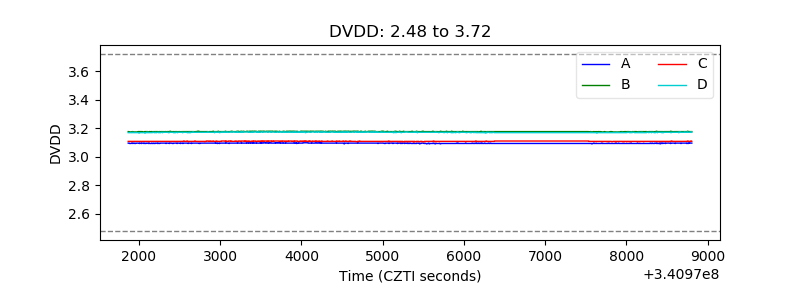 |
| Temperature 1 | 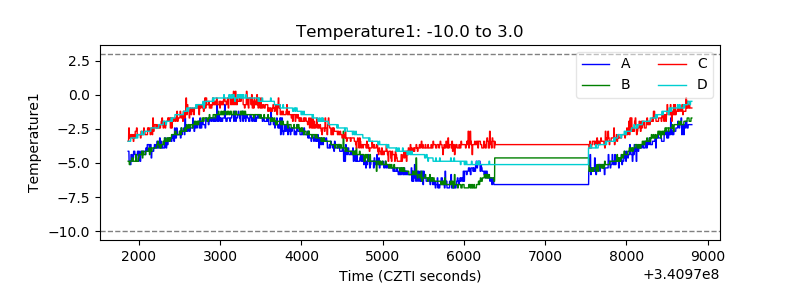 |
| Veto HV Monitor |  |
| Veto LLD | 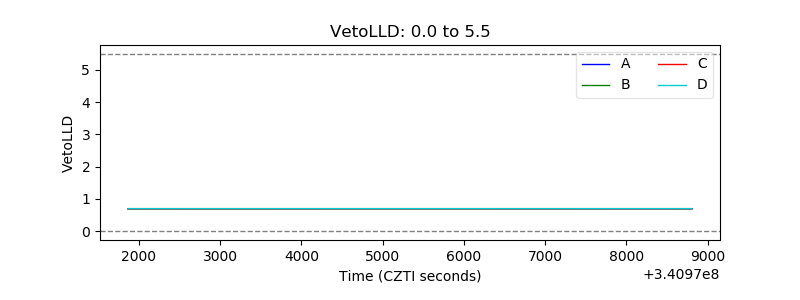 |
| Alpha Counter | 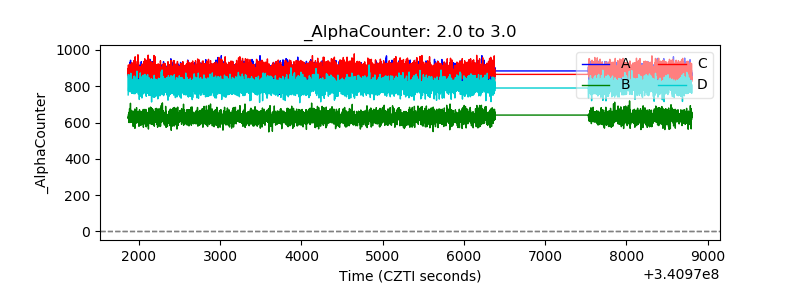 |
| _CPM_Rate | 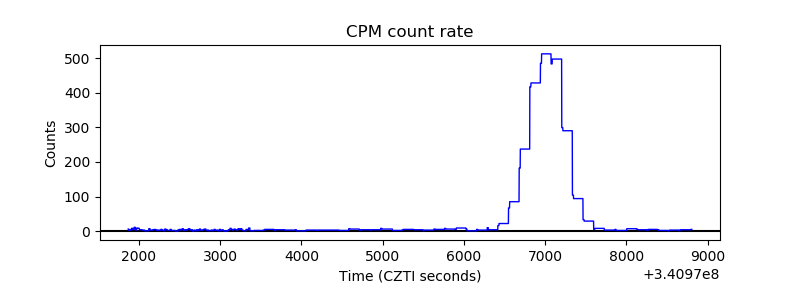 |
| CZT Counter | 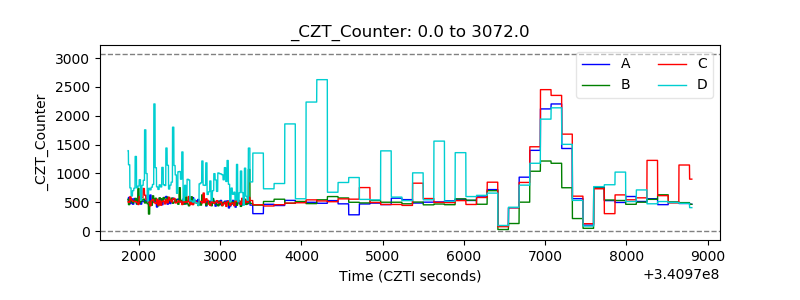 |
| +2.5 Volts monitor | 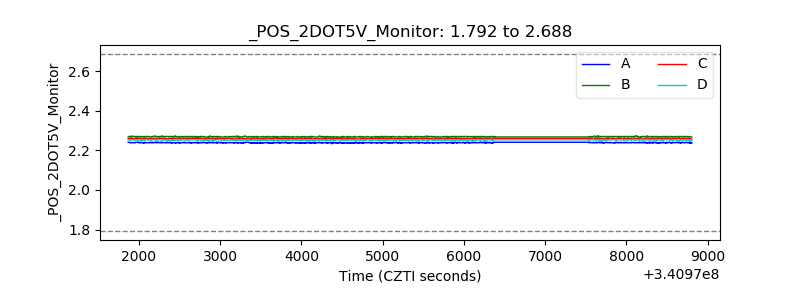 |
| +5 Volts monitor |  |
| _ROLL_ROT | 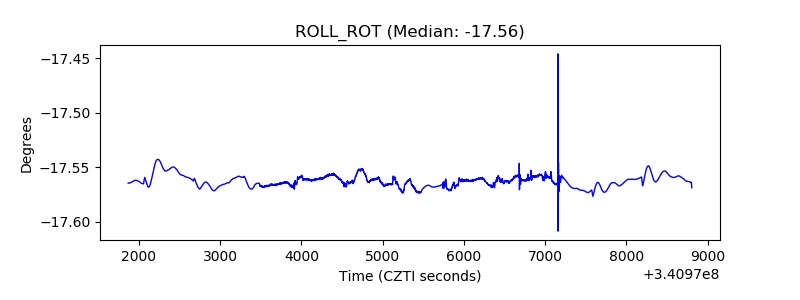 |
| _Roll_DEC |  |
| _Roll_RA | 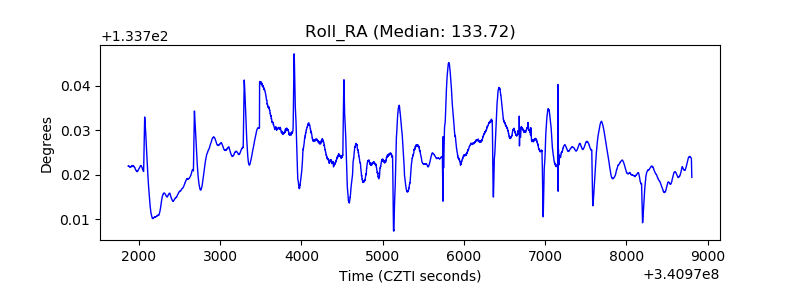 |
| Veto Counter | 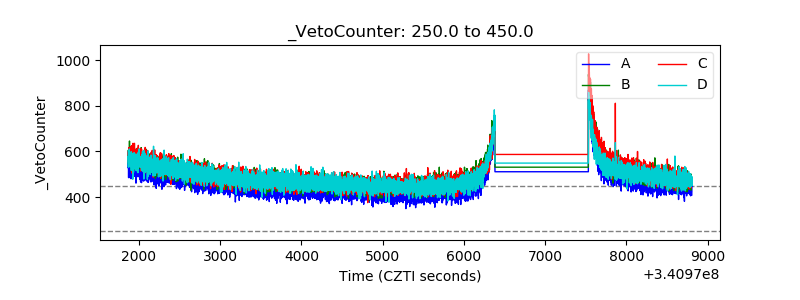 |