| Param | Original file | Final file |
|---|---|---|
| Filename | modeM0/AS1T03_249T01_9000003934_27389cztM0_level2.evt | modeM0/AS1T03_249T01_9000003934_27389cztM0_level2_quad_clean.evt |
| Size (bytes) | 497,710,080 | 72,599,040 |
| Size | 474.7 MB | 69.2 MB |
| Events in quadrant A | 3,160,296 | 451,148 |
| Events in quadrant B | 3,214,079 | 450,376 |
| Events in quadrant C | 3,673,864 | 429,511 |
| Events in quadrant D | 4,595,498 | 425,424 |
| Mode M0 | |||
|---|---|---|---|
| Quadrant | BADHDUFLAG | Total packets | Discarded packets |
| A | 0 | 13076 | 0 |
| B | 0 | 13231 | 0 |
| C | 0 | 14707 | 0 |
| D | 0 | 17772 | 0 |
| Mode M9 | |||
|---|---|---|---|
| Quadrant | BADHDUFLAG | Total packets | Discarded packets |
| A | 0 | 8 | 0 |
| B | 0 | 8 | 0 |
| C | 0 | 8 | 0 |
| D | 0 | 8 | 0 |
| Quadrant | Total seconds | Saturated seconds | Saturation percentage |
|---|---|---|---|
| A | 6322 | 105 | 1.660867% |
| B | 6323 | 115 | 1.818757% |
| C | 6323 | 241 | 3.811482% |
| D | 6323 | 358 | 5.661869% |
Noise dominated data is calculated using 1-second bins in cleaned event files. If a bin has >2000 counts, and if more than 50% of those come from <1% of pixels, then it is considered to be noise-dominated and hence unusable.
| Quadrant | # 1 sec bins | Bins with >0 counts | Bins with >2000 counts | High rate bins dominated by noise | Noise dominated (total time) | Noise dominated (detector-on time) | Marked lightcurve |
|---|---|---|---|---|---|---|---|
| A | 7162 | 6322 | 0 | 0 | 0.00% | 0.00% | 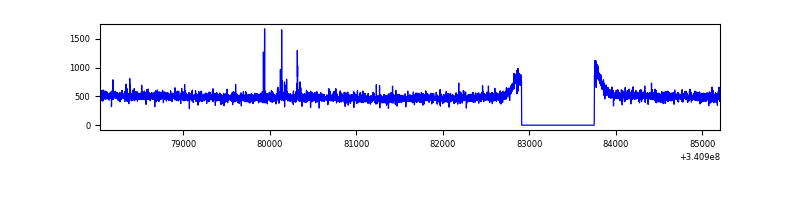 |
| B | 7163 | 6323 | 7 | 7 | 0.10% | 0.11% | 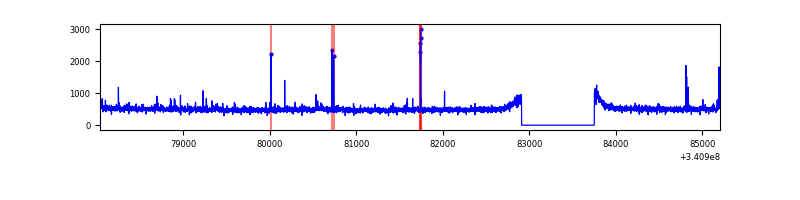 |
| C | 7163 | 6324 | 66 | 66 | 0.92% | 1.04% | 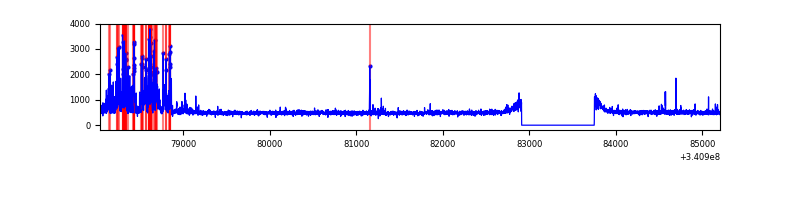 |
| D | 7163 | 6323 | 246 | 246 | 3.43% | 3.89% | 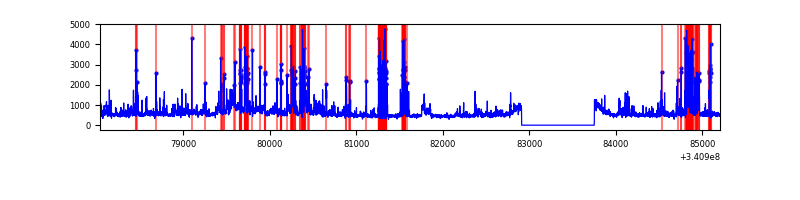 |
Top three noisy pixels from each quadrant. If the there are fewer than three noisy pixels in the level2.evt file, extra rows are filled as -1
| Pixel properties | Quadrant properties | ||||||
|---|---|---|---|---|---|---|---|
| Quadrant | DetID | PixID | Counts | Sigma | Mean | Median | Sigma |
| A | 12 | 96 | 20572 | 121.03 | 812 | 797 | 163.4 |
| A | 13 | 254 | 10385 | 58.68 | 812 | 797 | 163.4 |
| A | 3 | 137 | 7551 | 41.34 | 812 | 797 | 163.4 |
| B | 15 | 33 | 25828 | 164.23 | 797 | 774 | 152.6 |
| B | 4 | 52 | 20169 | 127.13 | 797 | 774 | 152.6 |
| B | 12 | 111 | 18590 | 116.78 | 797 | 774 | 152.6 |
| C | 2 | 16 | 517650 | 2850.65 | 773 | 778 | 181.3 |
| C | 14 | 238 | 122400 | 670.77 | 773 | 778 | 181.3 |
| C | 10 | 22 | 16292 | 85.56 | 773 | 778 | 181.3 |
| D | 1 | 52 | 1030523 | 5565.51 | 775 | 754 | 185.0 |
| D | 12 | 227 | 258436 | 1392.67 | 775 | 754 | 185.0 |
| D | 2 | 250 | 210775 | 1135.08 | 775 | 754 | 185.0 |
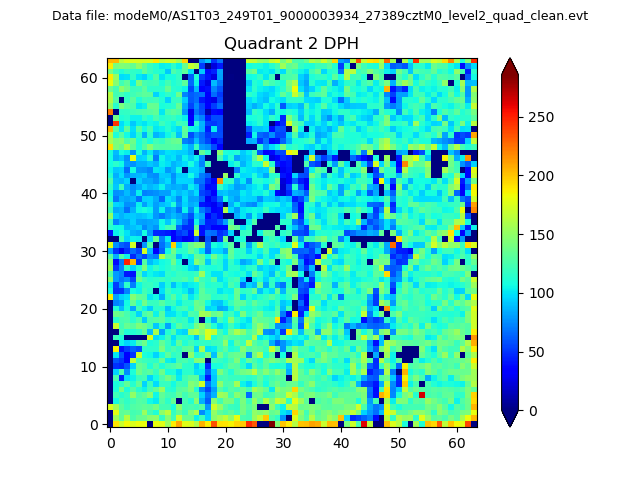
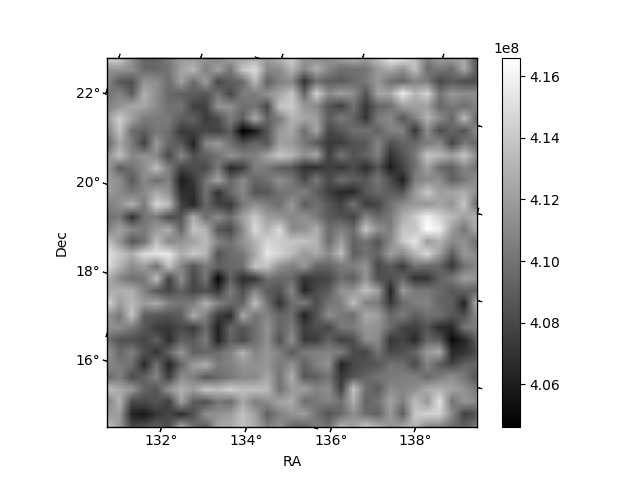
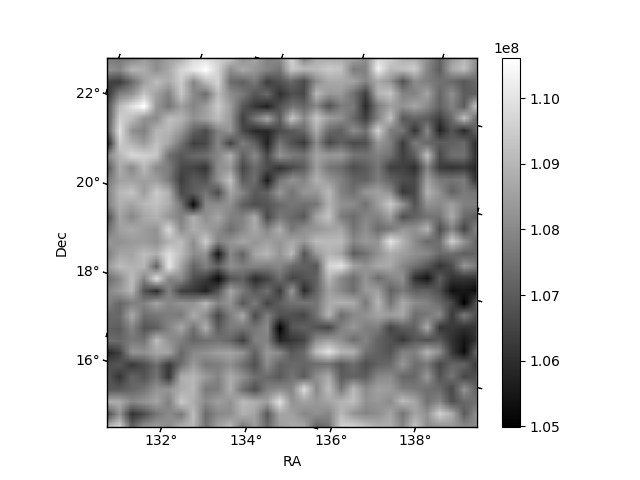
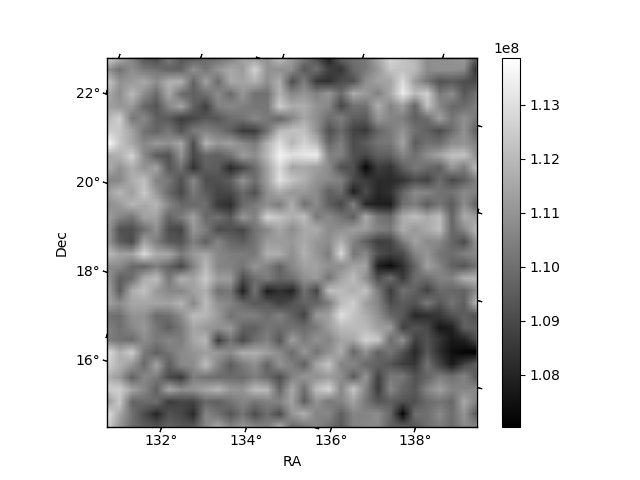
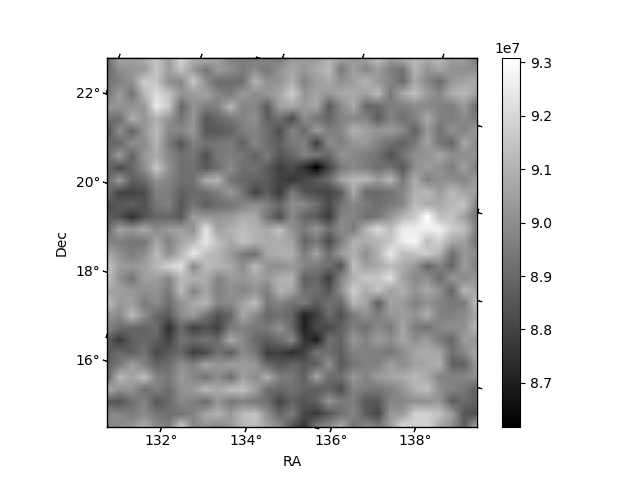
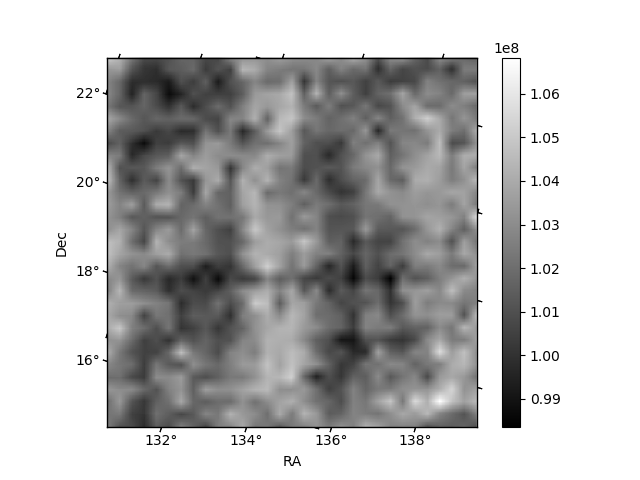
Histogram calculated using DETX and DETY for each event in the final _common_clean file
| Quadrant A | 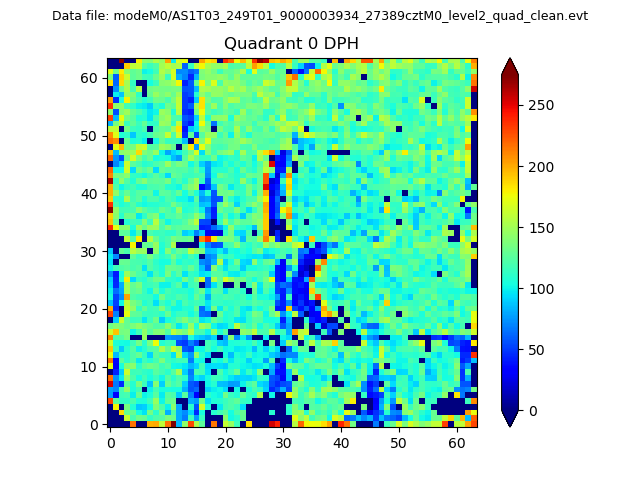 |
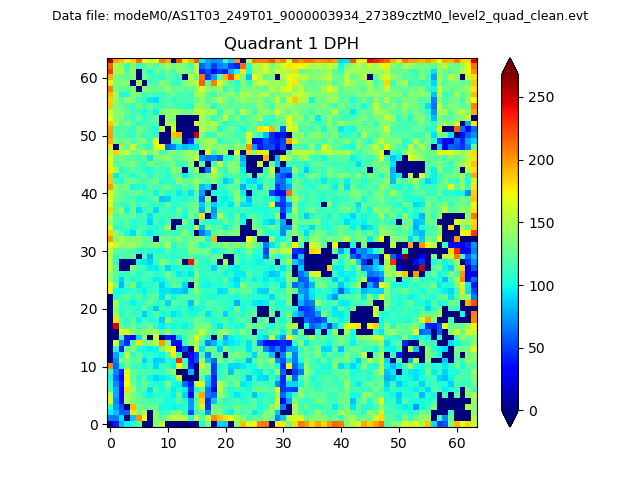 |
Quadrant B |
|---|---|---|---|
| Quadrant D | 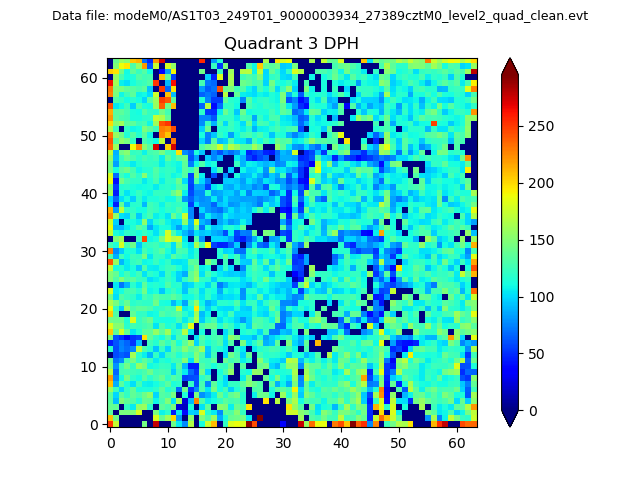 |
 |
Quadrant C |
| Plot type | Count rate plots | Images |
|---|---|---|
| Comparison with Poisson distribution Blue bars denote a histogram of data divided into 1 sec bins. Red curve is a Poisson curve with rate = median count rate of data. |
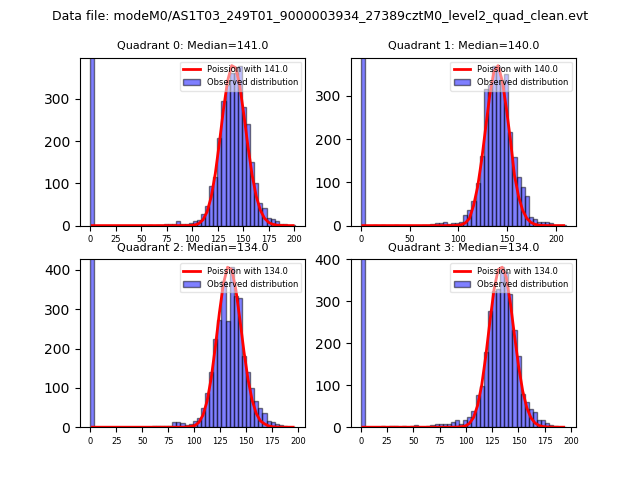 |
 |
| Quadrant-wise count rates Data is divided into 100 sec bins |
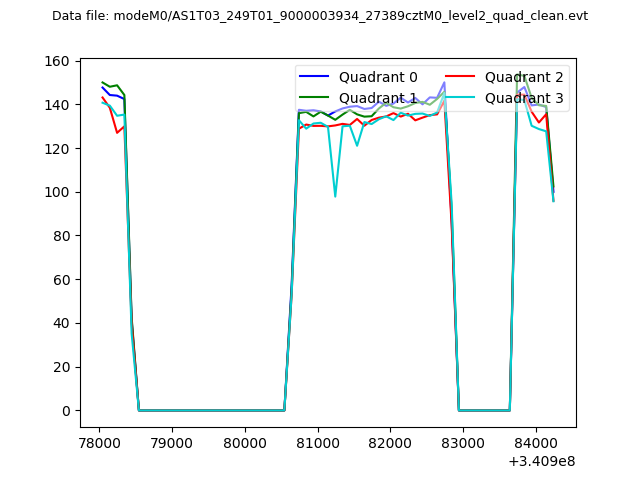 |
|
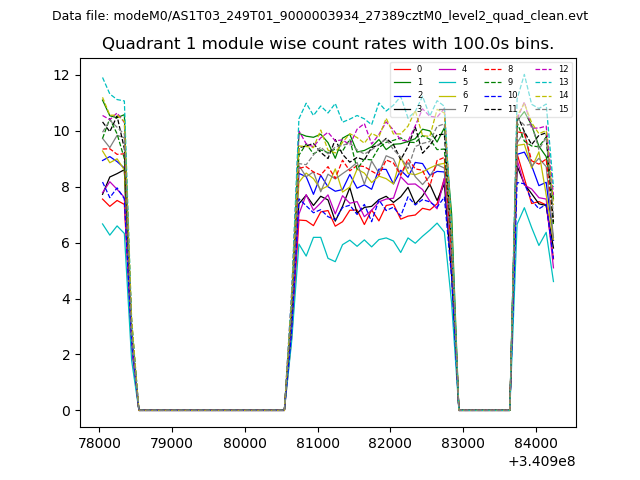
| Module-wise count rates for Quadrant A Data is divided into 100 sec bins |
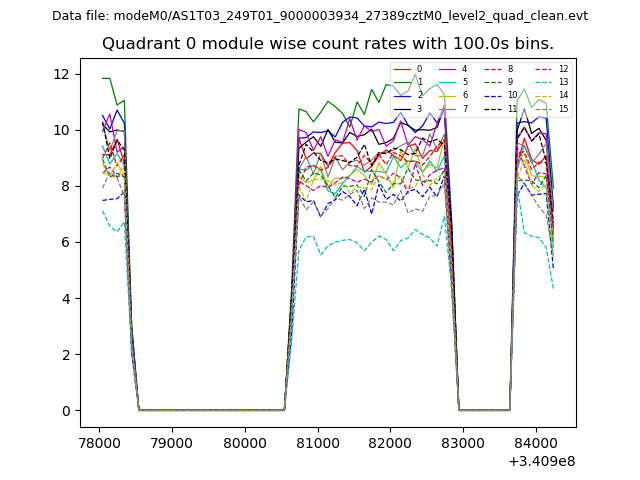 |
 |
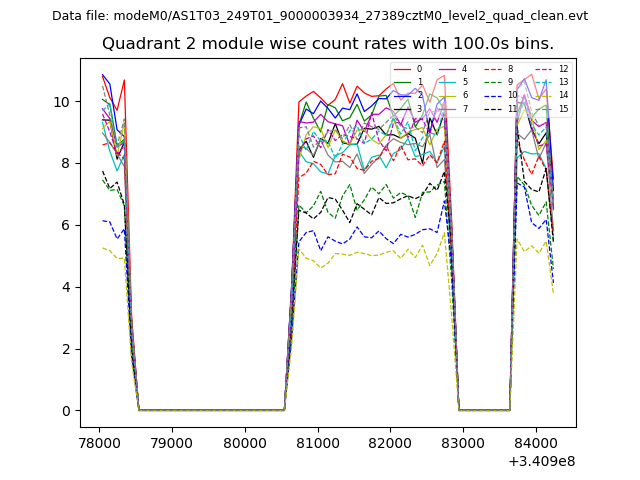
| Module-wise count rates for Quadrant B Data is divided into 100 sec bins |
 |
 |
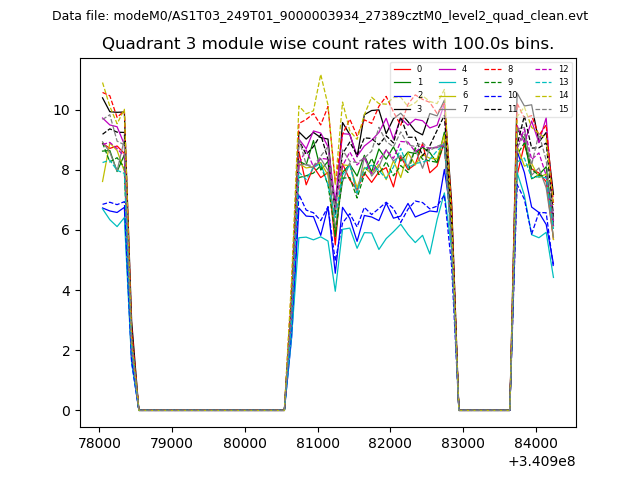
| Module-wise count rates for Quadrant C Data is divided into 100 sec bins |
 |
 |
| Module-wise count rates for Quadrant D Data is divided into 100 sec bins |
 |
 |
| Parameter | Plot |
|---|---|
| CZT HV Monitor | 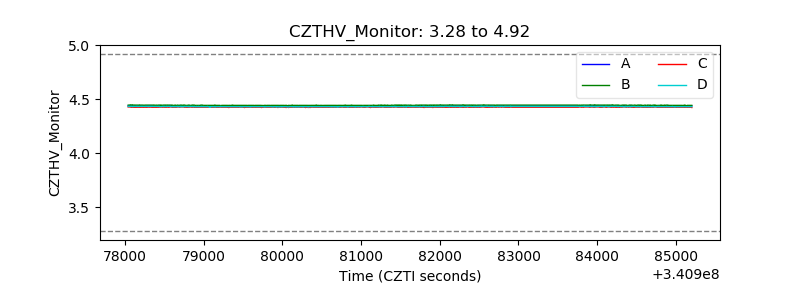 |
| D_VDD | 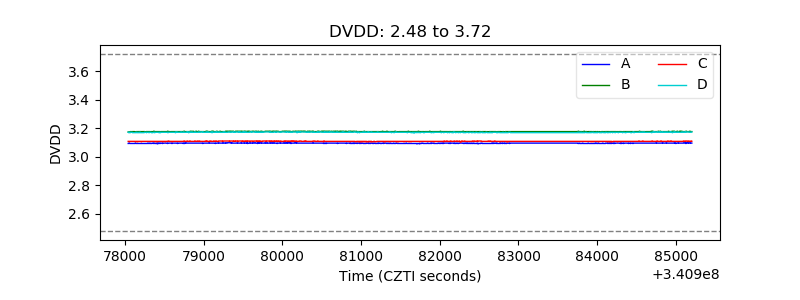 |
| Temperature 1 | 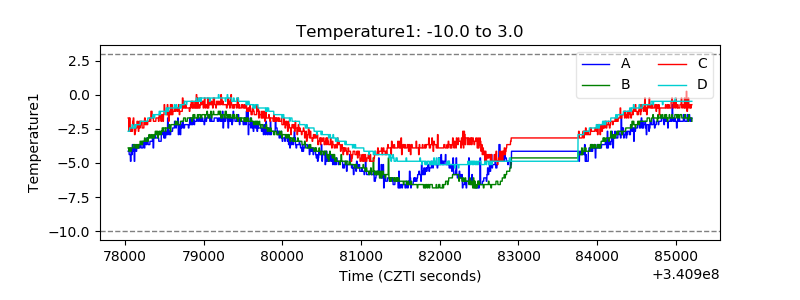 |
| Veto HV Monitor | 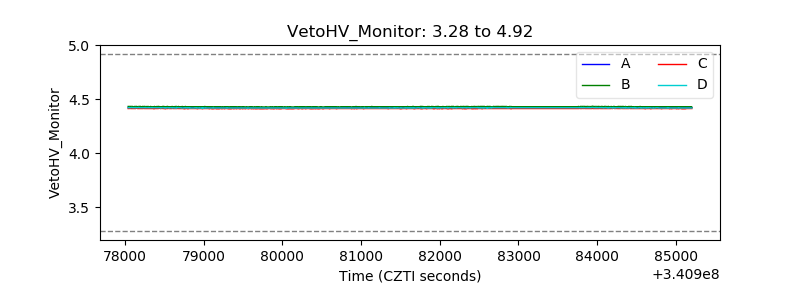 |
| Veto LLD | 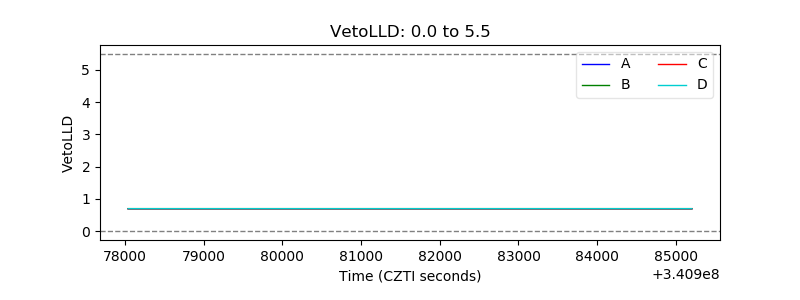 |
| Alpha Counter | 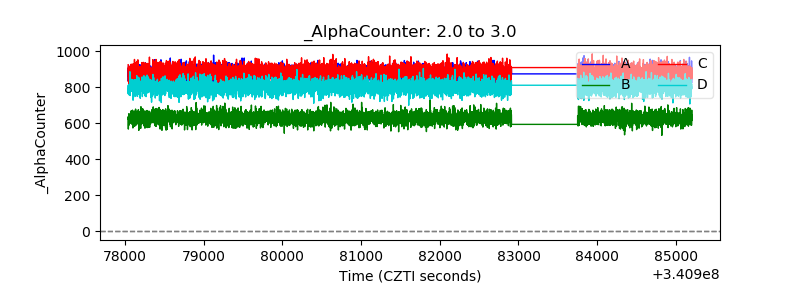 |
| _CPM_Rate | 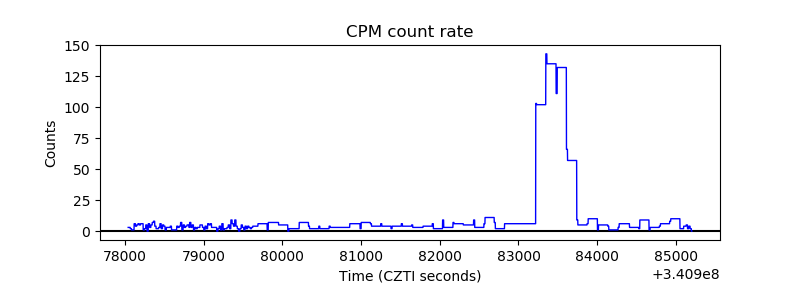 |
| CZT Counter | 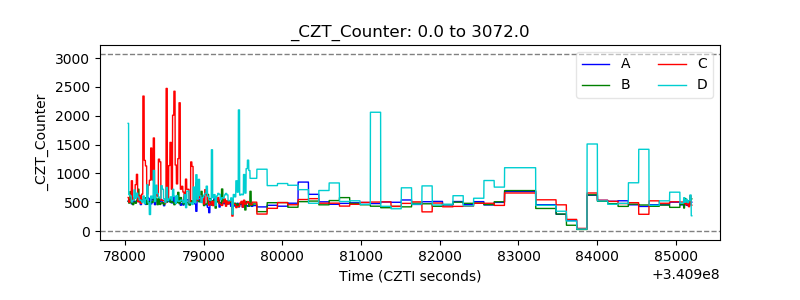 |
| +2.5 Volts monitor |  |
| +5 Volts monitor | 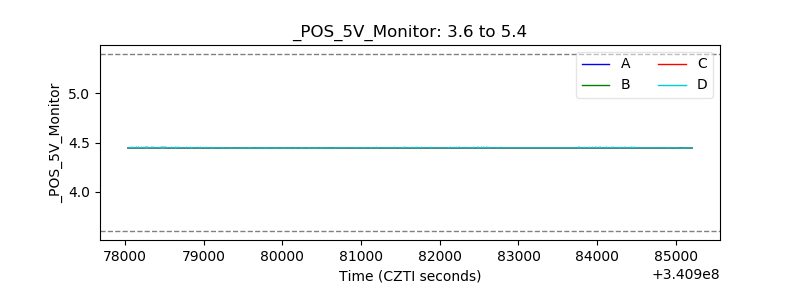 |
| _ROLL_ROT | 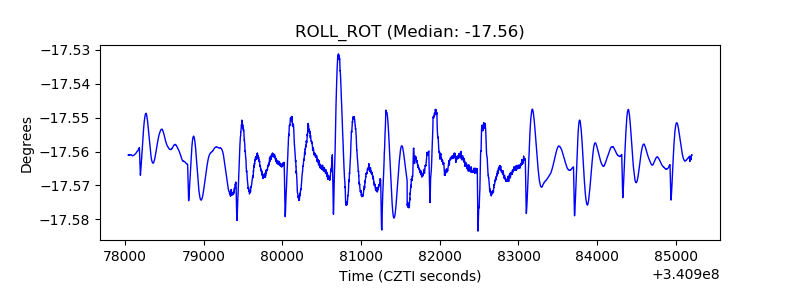 |
| _Roll_DEC | 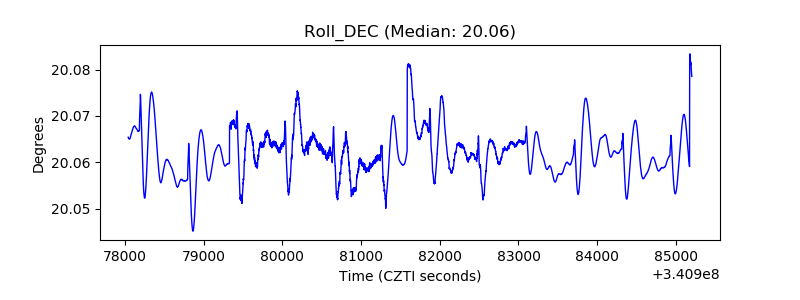 |
| _Roll_RA | 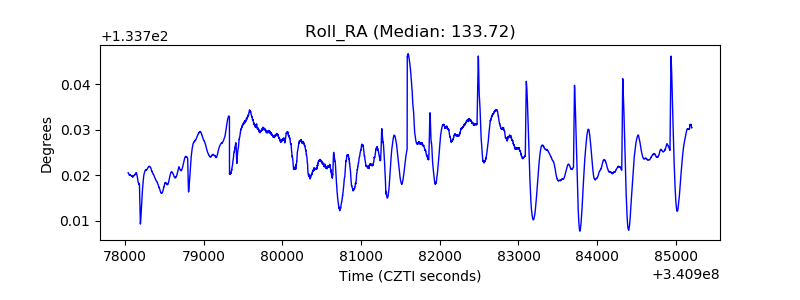 |
| Veto Counter | 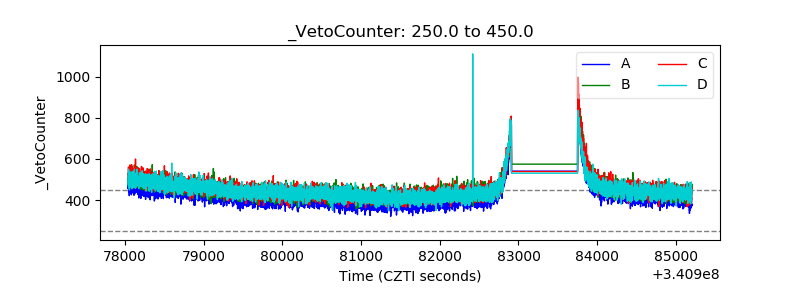 |