| Param | Original file | Final file |
|---|---|---|
| Filename | modeM0/AS1T03_249T01_9000003934_27390cztM0_level2.evt | modeM0/AS1T03_249T01_9000003934_27390cztM0_level2_quad_clean.evt |
| Size (bytes) | 542,381,760 | 81,979,200 |
| Size | 517.3 MB | 78.2 MB |
| Events in quadrant A | 3,618,266 | 506,893 |
| Events in quadrant B | 3,675,952 | 505,510 |
| Events in quadrant C | 4,031,305 | 481,807 |
| Events in quadrant D | 4,605,965 | 480,702 |
| Mode M0 | |||
|---|---|---|---|
| Quadrant | BADHDUFLAG | Total packets | Discarded packets |
| A | 0 | 15189 | 0 |
| B | 0 | 15317 | 0 |
| C | 0 | 16454 | 0 |
| D | 0 | 18344 | 0 |
| Mode M9 | |||
|---|---|---|---|
| Quadrant | BADHDUFLAG | Total packets | Discarded packets |
| A | 0 | 6 | 0 |
| B | 0 | 7 | 0 |
| C | 0 | 7 | 0 |
| D | 0 | 7 | 0 |
| Quadrant | Total seconds | Saturated seconds | Saturation percentage |
|---|---|---|---|
| A | 7284 | 134 | 1.839649% |
| B | 7284 | 168 | 2.306425% |
| C | 7283 | 279 | 3.830839% |
| D | 7283 | 311 | 4.270218% |
Noise dominated data is calculated using 1-second bins in cleaned event files. If a bin has >2000 counts, and if more than 50% of those come from <1% of pixels, then it is considered to be noise-dominated and hence unusable.
| Quadrant | # 1 sec bins | Bins with >0 counts | Bins with >2000 counts | High rate bins dominated by noise | Noise dominated (total time) | Noise dominated (detector-on time) | Marked lightcurve |
|---|---|---|---|---|---|---|---|
| A | 7754 | 7284 | 0 | 0 | 0.00% | 0.00% | 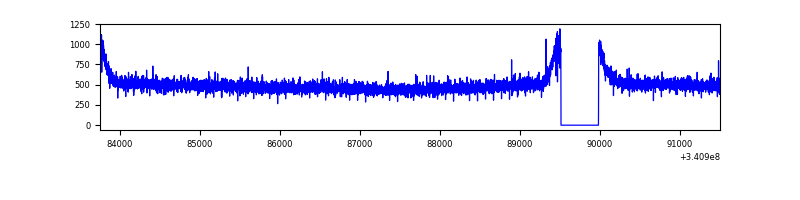 |
| B | 7754 | 7285 | 4 | 4 | 0.05% | 0.05% | 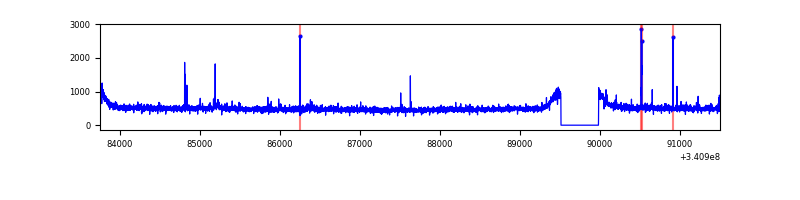 |
| C | 7753 | 7284 | 65 | 65 | 0.84% | 0.89% | 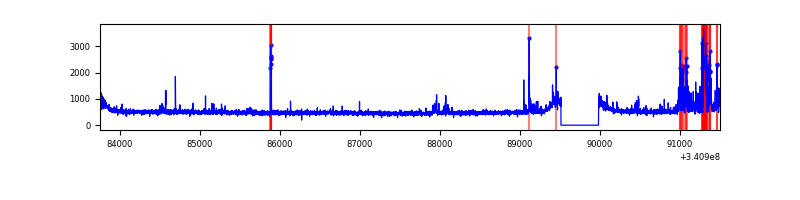 |
| D | 7753 | 7283 | 168 | 168 | 2.17% | 2.31% | 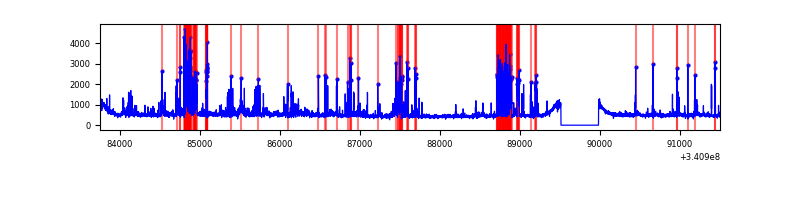 |
Top three noisy pixels from each quadrant. If the there are fewer than three noisy pixels in the level2.evt file, extra rows are filled as -1
| Pixel properties | Quadrant properties | ||||||
|---|---|---|---|---|---|---|---|
| Quadrant | DetID | PixID | Counts | Sigma | Mean | Median | Sigma |
| A | 13 | 254 | 11815 | 57.6 | 936 | 916 | 189.2 |
| A | 3 | 137 | 8976 | 42.59 | 936 | 916 | 189.2 |
| A | 0 | 226 | 7922 | 37.02 | 936 | 916 | 189.2 |
| B | 12 | 111 | 22108 | 119.39 | 920 | 897 | 177.7 |
| B | 11 | 111 | 19910 | 107.01 | 920 | 897 | 177.7 |
| B | 4 | 52 | 19091 | 102.41 | 920 | 897 | 177.7 |
| C | 2 | 16 | 425871 | 2030.28 | 885 | 891 | 209.3 |
| C | 14 | 238 | 139746 | 663.36 | 885 | 891 | 209.3 |
| C | 15 | 208 | 9185 | 39.62 | 885 | 891 | 209.3 |
| D | 1 | 52 | 868352 | 3993.95 | 902 | 879 | 217.2 |
| D | 2 | 250 | 180850 | 828.61 | 902 | 879 | 217.2 |
| D | 11 | 176 | 49879 | 225.6 | 902 | 879 | 217.2 |
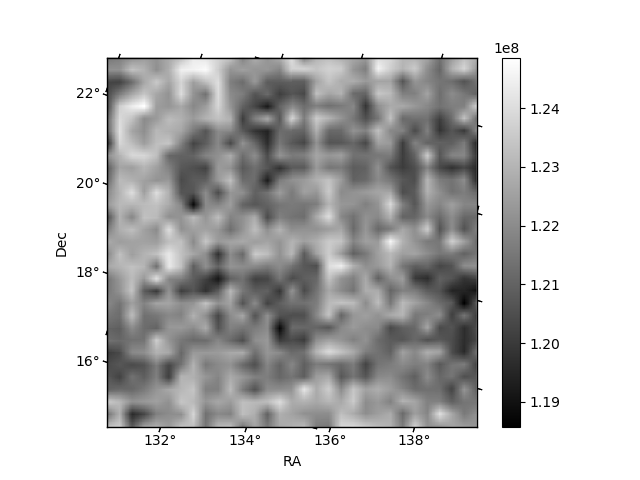
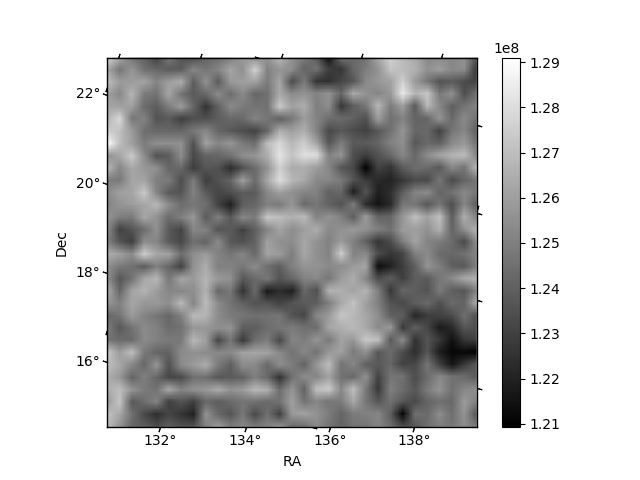
Histogram calculated using DETX and DETY for each event in the final _common_clean file
| Quadrant A | 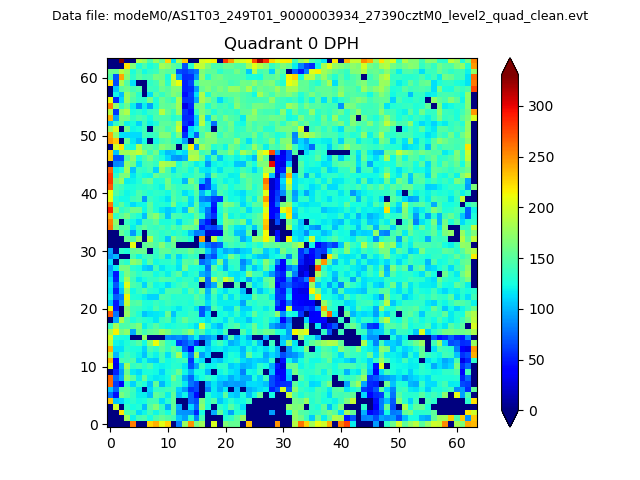 |
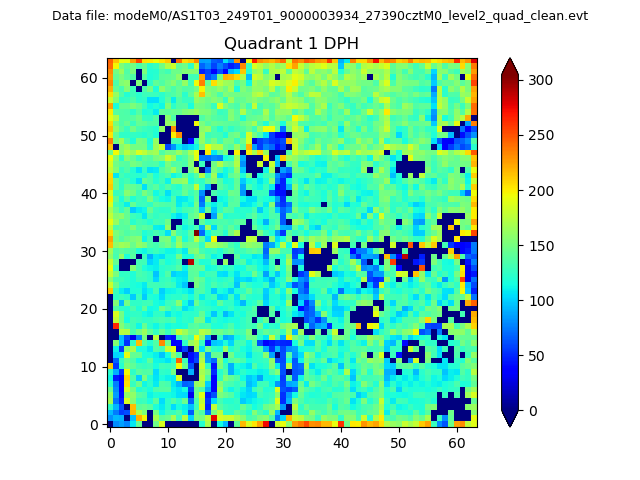 |
Quadrant B |
|---|---|---|---|
| Quadrant D |  |
 |
Quadrant C |
| Plot type | Count rate plots | Images |
|---|---|---|
| Comparison with Poisson distribution Blue bars denote a histogram of data divided into 1 sec bins. Red curve is a Poisson curve with rate = median count rate of data. |
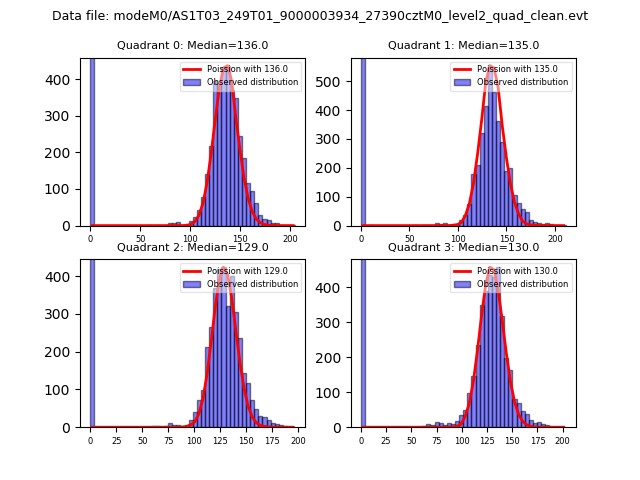 |
 |
| Quadrant-wise count rates Data is divided into 100 sec bins |
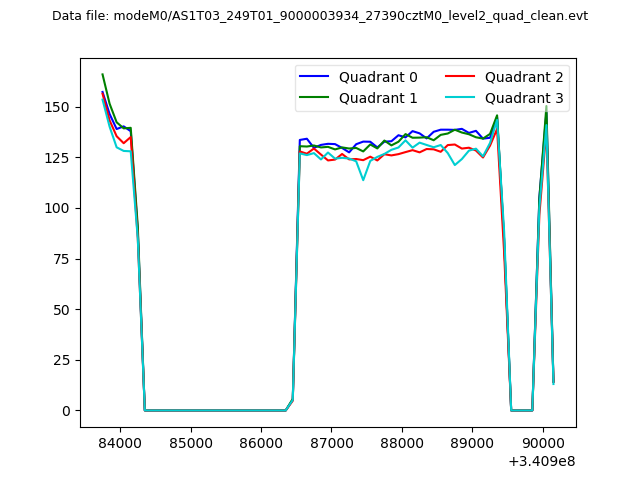 |
|
| Module-wise count rates for Quadrant A Data is divided into 100 sec bins |
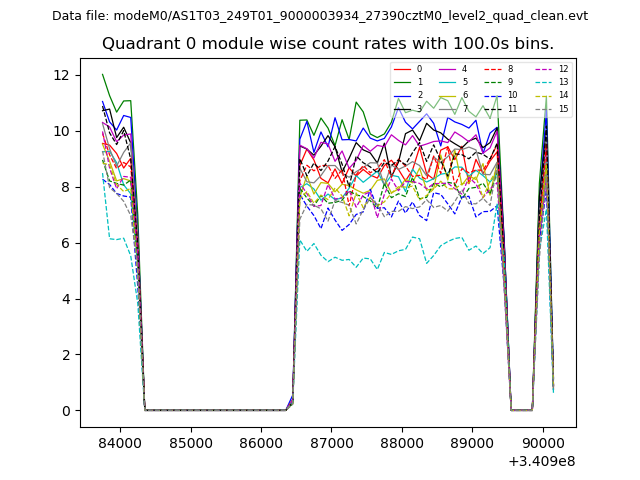 |
 |
| Module-wise count rates for Quadrant B Data is divided into 100 sec bins |
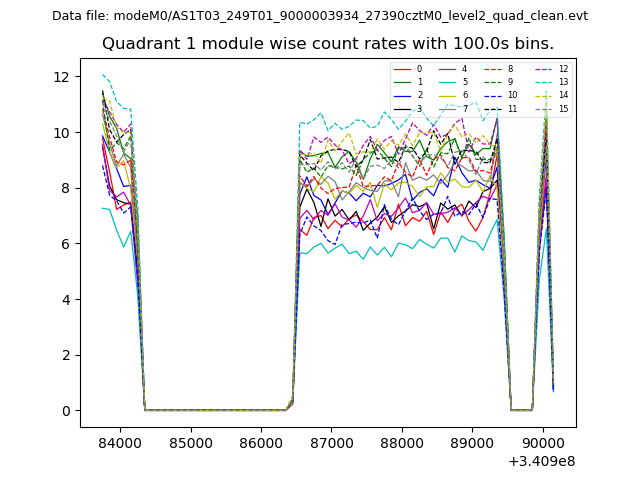 |
 |
| Module-wise count rates for Quadrant C Data is divided into 100 sec bins |
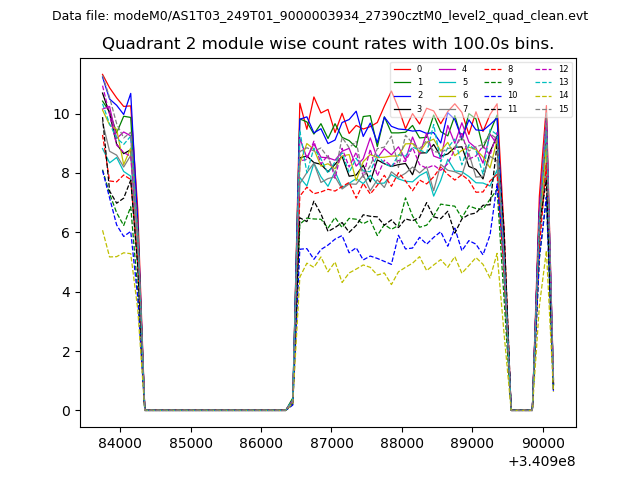 |
 |
| Module-wise count rates for Quadrant D Data is divided into 100 sec bins |
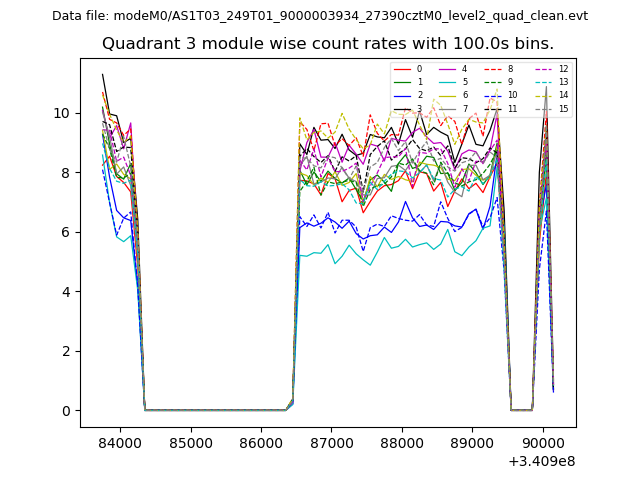 |
 |
| Parameter | Plot |
|---|---|
| CZT HV Monitor | 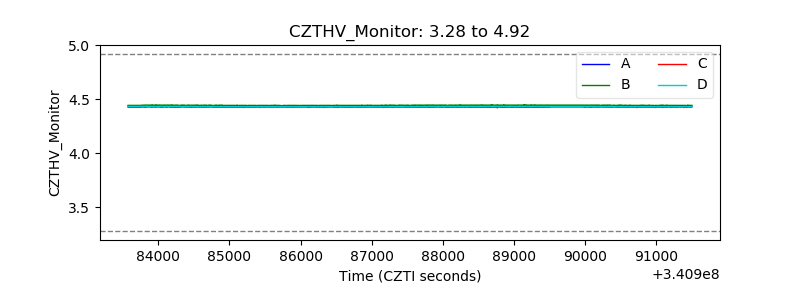 |
| D_VDD | 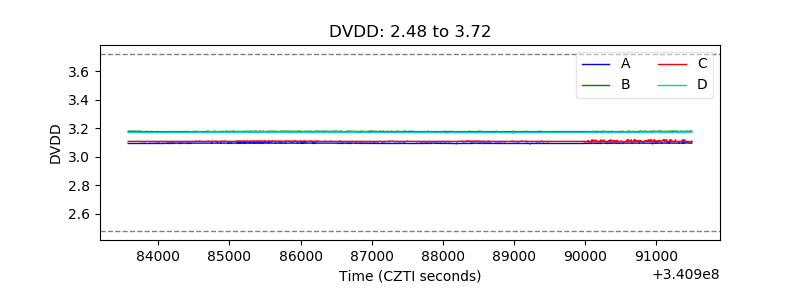 |
| Temperature 1 | 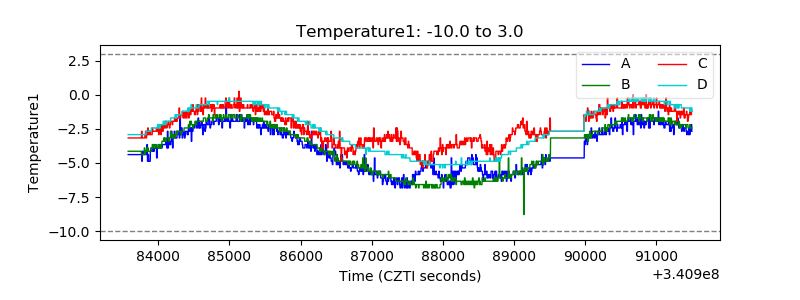 |
| Veto HV Monitor | 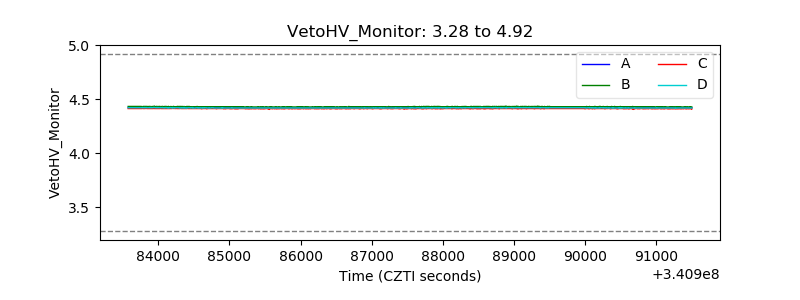 |
| Veto LLD | 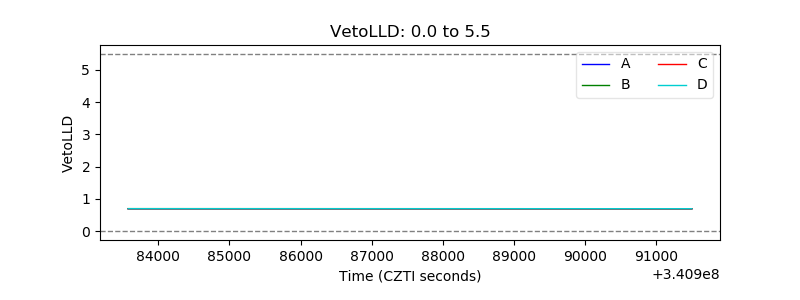 |
| Alpha Counter |  |
| _CPM_Rate | 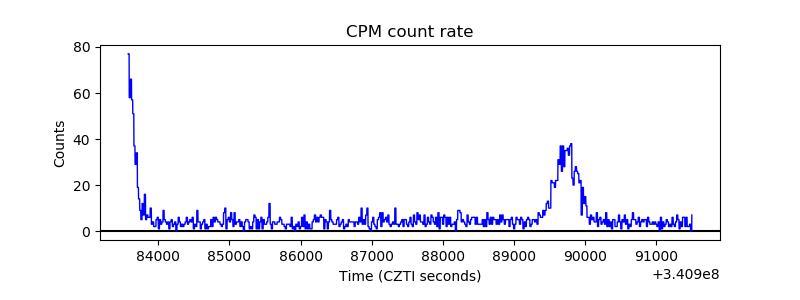 |
| CZT Counter | 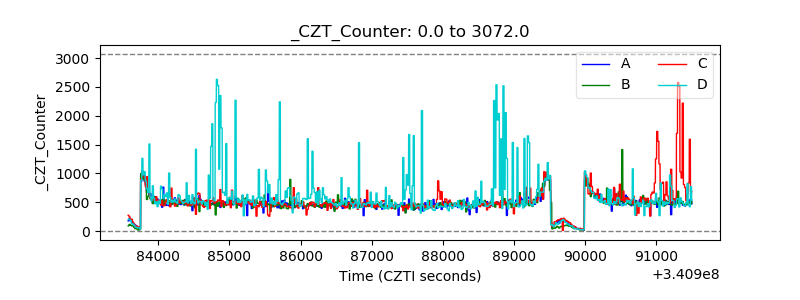 |
| +2.5 Volts monitor |  |
| +5 Volts monitor |  |
| _ROLL_ROT | 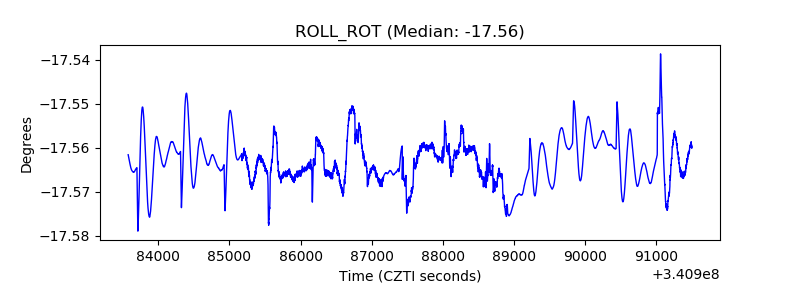 |
| _Roll_DEC | 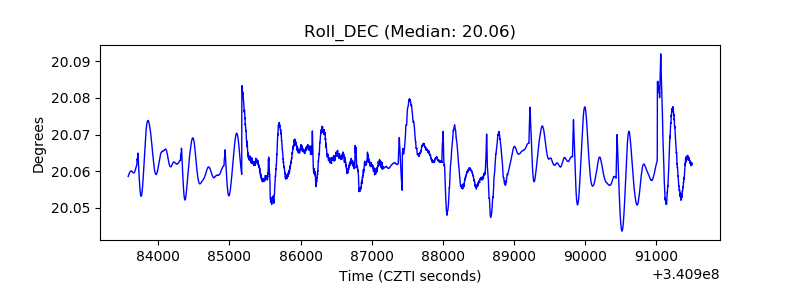 |
| _Roll_RA |  |
| Veto Counter | 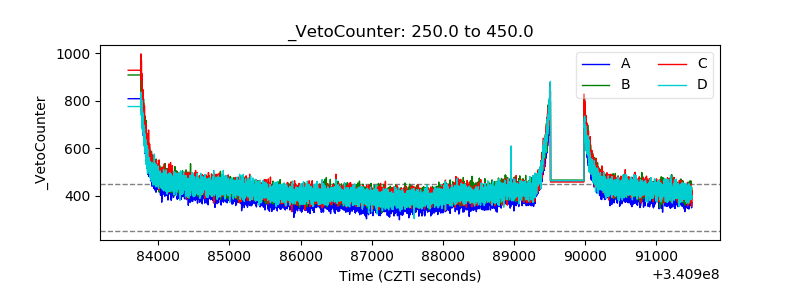 |