| Param | Original file | Final file |
|---|---|---|
| Filename | modeM0/AS1T03_249T01_9000003934_27391cztM0_level2.evt | modeM0/AS1T03_249T01_9000003934_27391cztM0_level2_quad_clean.evt |
| Size (bytes) | 550,863,360 | 81,668,160 |
| Size | 525.3 MB | 77.9 MB |
| Events in quadrant A | 3,813,721 | 496,347 |
| Events in quadrant B | 3,831,709 | 494,288 |
| Events in quadrant C | 4,479,441 | 472,681 |
| Events in quadrant D | 4,034,608 | 473,028 |
| Mode M0 | |||
|---|---|---|---|
| Quadrant | BADHDUFLAG | Total packets | Discarded packets |
| A | 0 | 16079 | 0 |
| B | 0 | 16129 | 0 |
| C | 0 | 18138 | 0 |
| D | 0 | 17029 | 0 |
| Mode M9 | |||
|---|---|---|---|
| Quadrant | BADHDUFLAG | Total packets | Discarded packets |
| A | 0 | 3 | 0 |
| B | 0 | 3 | 0 |
| C | 0 | 3 | 0 |
| D | 0 | 3 | 0 |
| Quadrant | Total seconds | Saturated seconds | Saturation percentage |
|---|---|---|---|
| A | 7714 | 93 | 1.205600% |
| B | 7715 | 130 | 1.685029% |
| C | 7715 | 319 | 4.134802% |
| D | 7715 | 126 | 1.633182% |
Noise dominated data is calculated using 1-second bins in cleaned event files. If a bin has >2000 counts, and if more than 50% of those come from <1% of pixels, then it is considered to be noise-dominated and hence unusable.
| Quadrant | # 1 sec bins | Bins with >0 counts | Bins with >2000 counts | High rate bins dominated by noise | Noise dominated (total time) | Noise dominated (detector-on time) | Marked lightcurve |
|---|---|---|---|---|---|---|---|
| A | 8019 | 7715 | 0 | 0 | 0.00% | 0.00% | 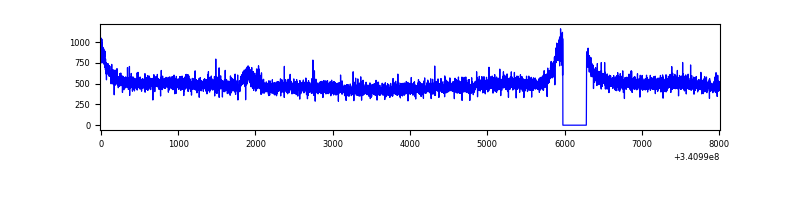 |
| B | 8020 | 7716 | 4 | 4 | 0.05% | 0.05% | 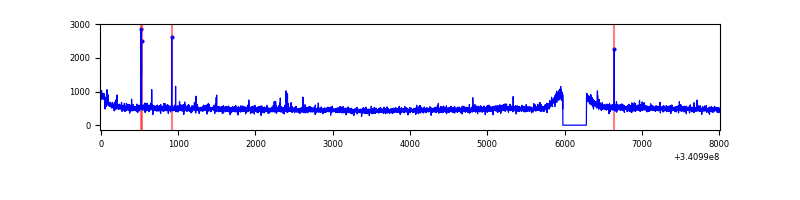 |
| C | 8020 | 7715 | 92 | 92 | 1.15% | 1.19% | 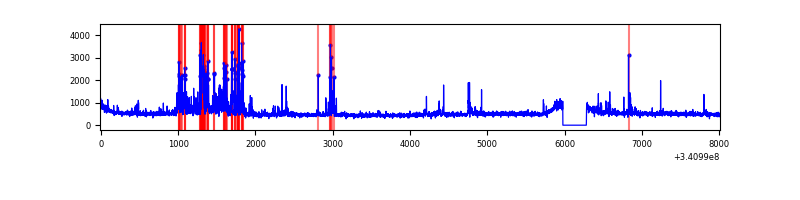 |
| D | 8020 | 7715 | 43 | 43 | 0.54% | 0.56% | 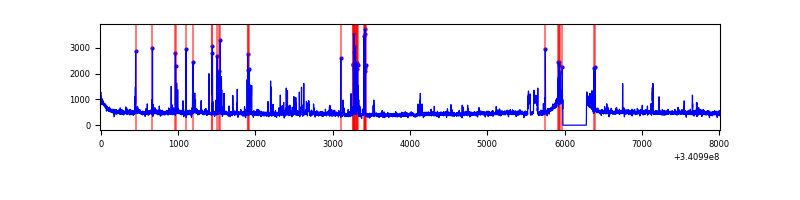 |
Top three noisy pixels from each quadrant. If the there are fewer than three noisy pixels in the level2.evt file, extra rows are filled as -1
| Pixel properties | Quadrant properties | ||||||
|---|---|---|---|---|---|---|---|
| Quadrant | DetID | PixID | Counts | Sigma | Mean | Median | Sigma |
| A | 12 | 189 | 33448 | 164.23 | 978 | 956 | 197.8 |
| A | 13 | 254 | 12395 | 57.82 | 978 | 956 | 197.8 |
| A | 3 | 137 | 9414 | 42.75 | 978 | 956 | 197.8 |
| B | 12 | 111 | 23001 | 118.76 | 962 | 939 | 185.8 |
| B | 11 | 111 | 20643 | 106.07 | 962 | 939 | 185.8 |
| B | 4 | 52 | 19690 | 100.94 | 962 | 939 | 185.8 |
| C | 2 | 16 | 705231 | 3210.69 | 923 | 928 | 219.4 |
| C | 14 | 238 | 145900 | 660.88 | 923 | 928 | 219.4 |
| C | 8 | 128 | 10922 | 45.56 | 923 | 928 | 219.4 |
| D | 2 | 250 | 210593 | 928.49 | 946 | 922 | 225.8 |
| D | 1 | 52 | 184602 | 813.39 | 946 | 922 | 225.8 |
| D | 2 | 234 | 37080 | 160.12 | 946 | 922 | 225.8 |
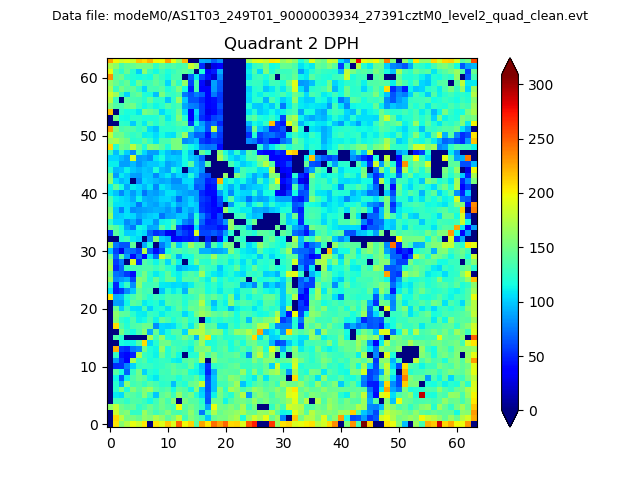
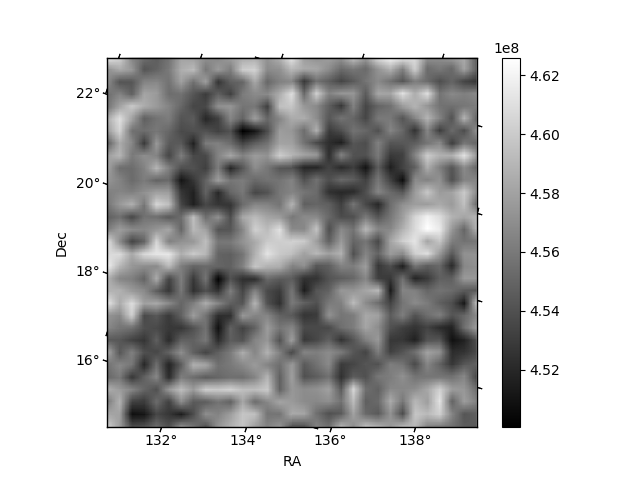
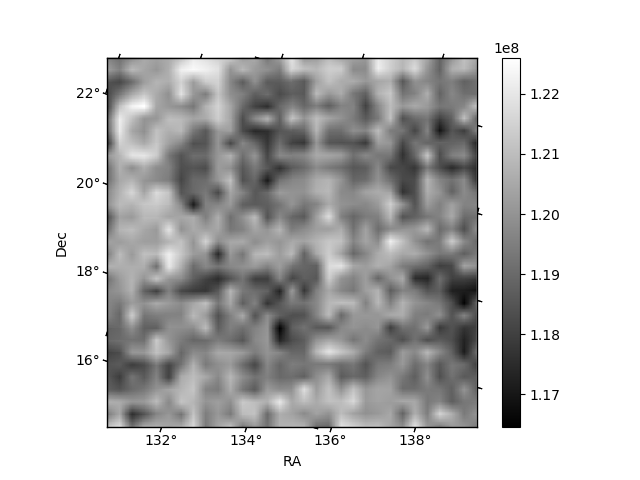
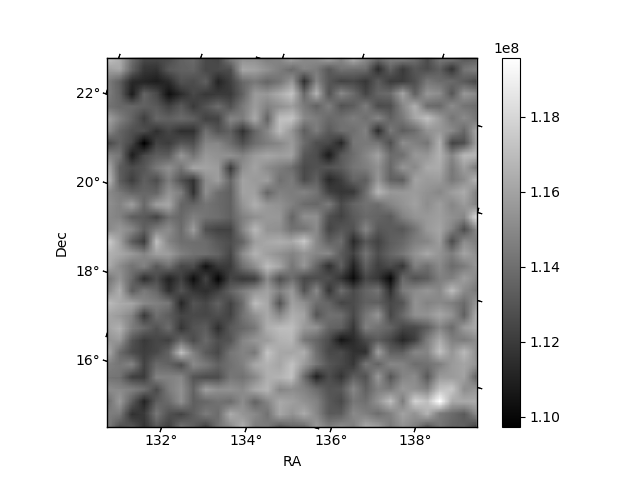
Histogram calculated using DETX and DETY for each event in the final _common_clean file
| Quadrant A | 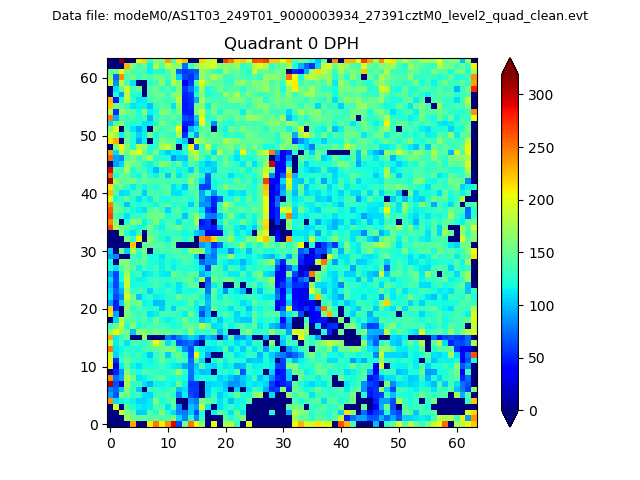 |
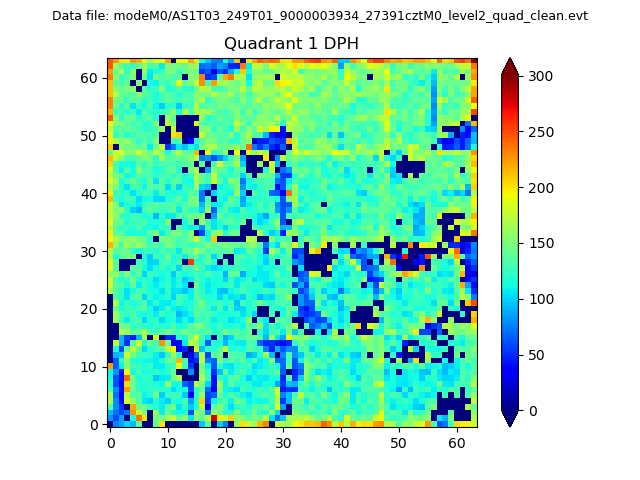 |
Quadrant B |
|---|---|---|---|
| Quadrant D | 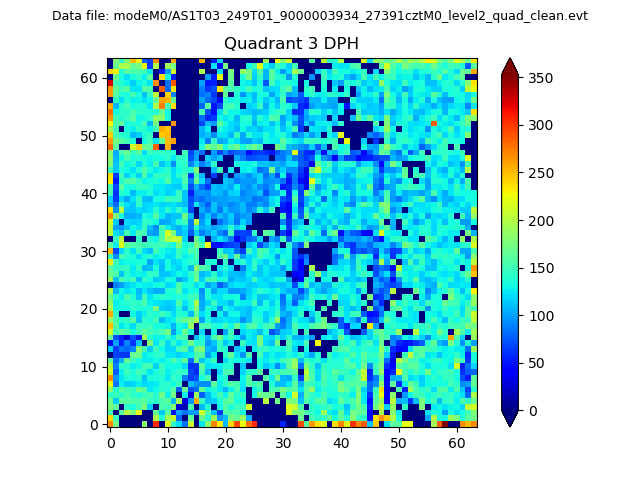 |
 |
Quadrant C |
| Plot type | Count rate plots | Images |
|---|---|---|
| Comparison with Poisson distribution Blue bars denote a histogram of data divided into 1 sec bins. Red curve is a Poisson curve with rate = median count rate of data. |
 |
 |
| Quadrant-wise count rates Data is divided into 100 sec bins |
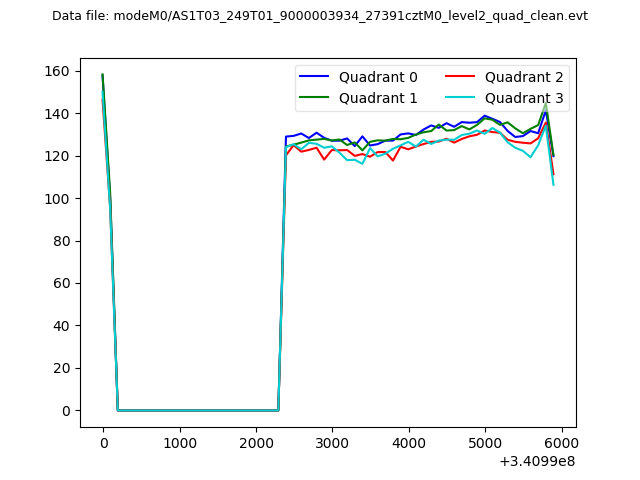 |
|
| Module-wise count rates for Quadrant A Data is divided into 100 sec bins |
 |
 |
| Module-wise count rates for Quadrant B Data is divided into 100 sec bins |
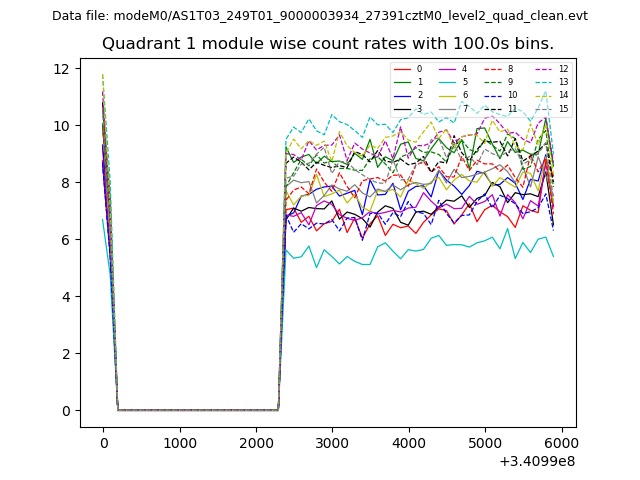 |
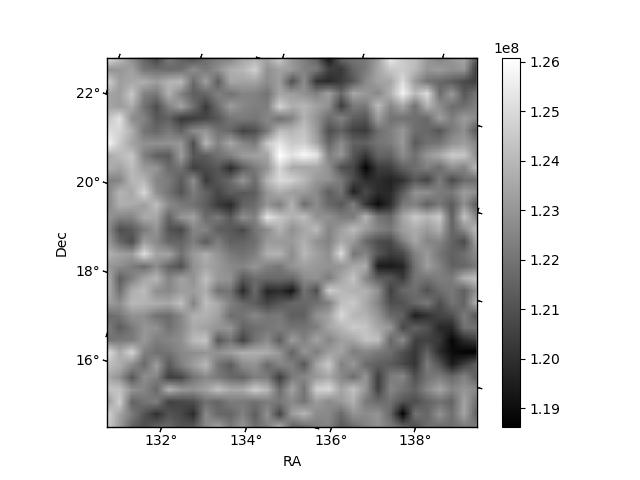 |
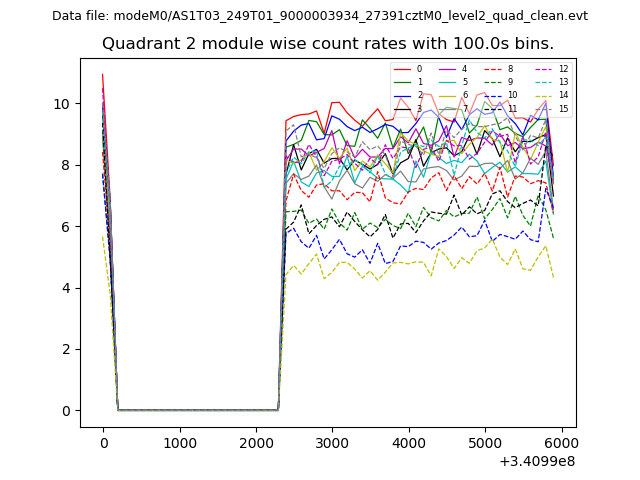
| Module-wise count rates for Quadrant C Data is divided into 100 sec bins |
 |
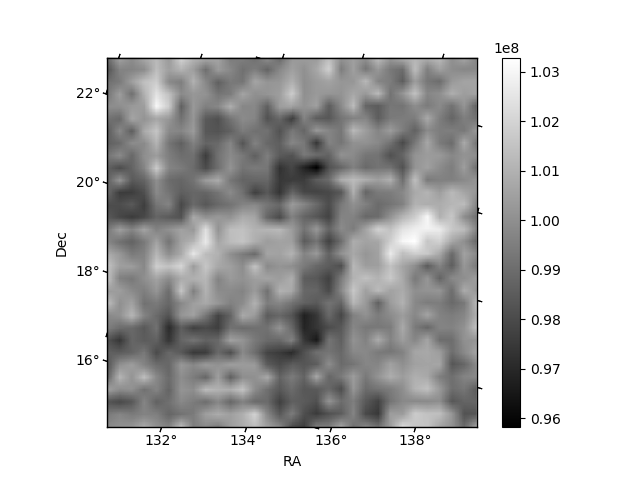 |
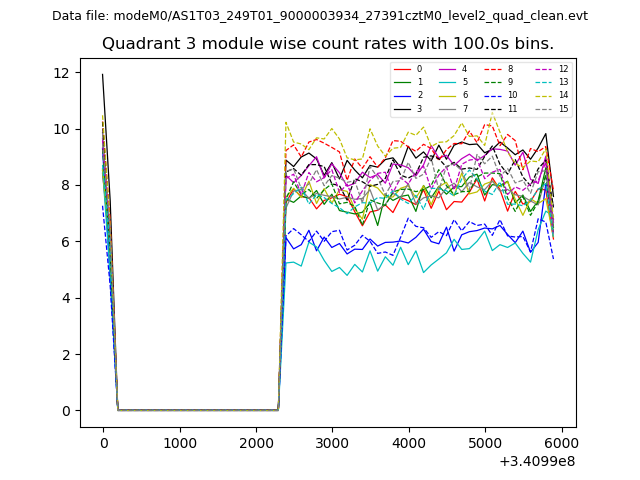
| Module-wise count rates for Quadrant D Data is divided into 100 sec bins |
 |
 |
| Parameter | Plot |
|---|---|
| CZT HV Monitor | 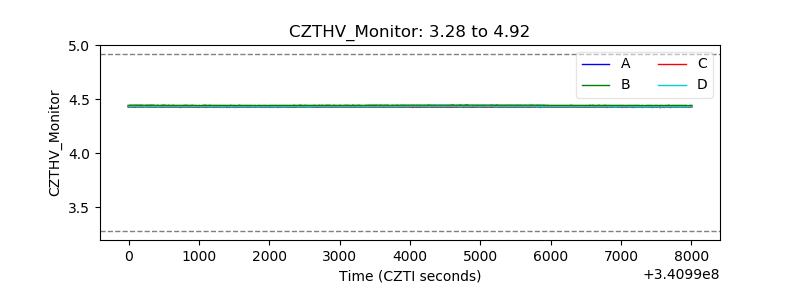 |
| D_VDD | 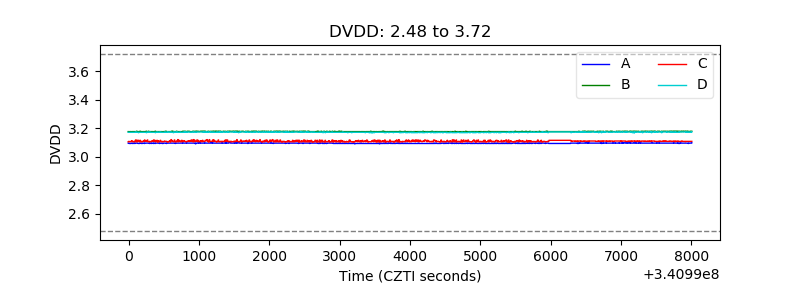 |
| Temperature 1 | 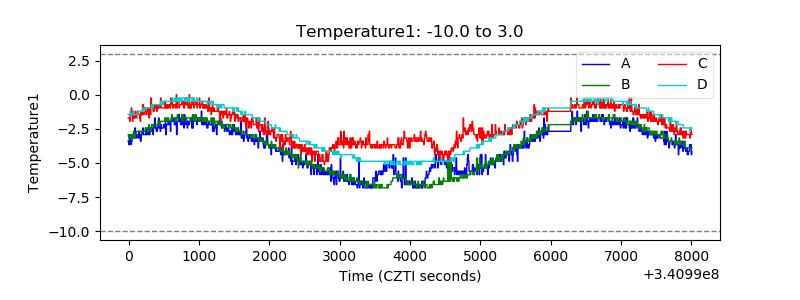 |
| Veto HV Monitor | 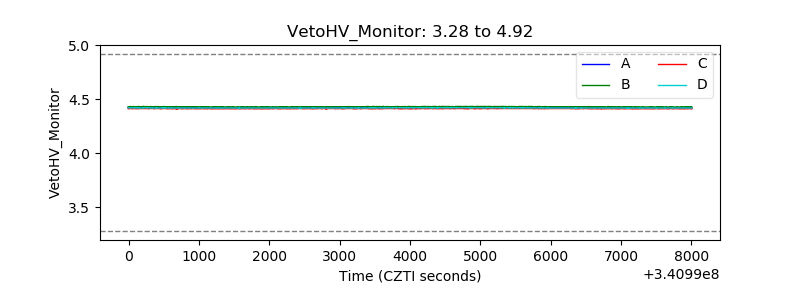 |
| Veto LLD | 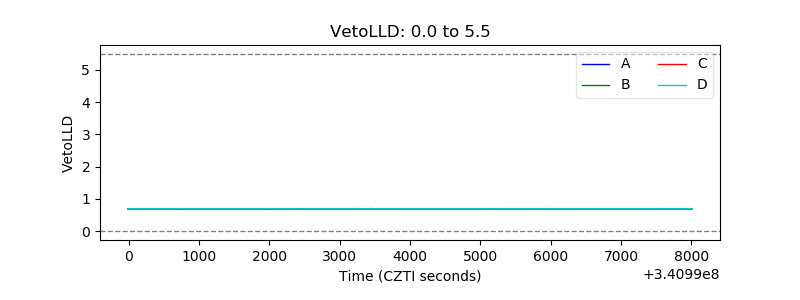 |
| Alpha Counter | 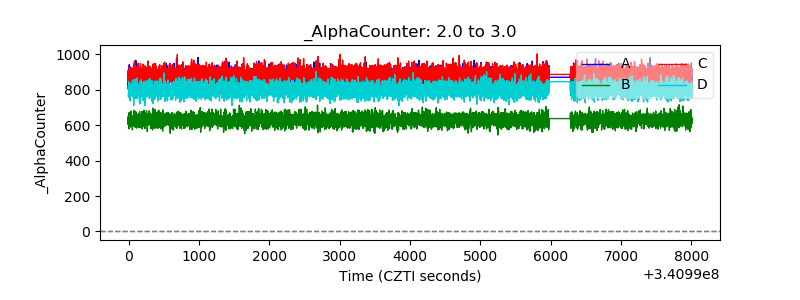 |
| _CPM_Rate | 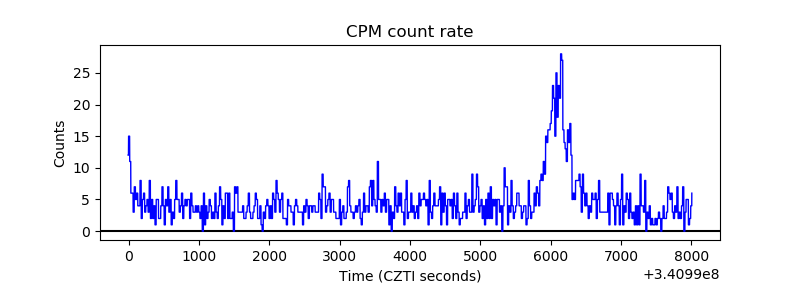 |
| CZT Counter | 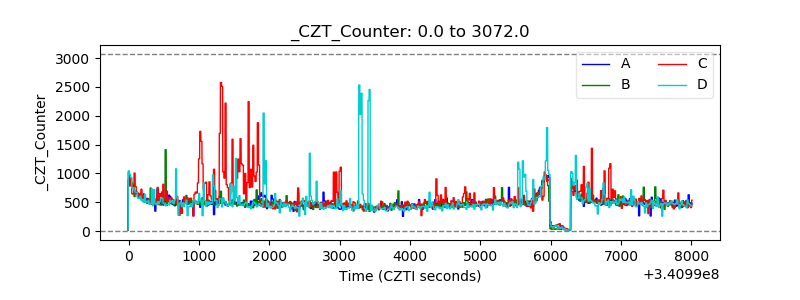 |
| +2.5 Volts monitor |  |
| +5 Volts monitor |  |
| _ROLL_ROT | 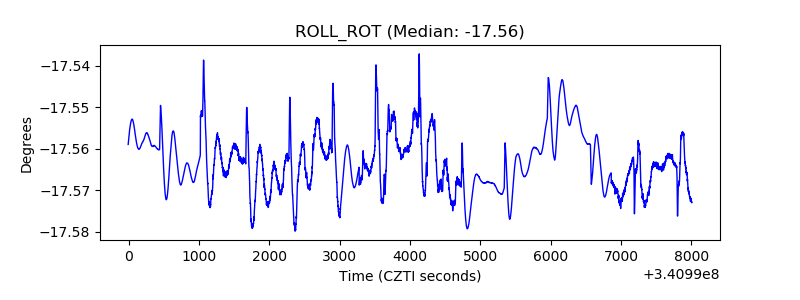 |
| _Roll_DEC | 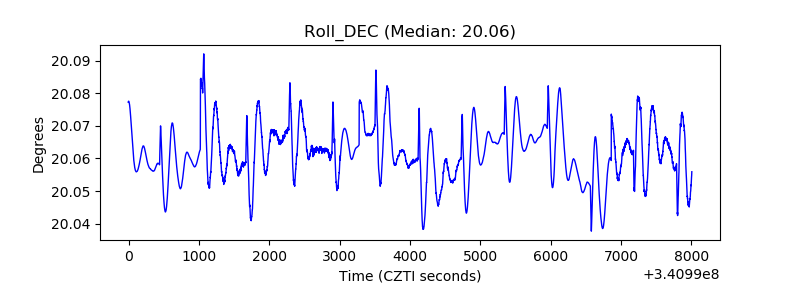 |
| _Roll_RA | 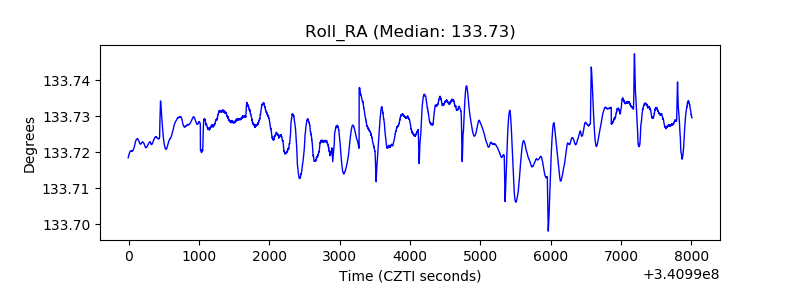 |
| Veto Counter |  |