| Param | Original file | Final file |
|---|---|---|
| Filename | modeM0/AS1T03_249T01_9000003934_27392cztM0_level2.evt | modeM0/AS1T03_249T01_9000003934_27392cztM0_level2_quad_clean.evt |
| Size (bytes) | 499,887,360 | 78,073,920 |
| Size | 476.7 MB | 74.5 MB |
| Events in quadrant A | 3,467,619 | 478,790 |
| Events in quadrant B | 3,521,845 | 474,194 |
| Events in quadrant C | 3,595,033 | 453,971 |
| Events in quadrant D | 4,061,621 | 451,726 |
| Mode M0 | |||
|---|---|---|---|
| Quadrant | BADHDUFLAG | Total packets | Discarded packets |
| A | 0 | 14847 | 0 |
| B | 0 | 14953 | 0 |
| C | 0 | 15206 | 0 |
| D | 0 | 16850 | 0 |
| Mode M9 | |||
|---|---|---|---|
| Quadrant | BADHDUFLAG | Total packets | Discarded packets |
| A | 0 | 4 | 0 |
| B | 0 | 4 | 0 |
| C | 0 | 4 | 0 |
| D | 0 | 4 | 0 |
| Quadrant | Total seconds | Saturated seconds | Saturation percentage |
|---|---|---|---|
| A | 7262 | 36 | 0.495731% |
| B | 7262 | 54 | 0.743597% |
| C | 7262 | 109 | 1.500964% |
| D | 7262 | 73 | 1.005233% |
Noise dominated data is calculated using 1-second bins in cleaned event files. If a bin has >2000 counts, and if more than 50% of those come from <1% of pixels, then it is considered to be noise-dominated and hence unusable.
| Quadrant | # 1 sec bins | Bins with >0 counts | Bins with >2000 counts | High rate bins dominated by noise | Noise dominated (total time) | Noise dominated (detector-on time) | Marked lightcurve |
|---|---|---|---|---|---|---|---|
| A | 7662 | 7263 | 1 | 1 | 0.01% | 0.01% | 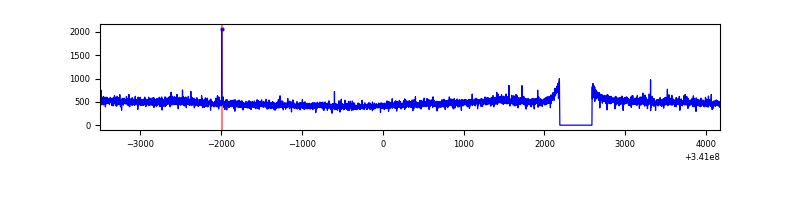 |
| B | 7662 | 7263 | 1 | 1 | 0.01% | 0.01% | 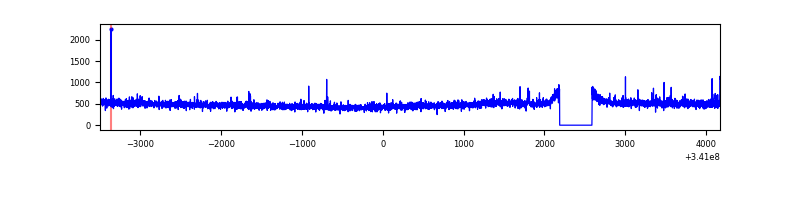 |
| C | 7662 | 7263 | 3 | 3 | 0.04% | 0.04% | 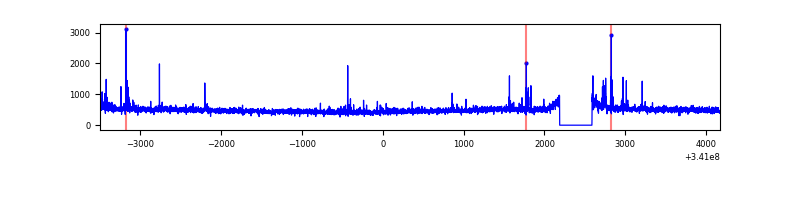 |
| D | 7662 | 7263 | 33 | 33 | 0.43% | 0.45% | 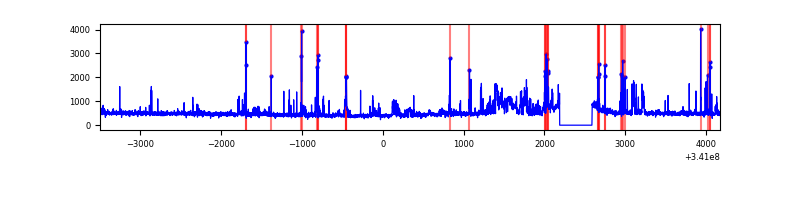 |
Top three noisy pixels from each quadrant. If the there are fewer than three noisy pixels in the level2.evt file, extra rows are filled as -1
| Pixel properties | Quadrant properties | ||||||
|---|---|---|---|---|---|---|---|
| Quadrant | DetID | PixID | Counts | Sigma | Mean | Median | Sigma |
| A | 13 | 254 | 12036 | 61.11 | 898 | 876 | 182.6 |
| A | 3 | 137 | 8482 | 41.65 | 898 | 876 | 182.6 |
| A | 0 | 226 | 7769 | 37.75 | 898 | 876 | 182.6 |
| B | 12 | 111 | 20905 | 118.41 | 884 | 861 | 169.3 |
| B | 11 | 111 | 18998 | 107.14 | 884 | 861 | 169.3 |
| B | 14 | 111 | 16163 | 90.39 | 884 | 861 | 169.3 |
| C | 14 | 238 | 135493 | 666.82 | 852 | 855 | 201.9 |
| C | 2 | 16 | 128302 | 631.2 | 852 | 855 | 201.9 |
| C | 3 | 233 | 7349 | 32.16 | 852 | 855 | 201.9 |
| D | 1 | 52 | 371398 | 1794.19 | 868 | 845 | 206.5 |
| D | 2 | 250 | 208981 | 1007.78 | 868 | 845 | 206.5 |
| D | 14 | 49 | 108726 | 522.35 | 868 | 845 | 206.5 |
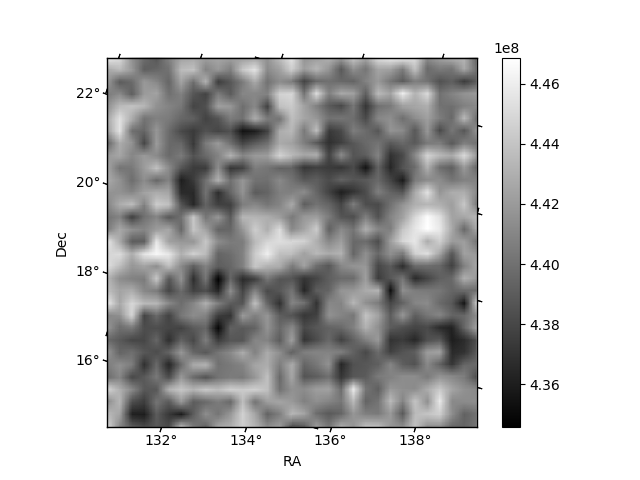
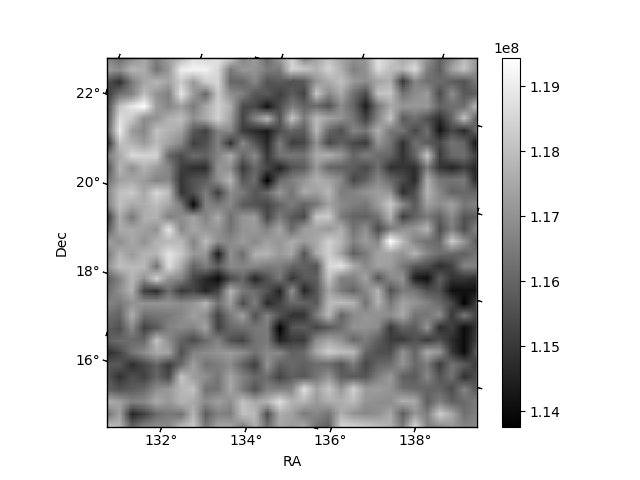
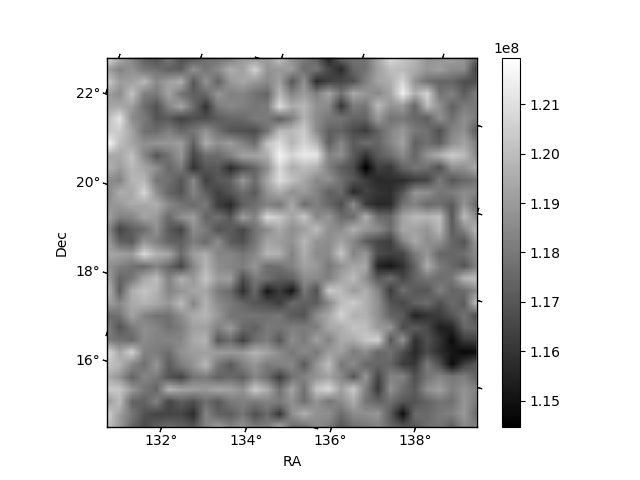
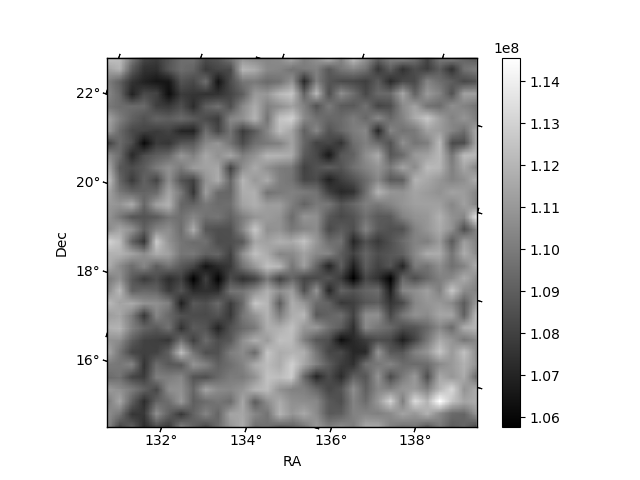
Histogram calculated using DETX and DETY for each event in the final _common_clean file
| Quadrant A | 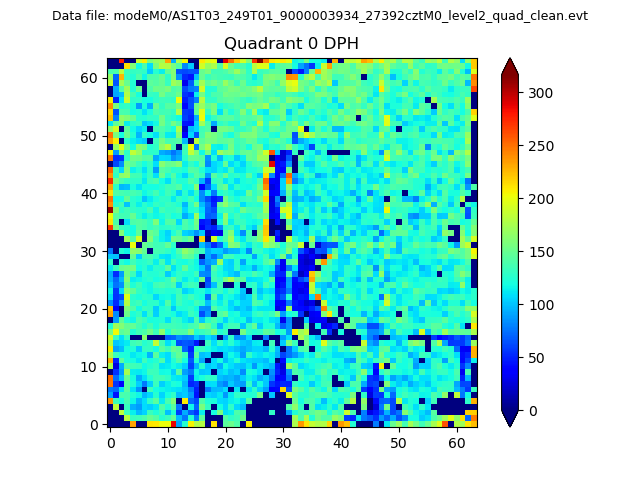 |
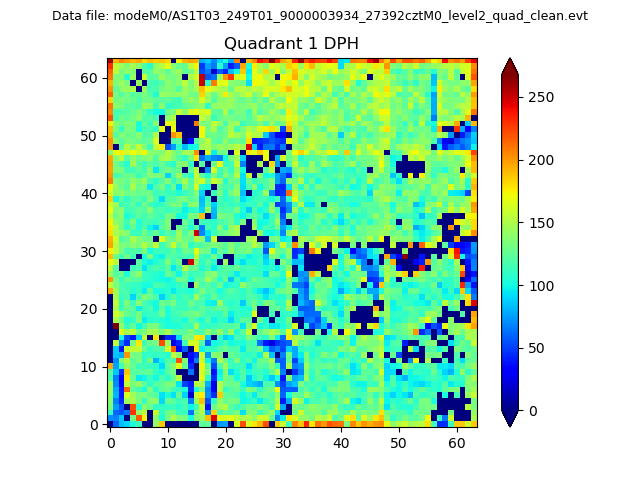 |
Quadrant B |
|---|---|---|---|
| Quadrant D |  |
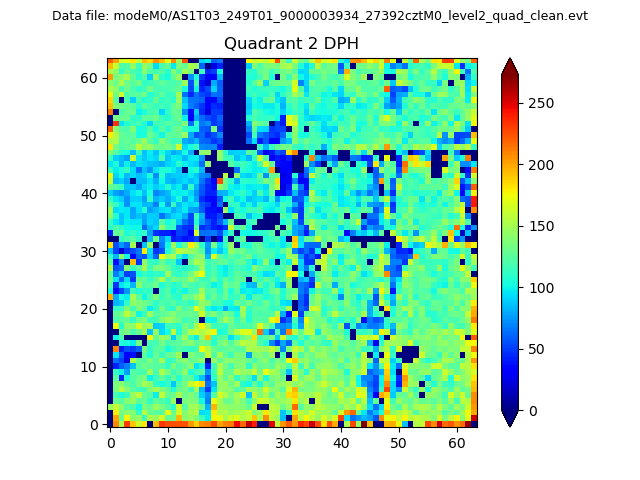 |
Quadrant C |
| Plot type | Count rate plots | Images |
|---|---|---|
| Comparison with Poisson distribution Blue bars denote a histogram of data divided into 1 sec bins. Red curve is a Poisson curve with rate = median count rate of data. |
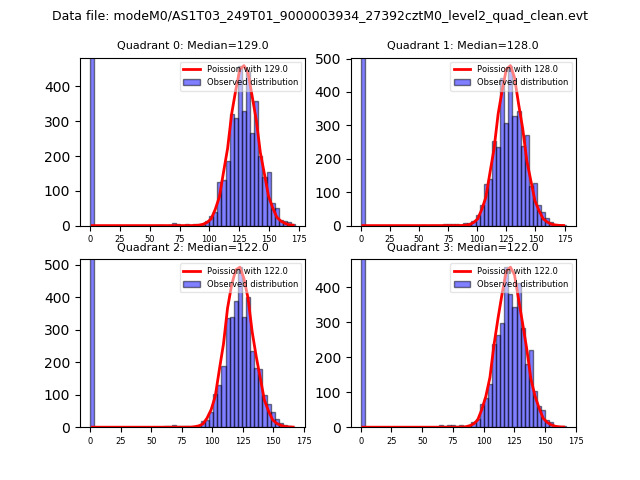 |
 |
| Quadrant-wise count rates Data is divided into 100 sec bins |
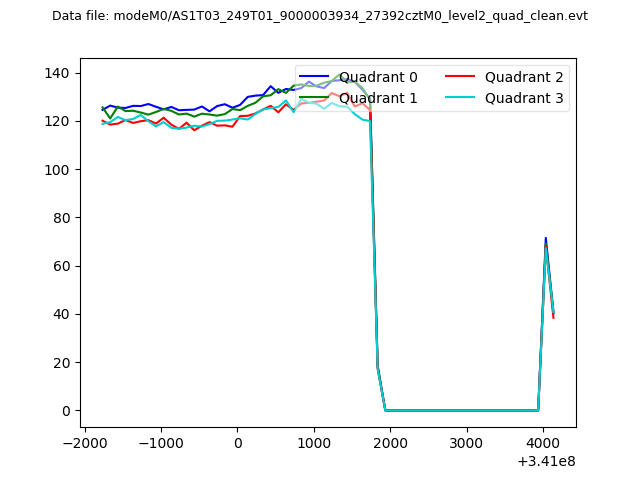 |
|
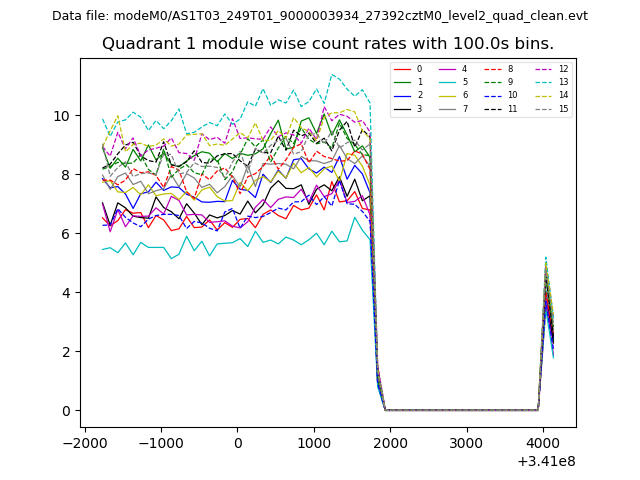
| Module-wise count rates for Quadrant A Data is divided into 100 sec bins |
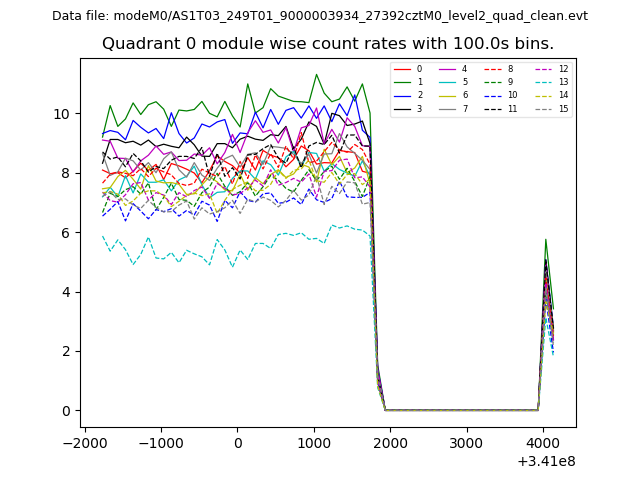 |
 |
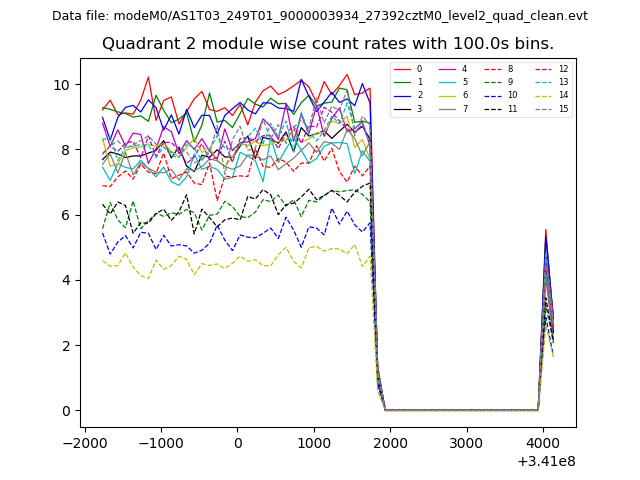
| Module-wise count rates for Quadrant B Data is divided into 100 sec bins |
 |
 |
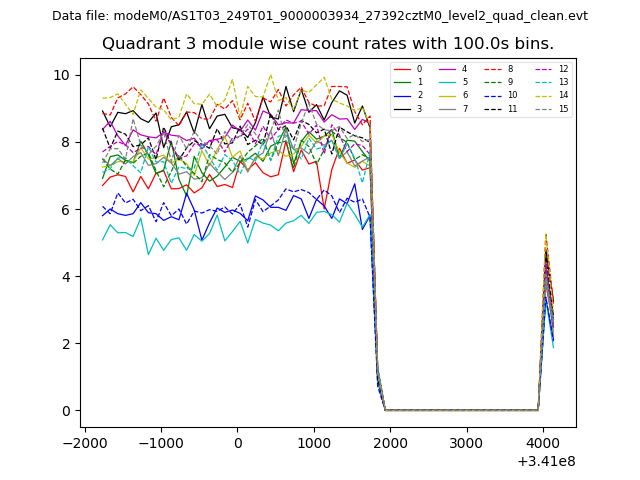
| Module-wise count rates for Quadrant C Data is divided into 100 sec bins |
 |
 |
| Module-wise count rates for Quadrant D Data is divided into 100 sec bins |
 |
 |
| Parameter | Plot |
|---|---|
| CZT HV Monitor | 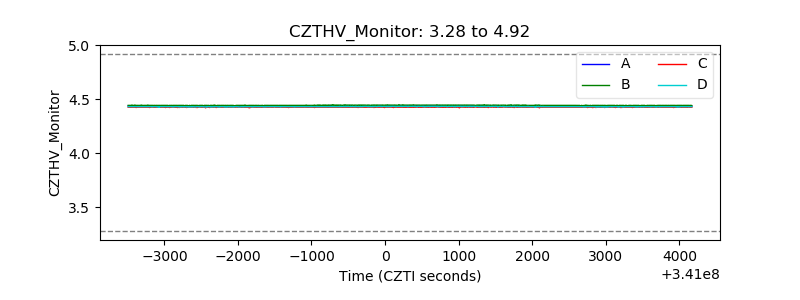 |
| D_VDD | 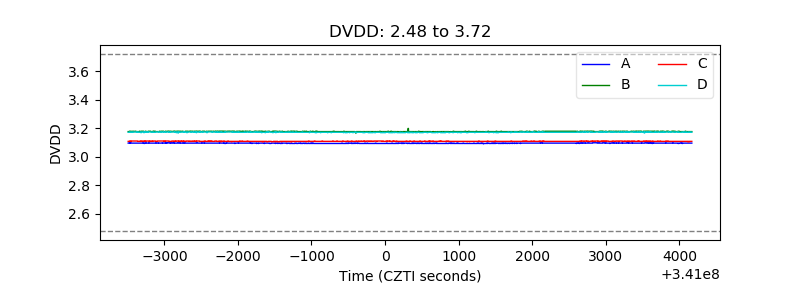 |
| Temperature 1 | 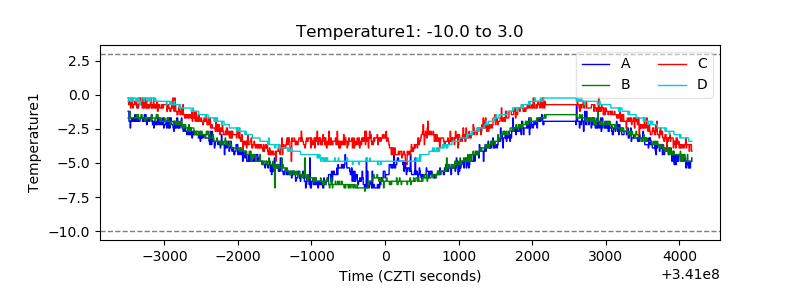 |
| Veto HV Monitor | 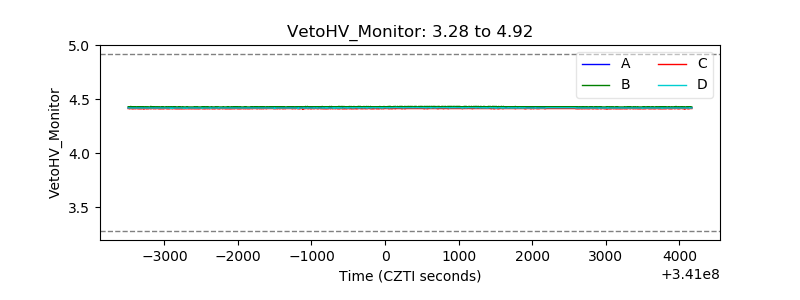 |
| Veto LLD | 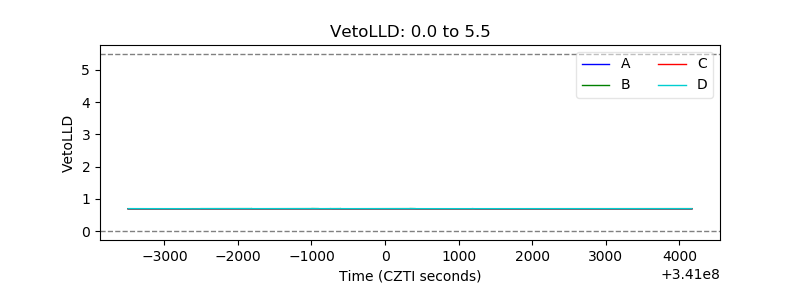 |
| Alpha Counter | 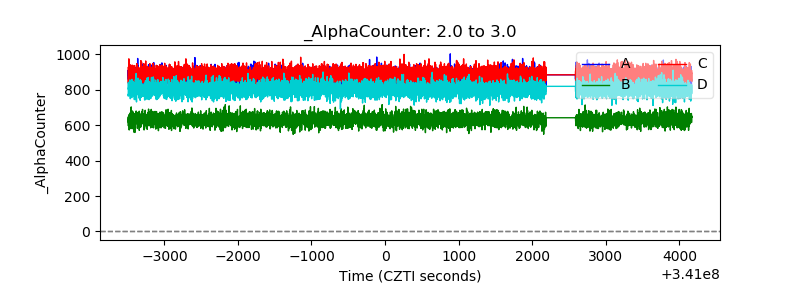 |
| _CPM_Rate | 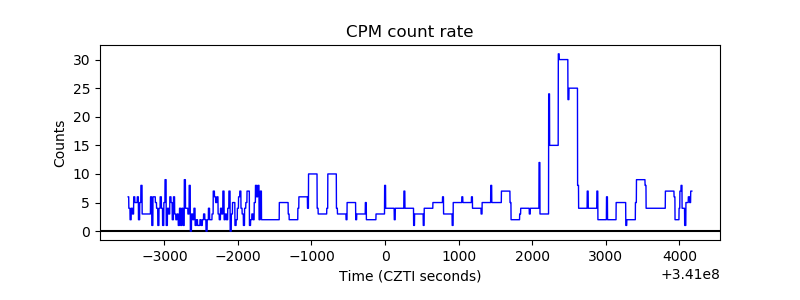 |
| CZT Counter | 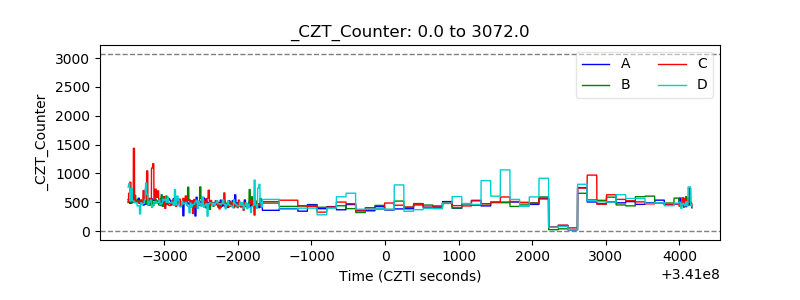 |
| +2.5 Volts monitor |  |
| +5 Volts monitor |  |
| _ROLL_ROT |  |
| _Roll_DEC | 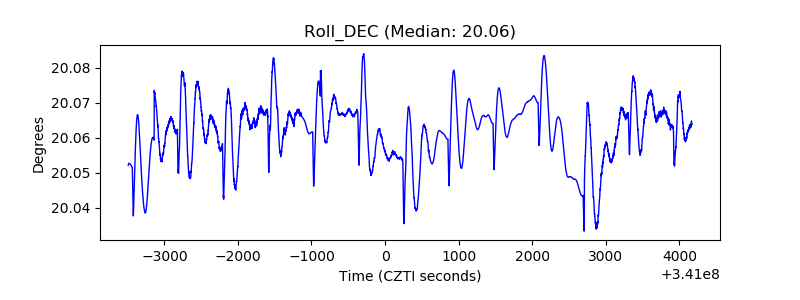 |
| _Roll_RA | 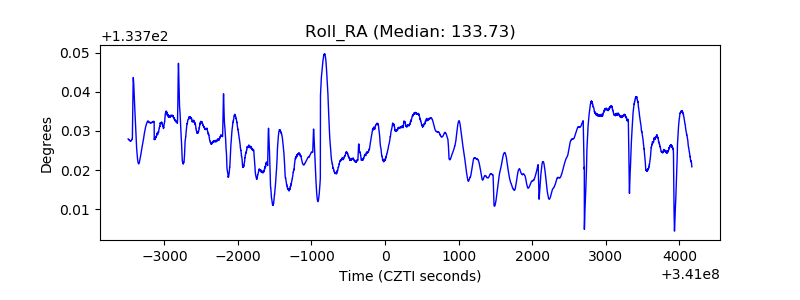 |
| Veto Counter |  |