| Param | Original file | Final file |
|---|---|---|
| Filename | modeM0/AS1T03_249T01_9000003934_27396cztM0_level2.evt | modeM0/AS1T03_249T01_9000003934_27396cztM0_level2_quad_clean.evt |
| Size (bytes) | 1,046,589,120 | 211,213,440 |
| Size | 998.1 MB | 201.4 MB |
| Events in quadrant A | 7,236,028 | 1,360,412 |
| Events in quadrant B | 7,364,496 | 1,353,558 |
| Events in quadrant C | 7,519,180 | 1,301,400 |
| Events in quadrant D | 8,516,401 | 1,301,400 |
| Mode M0 | |||
|---|---|---|---|
| Quadrant | BADHDUFLAG | Total packets | Discarded packets |
| A | 0 | 31860 | 0 |
| B | 0 | 32146 | 0 |
| C | 0 | 32566 | 0 |
| D | 0 | 36464 | 0 |
| Mode M9 | |||
|---|---|---|---|
| Quadrant | BADHDUFLAG | Total packets | Discarded packets |
| A | 0 | 12 | 0 |
| B | 0 | 12 | 0 |
| C | 0 | 12 | 0 |
| D | 0 | 12 | 0 |
| Quadrant | Total seconds | Saturated seconds | Saturation percentage |
|---|---|---|---|
| A | 15660 | 60 | 0.383142% |
| B | 15661 | 89 | 0.568291% |
| C | 15661 | 193 | 1.232361% |
| D | 15661 | 201 | 1.283443% |
Noise dominated data is calculated using 1-second bins in cleaned event files. If a bin has >2000 counts, and if more than 50% of those come from <1% of pixels, then it is considered to be noise-dominated and hence unusable.
| Quadrant | # 1 sec bins | Bins with >0 counts | Bins with >2000 counts | High rate bins dominated by noise | Noise dominated (total time) | Noise dominated (detector-on time) | Marked lightcurve |
|---|---|---|---|---|---|---|---|
| A | 16895 | 15662 | 0 | 0 | 0.00% | 0.00% | 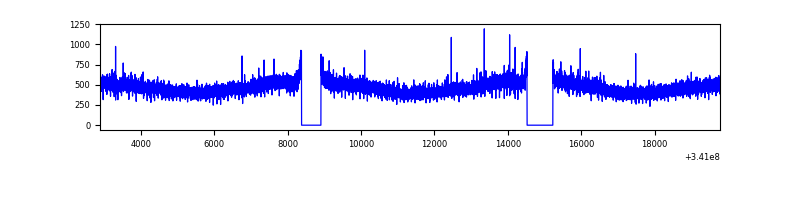 |
| B | 16896 | 15663 | 1 | 1 | 0.01% | 0.01% | 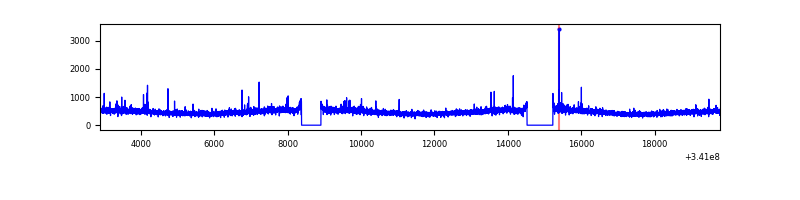 |
| C | 16896 | 15662 | 21 | 21 | 0.12% | 0.13% | 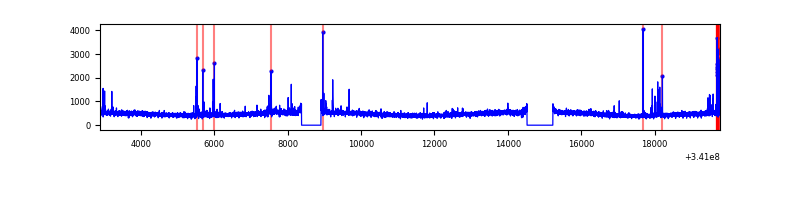 |
| D | 16896 | 15662 | 126 | 126 | 0.75% | 0.80% | 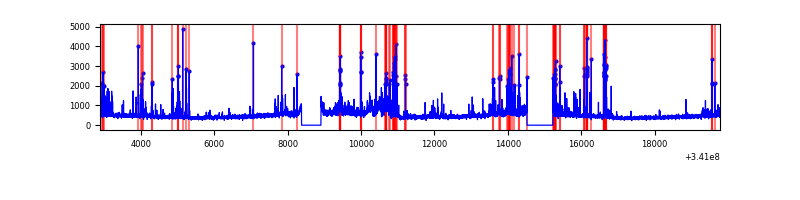 |
Top three noisy pixels from each quadrant. If the there are fewer than three noisy pixels in the level2.evt file, extra rows are filled as -1
| Pixel properties | Quadrant properties | ||||||
|---|---|---|---|---|---|---|---|
| Quadrant | DetID | PixID | Counts | Sigma | Mean | Median | Sigma |
| A | 13 | 254 | 24760 | 61.18 | 1871 | 1831 | 374.8 |
| A | 3 | 137 | 18144 | 43.53 | 1871 | 1831 | 374.8 |
| A | 0 | 226 | 16139 | 38.18 | 1871 | 1831 | 374.8 |
| B | 12 | 111 | 44064 | 119.92 | 1847 | 1800 | 352.4 |
| B | 11 | 111 | 39194 | 106.1 | 1847 | 1800 | 352.4 |
| B | 0 | 229 | 36300 | 97.89 | 1847 | 1800 | 352.4 |
| C | 14 | 238 | 283023 | 669.33 | 1784 | 1794 | 420.2 |
| C | 2 | 16 | 130784 | 307.0 | 1784 | 1794 | 420.2 |
| C | 15 | 208 | 127538 | 299.27 | 1784 | 1794 | 420.2 |
| D | 12 | 227 | 676447 | 1574.05 | 1802 | 1754 | 428.6 |
| D | 2 | 250 | 480089 | 1115.95 | 1802 | 1754 | 428.6 |
| D | 1 | 52 | 176698 | 408.14 | 1802 | 1754 | 428.6 |
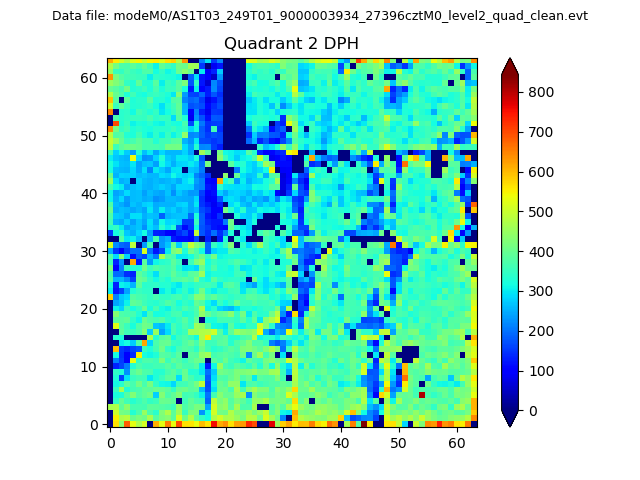
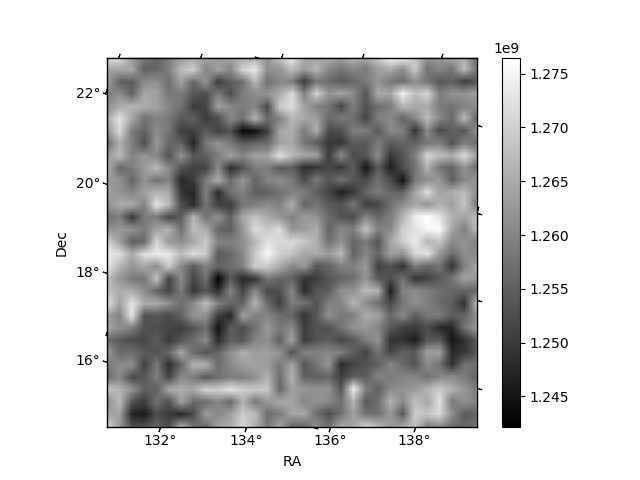
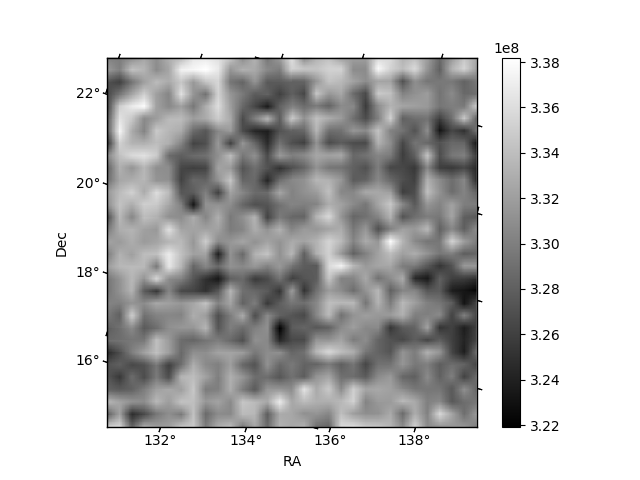
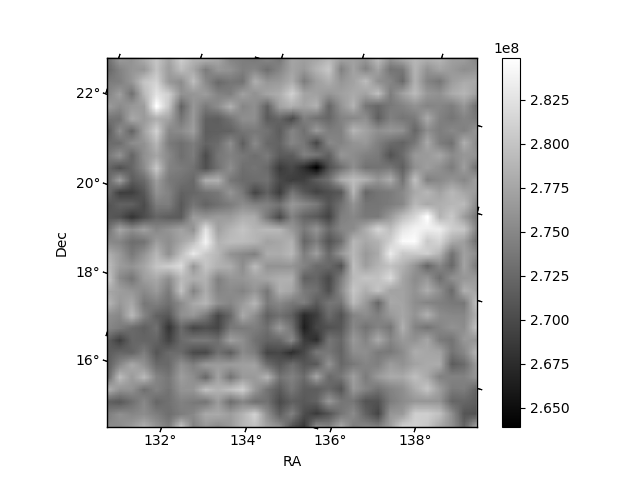
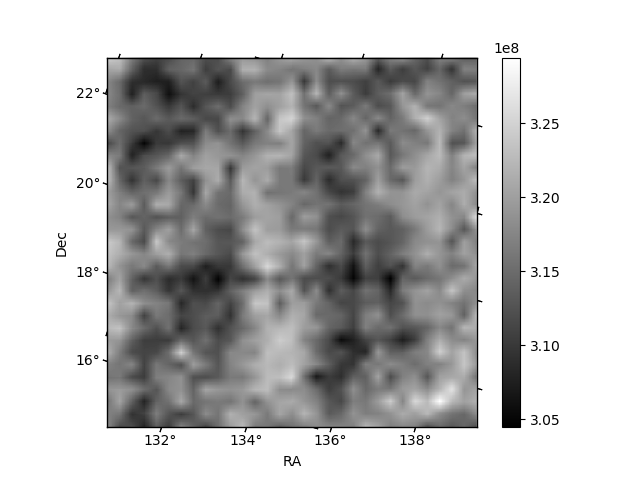
Histogram calculated using DETX and DETY for each event in the final _common_clean file
| Quadrant A | 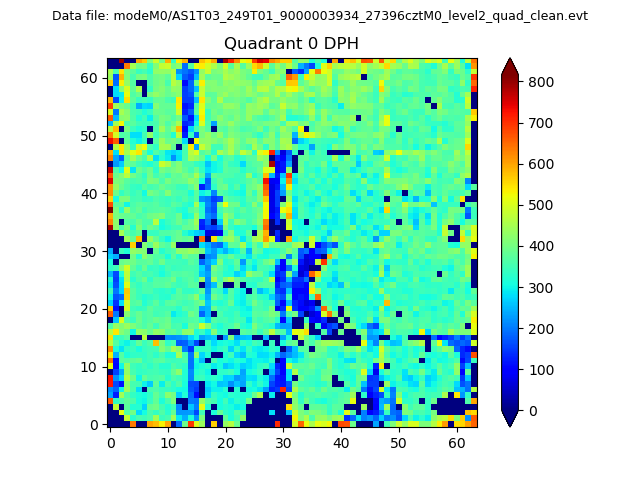 |
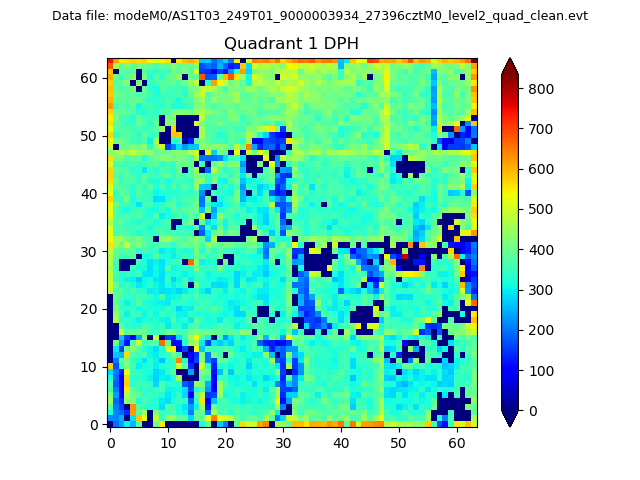 |
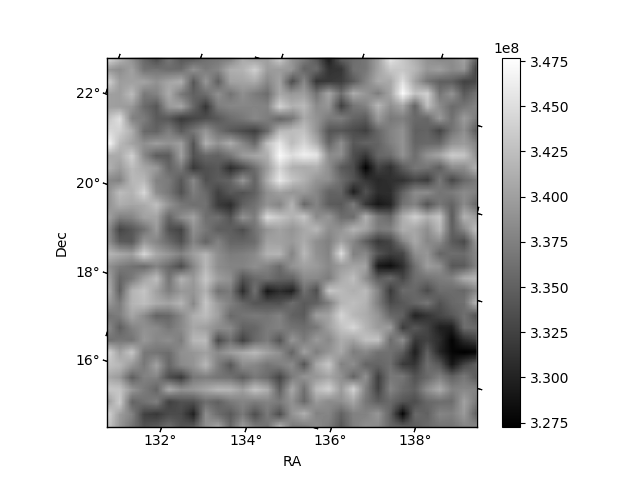
Quadrant B |
|---|---|---|---|
| Quadrant D | 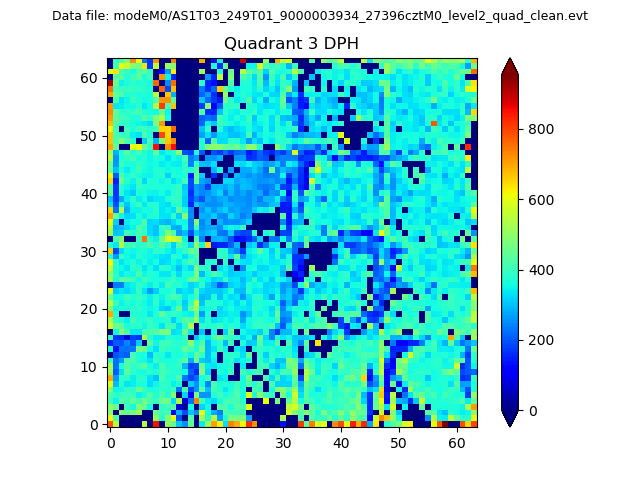 |
 |
Quadrant C |
| Plot type | Count rate plots | Images |
|---|---|---|
| Comparison with Poisson distribution Blue bars denote a histogram of data divided into 1 sec bins. Red curve is a Poisson curve with rate = median count rate of data. |
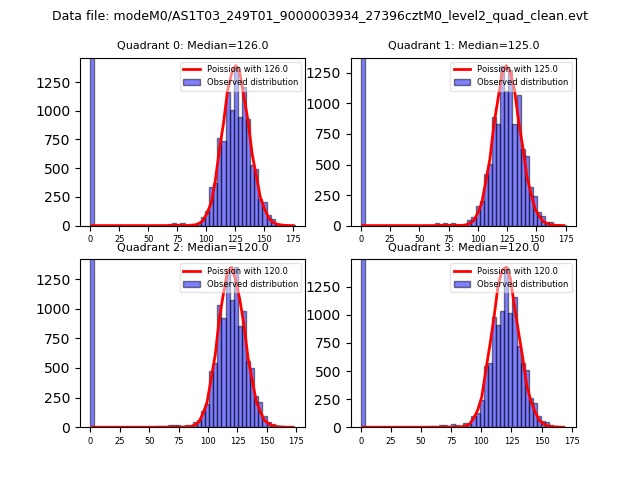 |
 |
| Quadrant-wise count rates Data is divided into 100 sec bins |
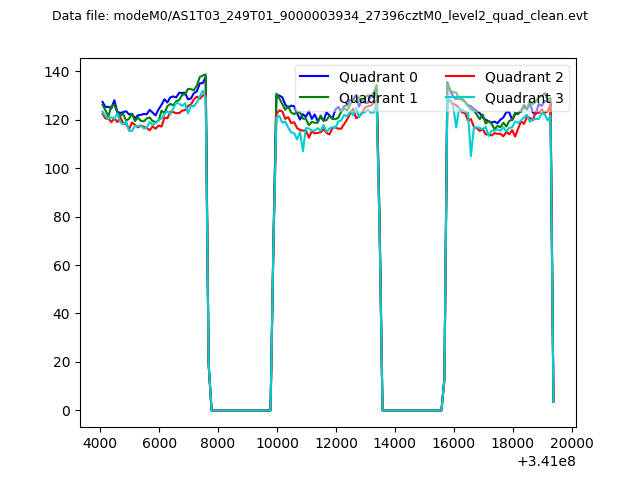 |
|
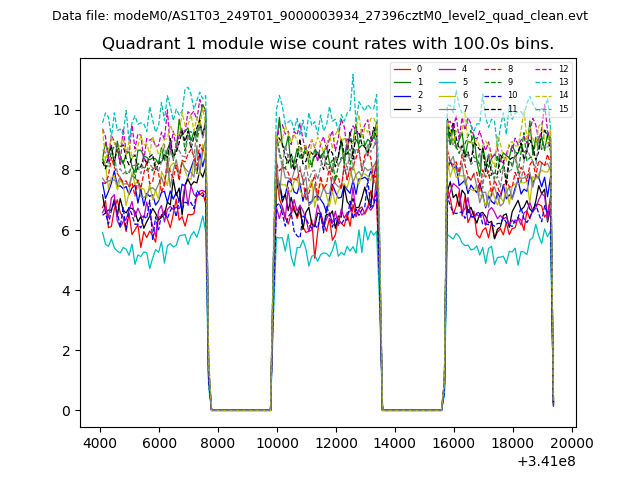
| Module-wise count rates for Quadrant A Data is divided into 100 sec bins |
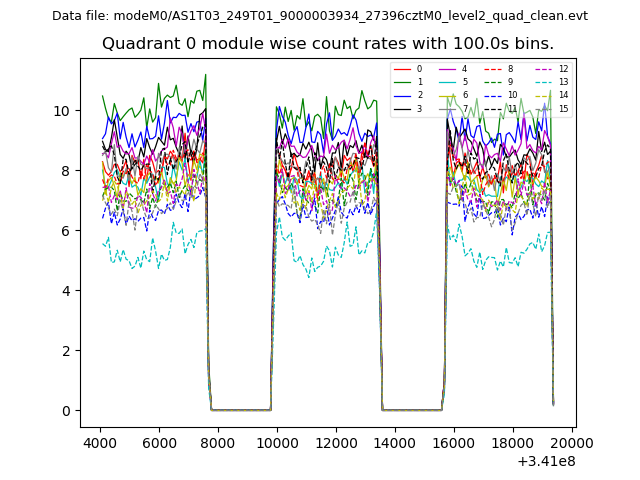 |
 |
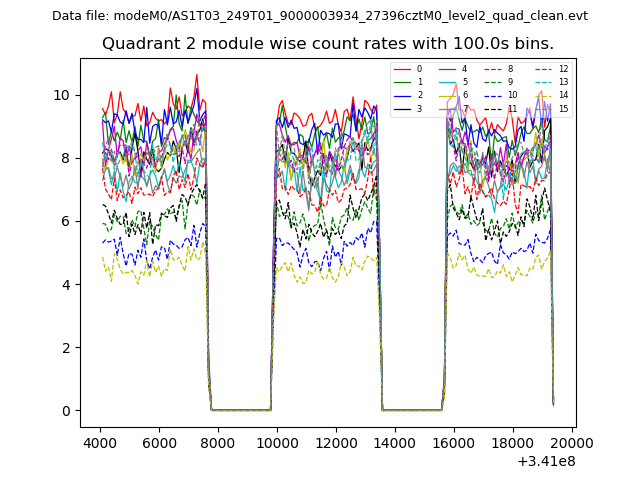
| Module-wise count rates for Quadrant B Data is divided into 100 sec bins |
 |
 |
| Module-wise count rates for Quadrant C Data is divided into 100 sec bins |
 |
 |
| Module-wise count rates for Quadrant D Data is divided into 100 sec bins |
 |
 |
| Parameter | Plot |
|---|---|
| CZT HV Monitor | 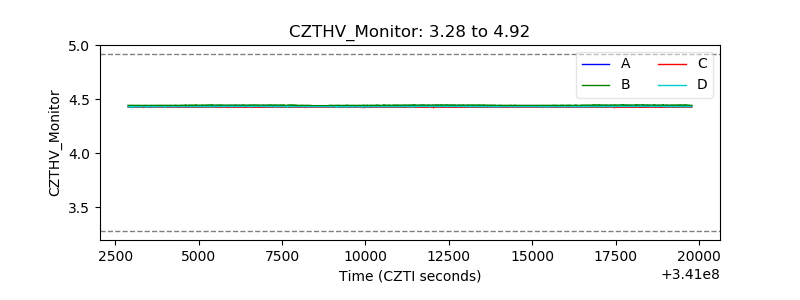 |
| D_VDD | 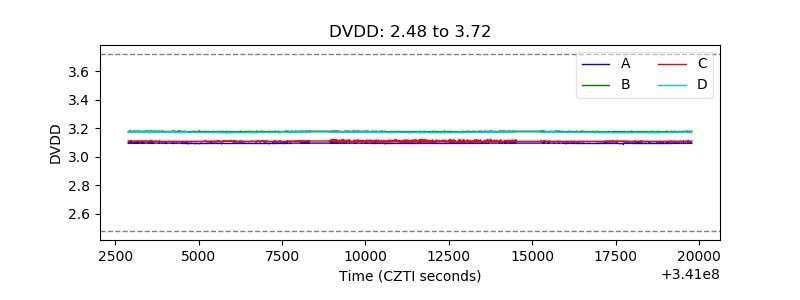 |
| Temperature 1 | 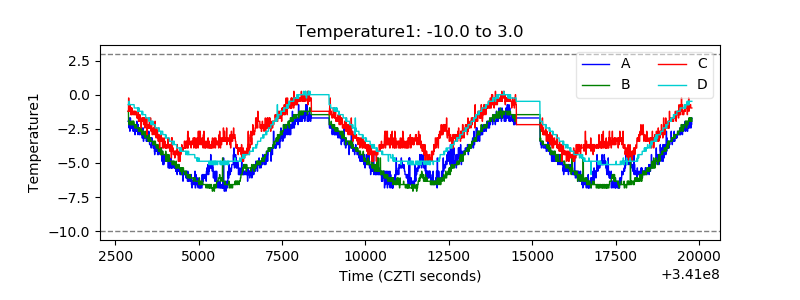 |
| Veto HV Monitor | 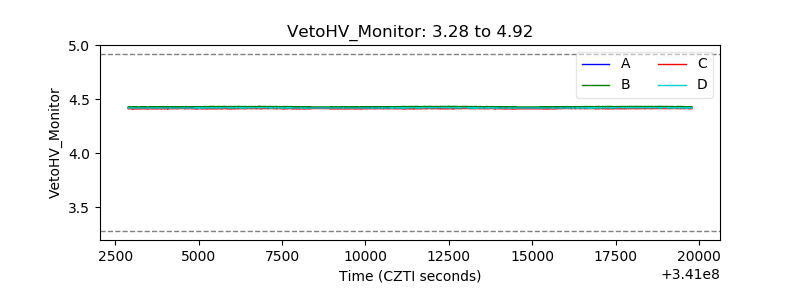 |
| Veto LLD | 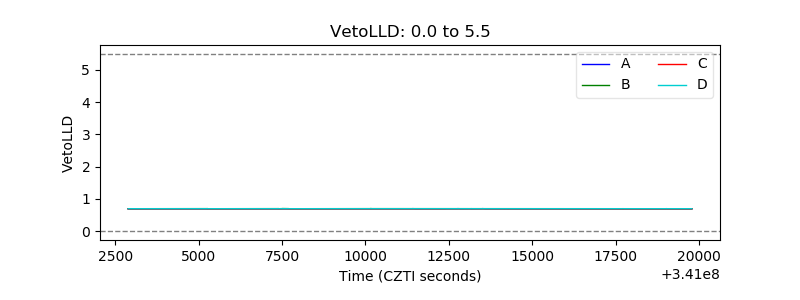 |
| Alpha Counter | 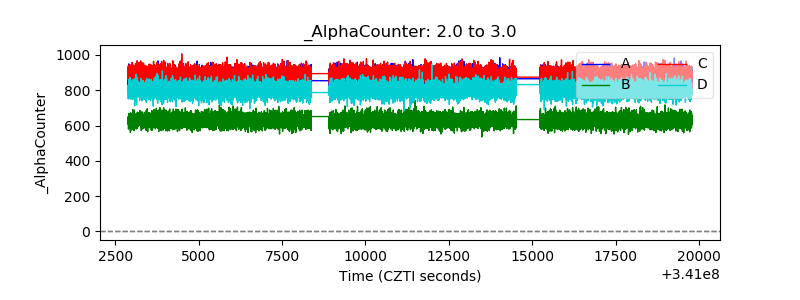 |
| _CPM_Rate | 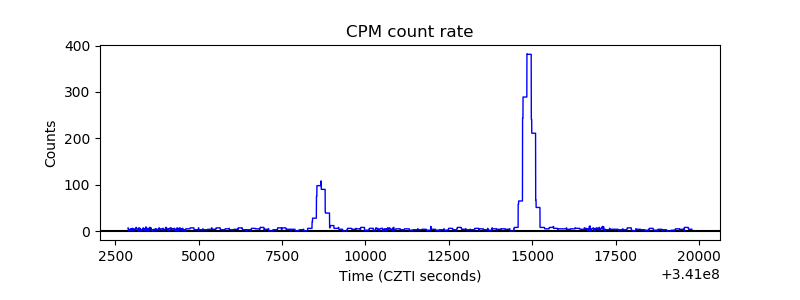 |
| CZT Counter | 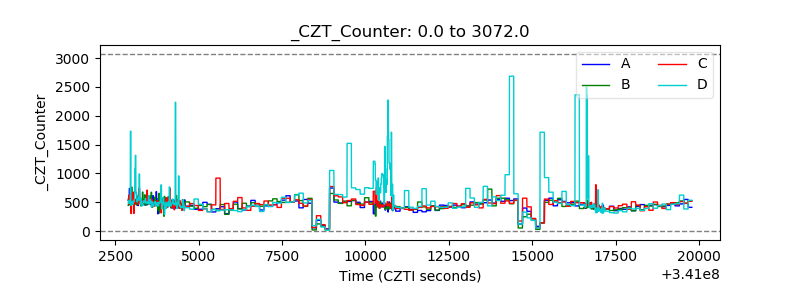 |
| +2.5 Volts monitor |  |
| +5 Volts monitor | 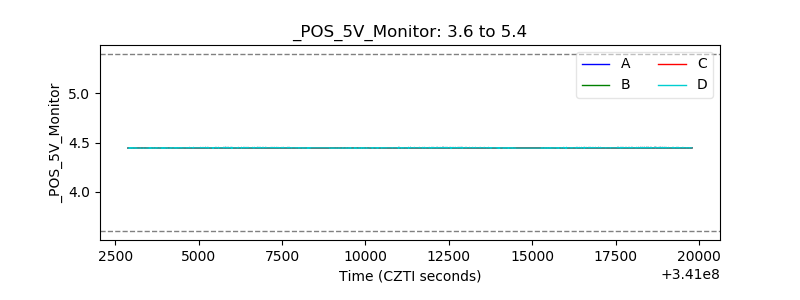 |
| _ROLL_ROT | 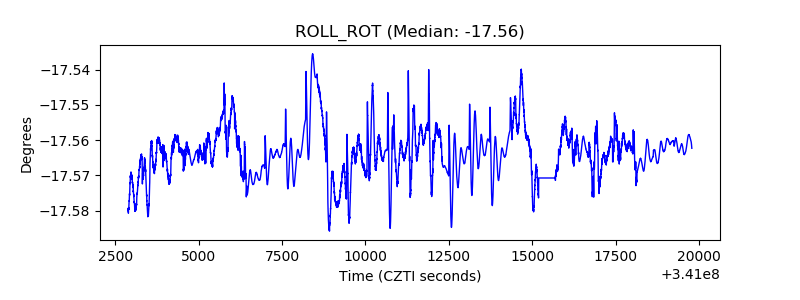 |
| _Roll_DEC | 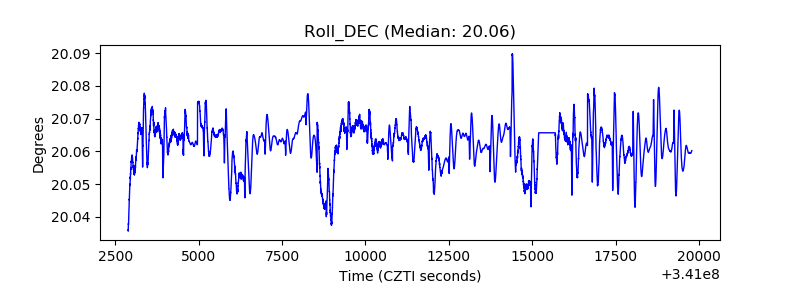 |
| _Roll_RA | 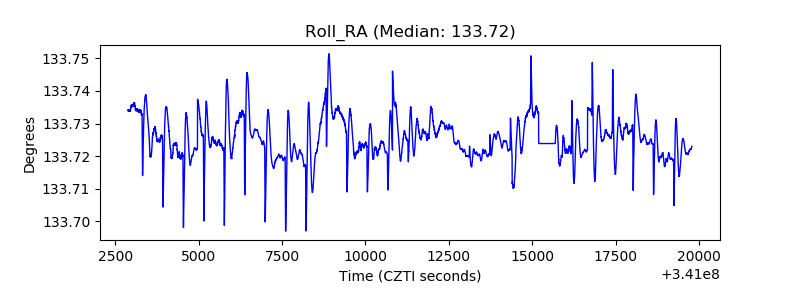 |
| Veto Counter | 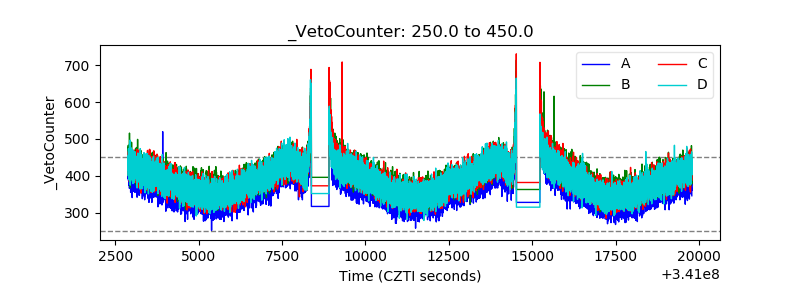 |