| Param | Original file | Final file |
|---|---|---|
| Filename | modeM0/AS1T03_249T01_9000003934_27398cztM0_level2.evt | modeM0/AS1T03_249T01_9000003934_27398cztM0_level2_quad_clean.evt |
| Size (bytes) | 909,440,640 | 179,098,560 |
| Size | 867.3 MB | 170.8 MB |
| Events in quadrant A | 6,401,836 | 1,156,029 |
| Events in quadrant B | 6,544,590 | 1,167,954 |
| Events in quadrant C | 6,754,118 | 1,100,777 |
| Events in quadrant D | 6,944,180 | 1,083,474 |
| Mode M0 | |||
|---|---|---|---|
| Quadrant | BADHDUFLAG | Total packets | Discarded packets |
| A | 0 | 27440 | 0 |
| B | 0 | 27835 | 0 |
| C | 0 | 28538 | 0 |
| D | 0 | 29812 | 0 |
| Mode M9 | |||
|---|---|---|---|
| Quadrant | BADHDUFLAG | Total packets | Discarded packets |
| A | 0 | 30 | 0 |
| B | 0 | 30 | 0 |
| C | 0 | 30 | 0 |
| D | 0 | 30 | 0 |
| Quadrant | Total seconds | Saturated seconds | Saturation percentage |
|---|---|---|---|
| A | 13268 | 64 | 0.482364% |
| B | 13269 | 122 | 0.919436% |
| C | 13268 | 217 | 1.635514% |
| D | 13268 | 134 | 1.009949% |
Noise dominated data is calculated using 1-second bins in cleaned event files. If a bin has >2000 counts, and if more than 50% of those come from <1% of pixels, then it is considered to be noise-dominated and hence unusable.
| Quadrant | # 1 sec bins | Bins with >0 counts | Bins with >2000 counts | High rate bins dominated by noise | Noise dominated (total time) | Noise dominated (detector-on time) | Marked lightcurve |
|---|---|---|---|---|---|---|---|
| A | 16268 | 13270 | 0 | 0 | 0.00% | 0.00% | 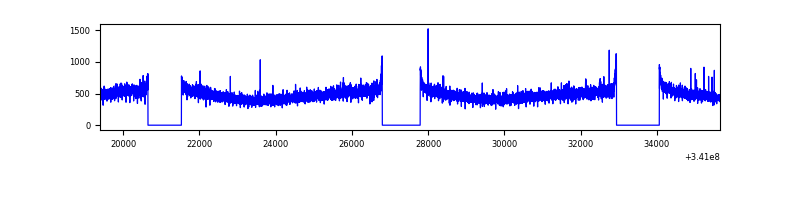 |
| B | 16269 | 13270 | 15 | 15 | 0.09% | 0.11% | 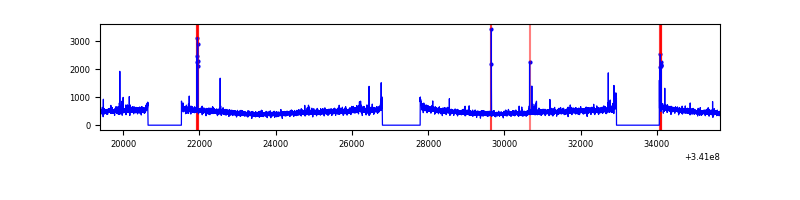 |
| C | 16268 | 13271 | 31 | 31 | 0.19% | 0.23% | 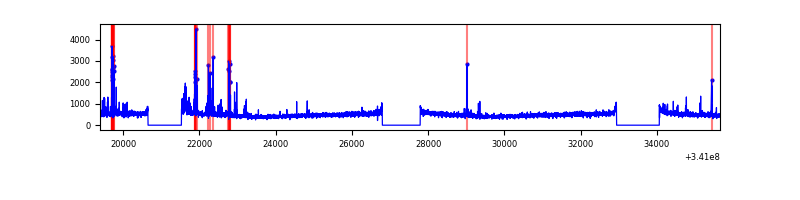 |
| D | 16268 | 13271 | 68 | 68 | 0.42% | 0.51% | 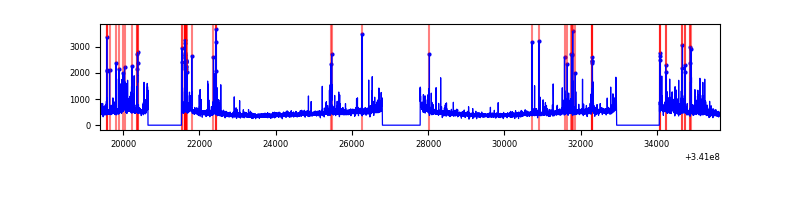 |
Top three noisy pixels from each quadrant. If the there are fewer than three noisy pixels in the level2.evt file, extra rows are filled as -1
| Pixel properties | Quadrant properties | ||||||
|---|---|---|---|---|---|---|---|
| Quadrant | DetID | PixID | Counts | Sigma | Mean | Median | Sigma |
| A | 13 | 254 | 21872 | 61.21 | 1655 | 1623 | 330.8 |
| A | 12 | 189 | 21068 | 58.78 | 1655 | 1623 | 330.8 |
| A | 3 | 137 | 15511 | 41.98 | 1655 | 1623 | 330.8 |
| B | 12 | 111 | 38457 | 118.81 | 1640 | 1600 | 310.2 |
| B | 0 | 229 | 36526 | 112.59 | 1640 | 1600 | 310.2 |
| B | 11 | 111 | 34017 | 104.5 | 1640 | 1600 | 310.2 |
| C | 14 | 238 | 253283 | 682.39 | 1574 | 1583 | 368.9 |
| C | 2 | 16 | 192773 | 518.34 | 1574 | 1583 | 368.9 |
| C | 15 | 208 | 171572 | 460.86 | 1574 | 1583 | 368.9 |
| D | 1 | 52 | 390115 | 1038.8 | 1586 | 1547 | 374.1 |
| D | 10 | 50 | 256014 | 680.29 | 1586 | 1547 | 374.1 |
| D | 2 | 250 | 231993 | 616.07 | 1586 | 1547 | 374.1 |
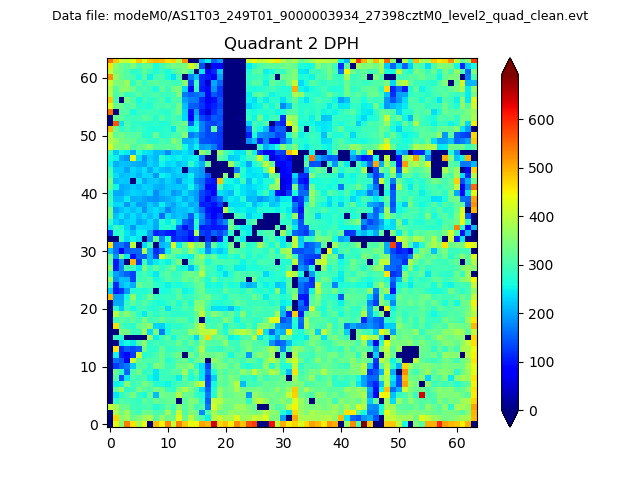
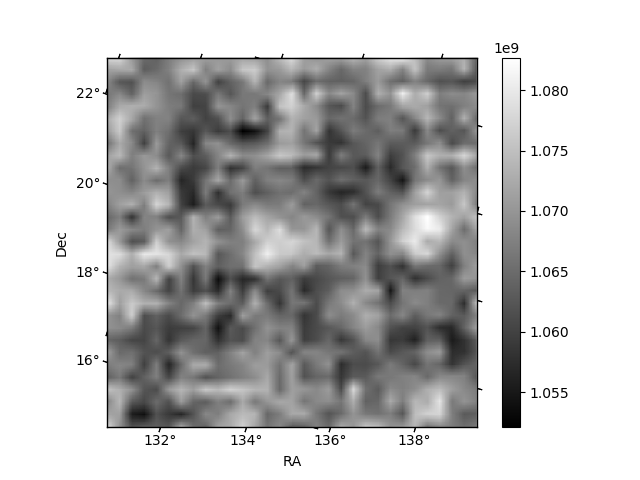
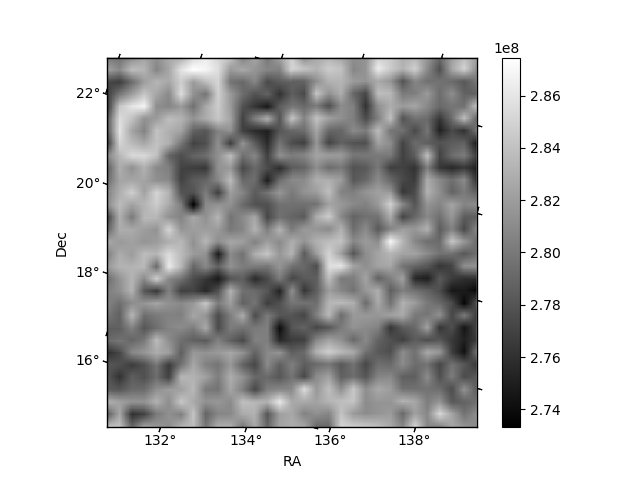
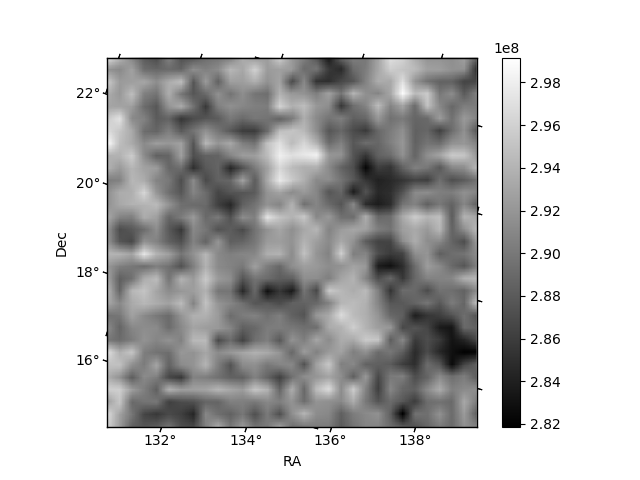
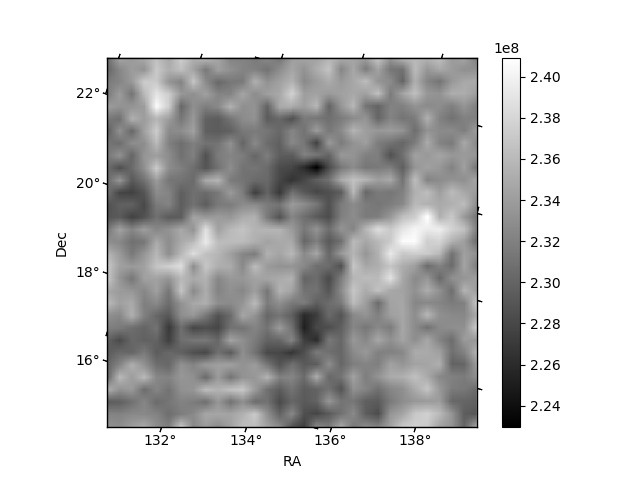
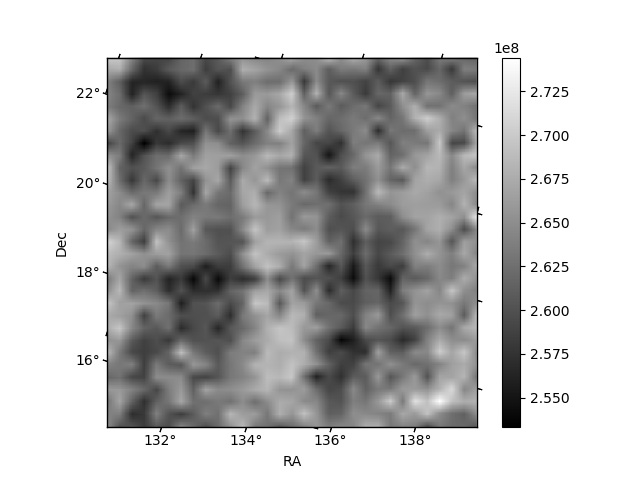
Histogram calculated using DETX and DETY for each event in the final _common_clean file
| Quadrant A | 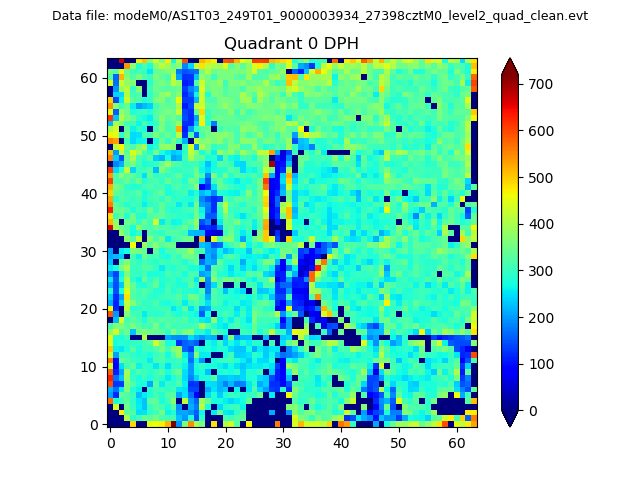 |
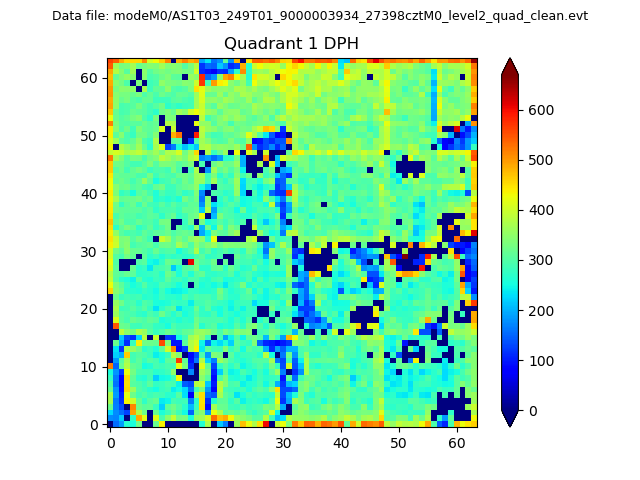 |
Quadrant B |
|---|---|---|---|
| Quadrant D | 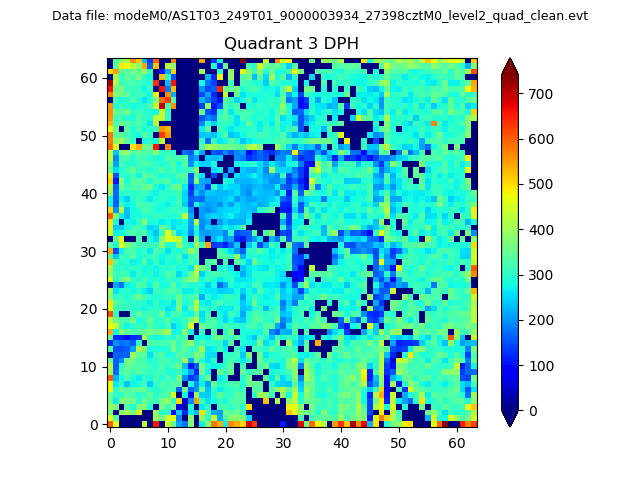 |
 |
Quadrant C |
| Plot type | Count rate plots | Images |
|---|---|---|
| Comparison with Poisson distribution Blue bars denote a histogram of data divided into 1 sec bins. Red curve is a Poisson curve with rate = median count rate of data. |
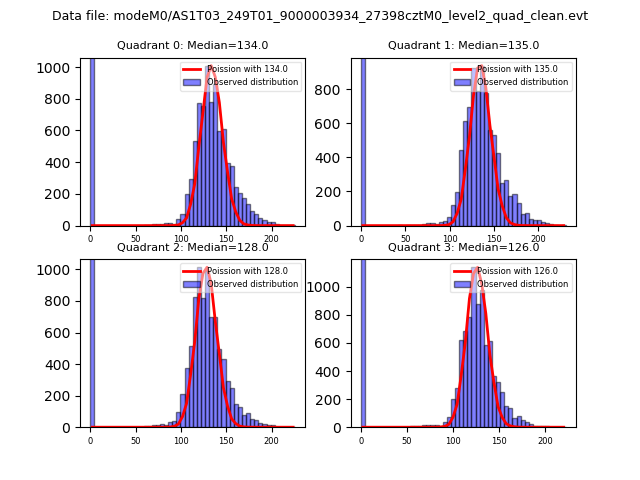 |
 |
| Quadrant-wise count rates Data is divided into 100 sec bins |
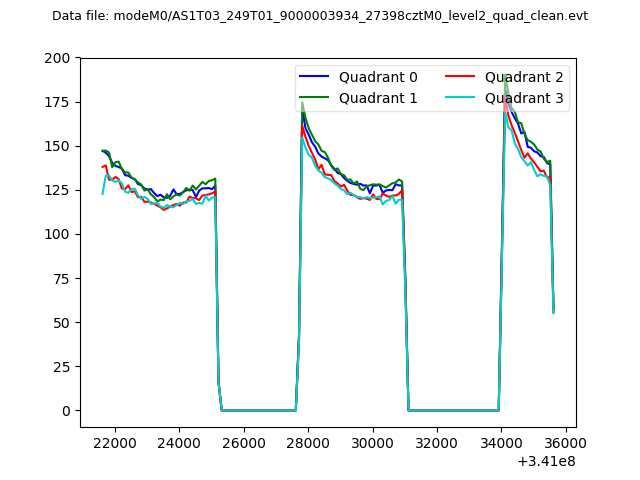 |
|
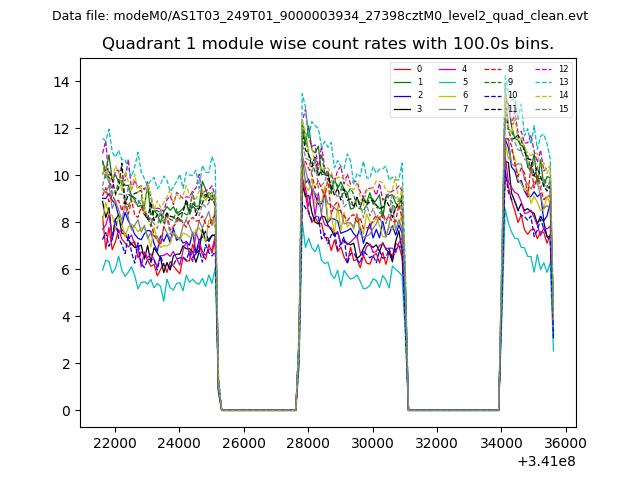
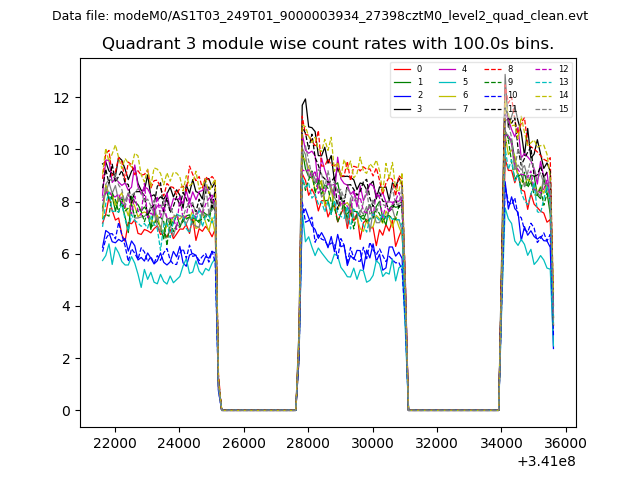
| Module-wise count rates for Quadrant A Data is divided into 100 sec bins |
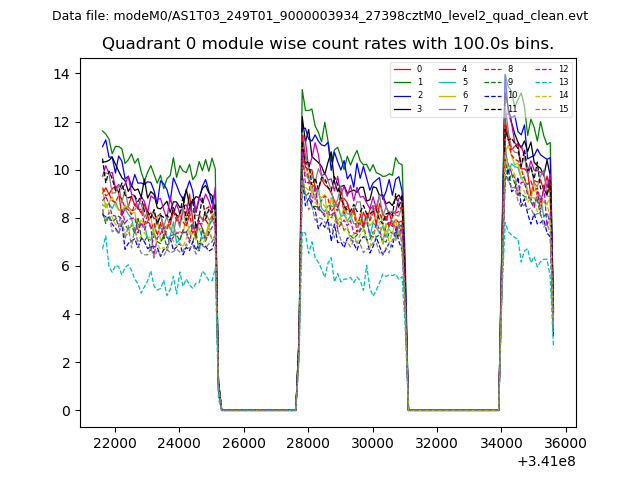 |
 |
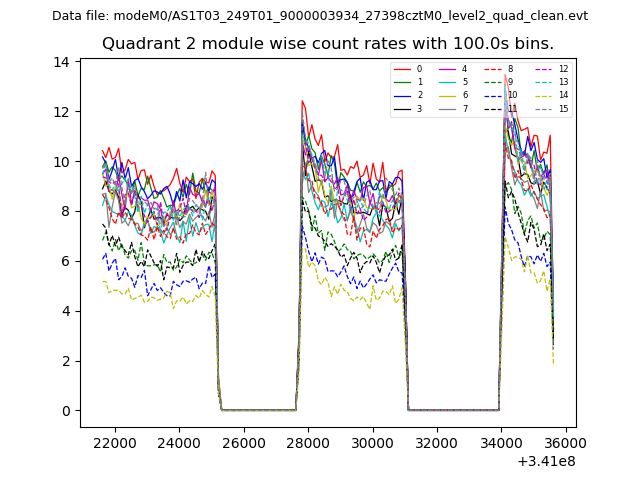
| Module-wise count rates for Quadrant B Data is divided into 100 sec bins |
 |
 |
| Module-wise count rates for Quadrant C Data is divided into 100 sec bins |
 |
 |
| Module-wise count rates for Quadrant D Data is divided into 100 sec bins |
 |
 |
| Parameter | Plot |
|---|---|
| CZT HV Monitor | 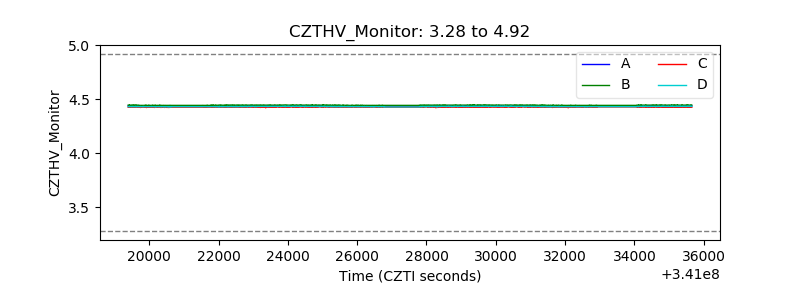 |
| D_VDD | 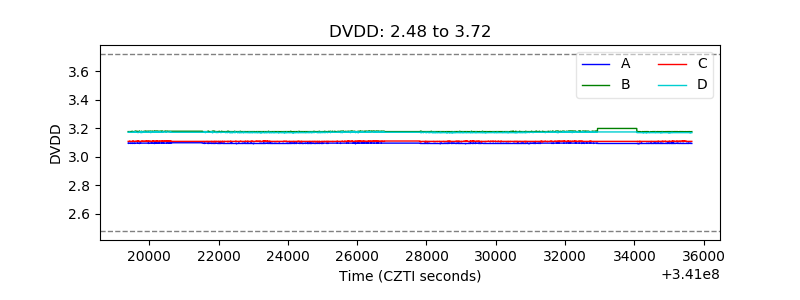 |
| Temperature 1 | 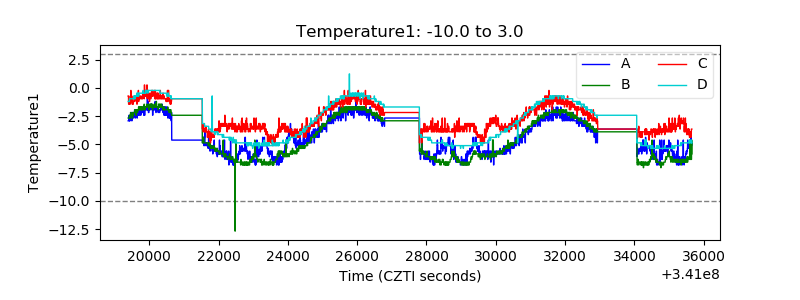 |
| Veto HV Monitor | 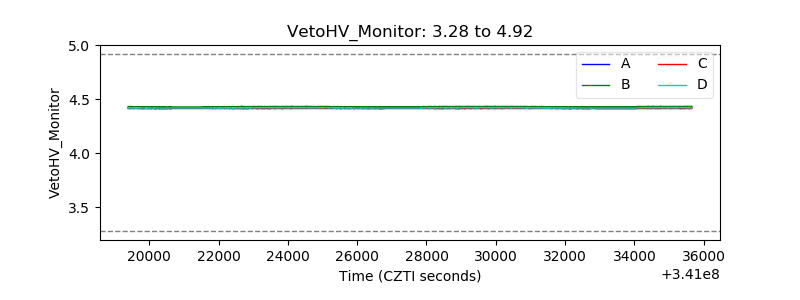 |
| Veto LLD | 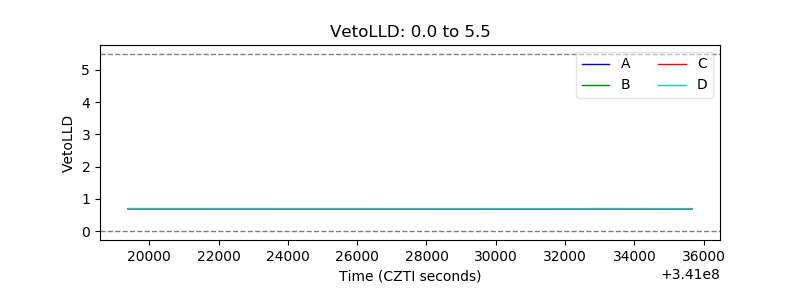 |
| Alpha Counter | 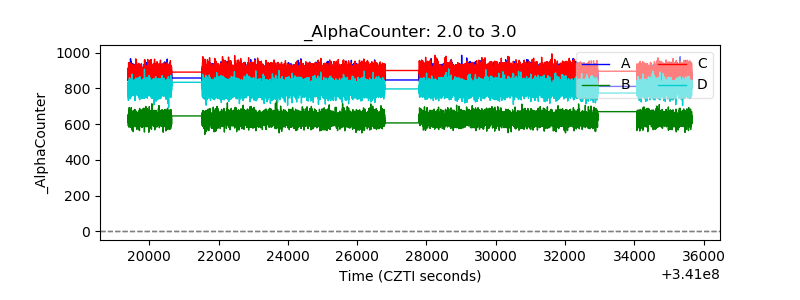 |
| _CPM_Rate | 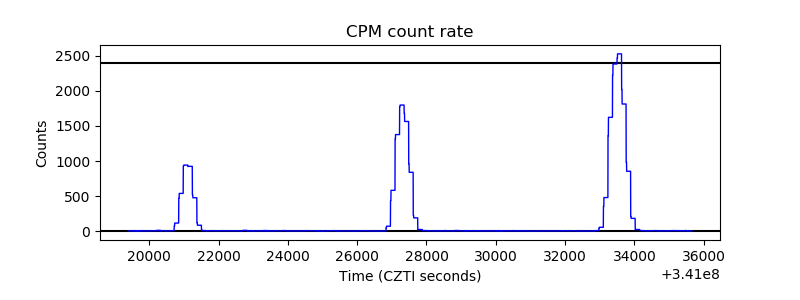 |
| CZT Counter | 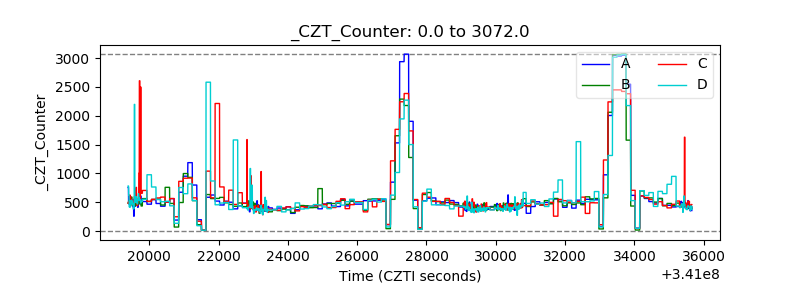 |
| +2.5 Volts monitor |  |
| +5 Volts monitor |  |
| _ROLL_ROT | 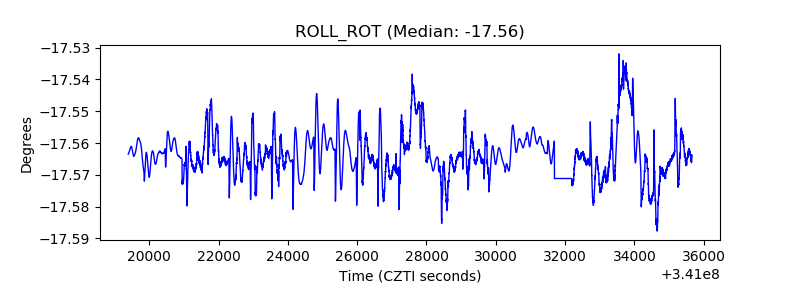 |
| _Roll_DEC | 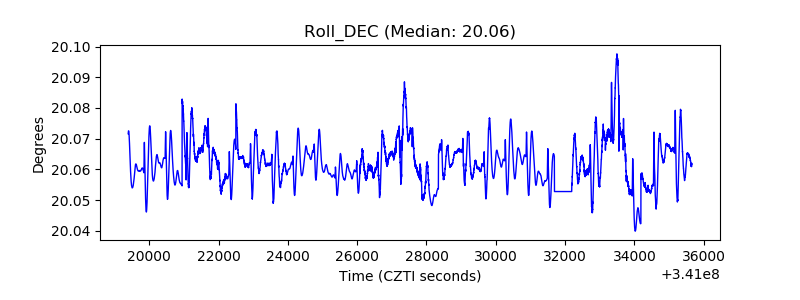 |
| _Roll_RA | 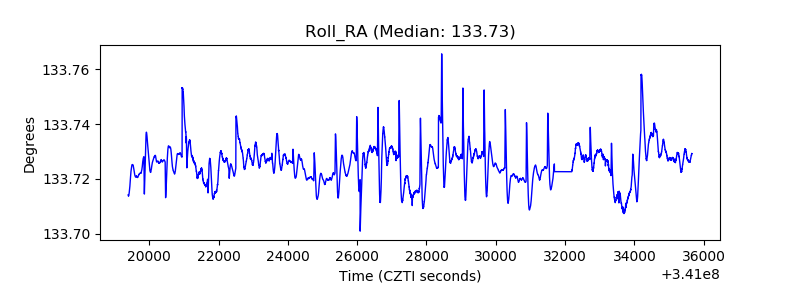 |
| Veto Counter |  |