| Param | Original file | Final file |
|---|---|---|
| Filename | modeM0/AS1T03_249T01_9000003934_27400cztM0_level2.evt | modeM0/AS1T03_249T01_9000003934_27400cztM0_level2_quad_clean.evt |
| Size (bytes) | 825,428,160 | 139,821,120 |
| Size | 787.2 MB | 133.3 MB |
| Events in quadrant A | 5,274,265 | 901,701 |
| Events in quadrant B | 5,415,481 | 921,008 |
| Events in quadrant C | 5,342,728 | 866,338 |
| Events in quadrant D | 8,272,718 | 835,694 |
| Mode M0 | |||
|---|---|---|---|
| Quadrant | BADHDUFLAG | Total packets | Discarded packets |
| A | 0 | 21591 | 0 |
| B | 0 | 22130 | 0 |
| C | 0 | 21901 | 0 |
| D | 0 | 31395 | 0 |
| Mode M9 | |||
|---|---|---|---|
| Quadrant | BADHDUFLAG | Total packets | Discarded packets |
| A | 0 | 24 | 0 |
| B | 0 | 24 | 0 |
| C | 0 | 24 | 0 |
| D | 0 | 24 | 0 |
| Quadrant | Total seconds | Saturated seconds | Saturation percentage |
|---|---|---|---|
| A | 10238 | 74 | 0.722797% |
| B | 10239 | 112 | 1.093857% |
| C | 10239 | 156 | 1.523586% |
| D | 10239 | 776 | 7.578865% |
Noise dominated data is calculated using 1-second bins in cleaned event files. If a bin has >2000 counts, and if more than 50% of those come from <1% of pixels, then it is considered to be noise-dominated and hence unusable.
| Quadrant | # 1 sec bins | Bins with >0 counts | Bins with >2000 counts | High rate bins dominated by noise | Noise dominated (total time) | Noise dominated (detector-on time) | Marked lightcurve |
|---|---|---|---|---|---|---|---|
| A | 12728 | 10240 | 4 | 4 | 0.03% | 0.04% | 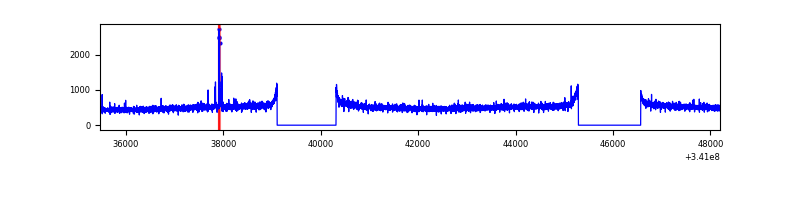 |
| B | 12729 | 10241 | 2 | 2 | 0.02% | 0.02% | 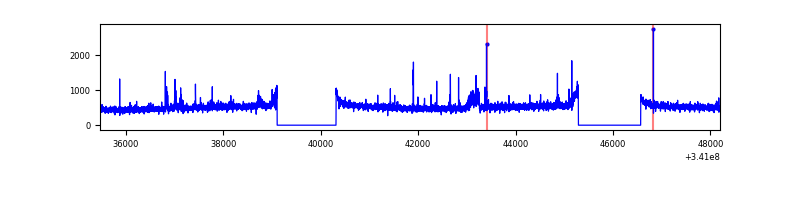 |
| C | 12729 | 10241 | 0 | 0 | 0.00% | 0.00% | 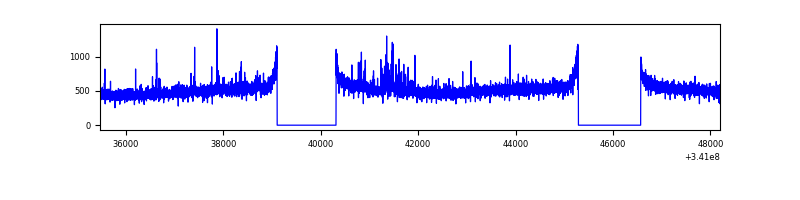 |
| D | 12729 | 10241 | 600 | 600 | 4.71% | 5.86% | 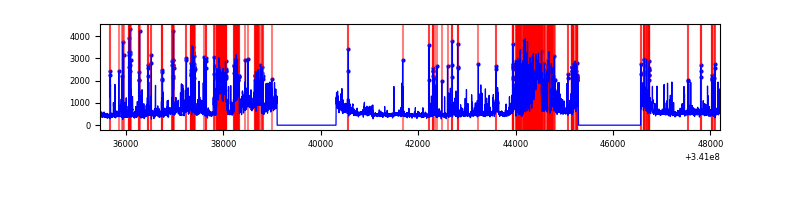 |
Top three noisy pixels from each quadrant. If the there are fewer than three noisy pixels in the level2.evt file, extra rows are filled as -1
| Pixel properties | Quadrant properties | ||||||
|---|---|---|---|---|---|---|---|
| Quadrant | DetID | PixID | Counts | Sigma | Mean | Median | Sigma |
| A | 12 | 96 | 37540 | 134.56 | 1354 | 1329 | 269.1 |
| A | 13 | 254 | 17945 | 61.74 | 1354 | 1329 | 269.1 |
| A | 12 | 189 | 13210 | 44.15 | 1354 | 1329 | 269.1 |
| B | 0 | 230 | 73077 | 288.99 | 1338 | 1309 | 248.3 |
| B | 15 | 32 | 31359 | 121.0 | 1338 | 1309 | 248.3 |
| B | 12 | 111 | 30376 | 117.05 | 1338 | 1309 | 248.3 |
| C | 14 | 238 | 209399 | 700.37 | 1286 | 1300 | 297.1 |
| C | 2 | 16 | 113764 | 378.5 | 1286 | 1300 | 297.1 |
| C | 1 | 16 | 9161 | 26.46 | 1286 | 1300 | 297.1 |
| D | 1 | 52 | 3004279 | 10110.43 | 1268 | 1239 | 297.0 |
| D | 2 | 250 | 334378 | 1121.59 | 1268 | 1239 | 297.0 |
| D | 7 | 38 | 89007 | 295.49 | 1268 | 1239 | 297.0 |
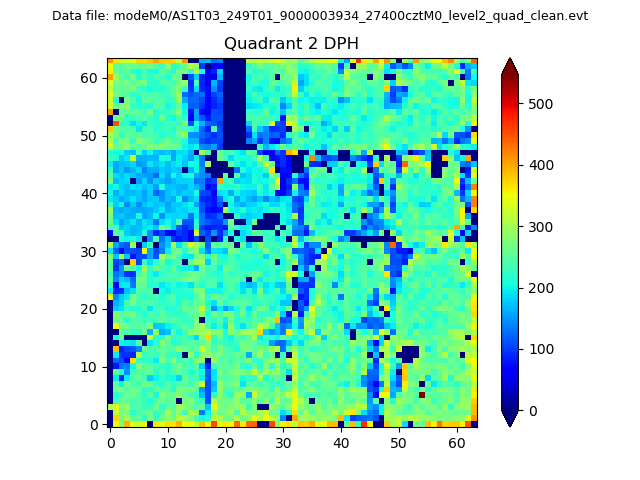
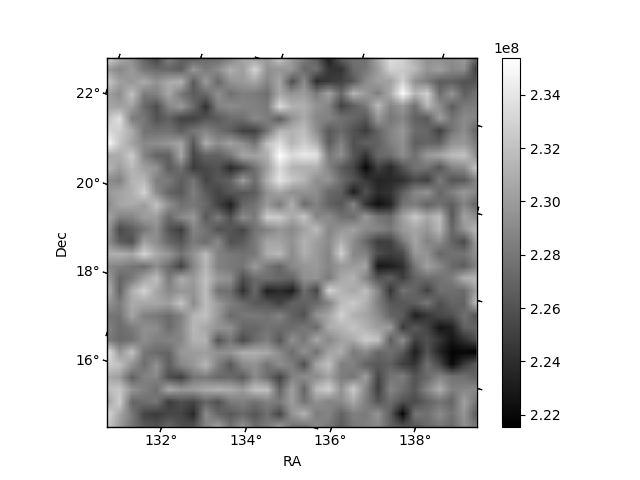
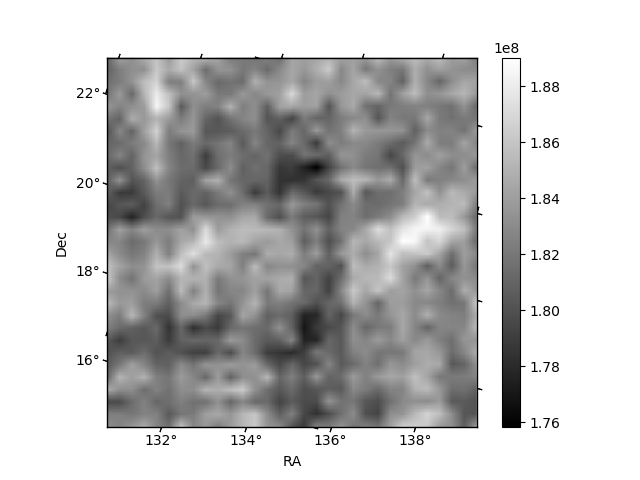
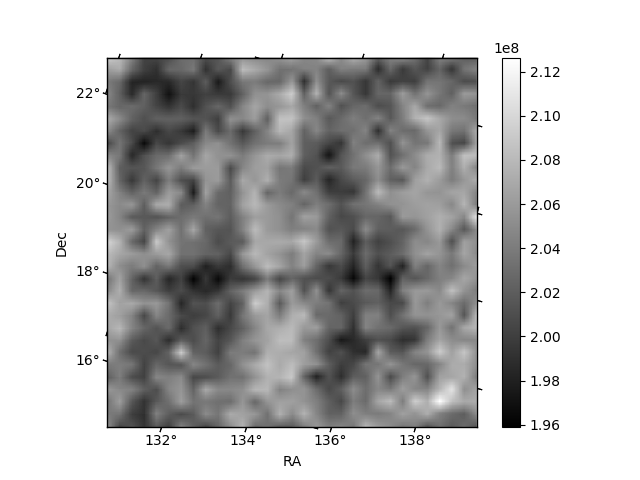
Histogram calculated using DETX and DETY for each event in the final _common_clean file
| Quadrant A | 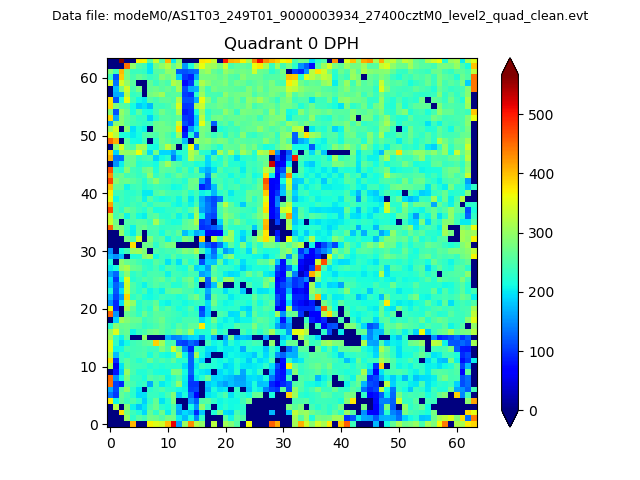 |
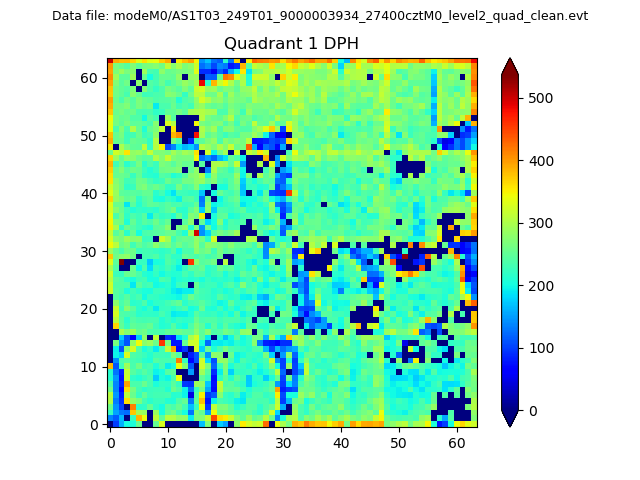 |
Quadrant B |
|---|---|---|---|
| Quadrant D | 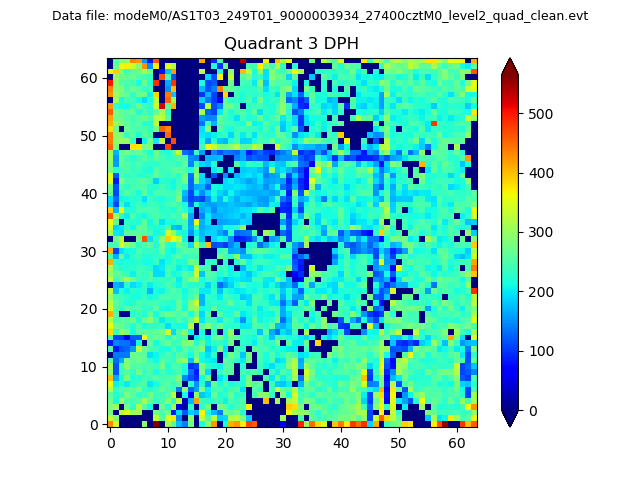 |
 |
Quadrant C |
| Plot type | Count rate plots | Images |
|---|---|---|
| Comparison with Poisson distribution Blue bars denote a histogram of data divided into 1 sec bins. Red curve is a Poisson curve with rate = median count rate of data. |
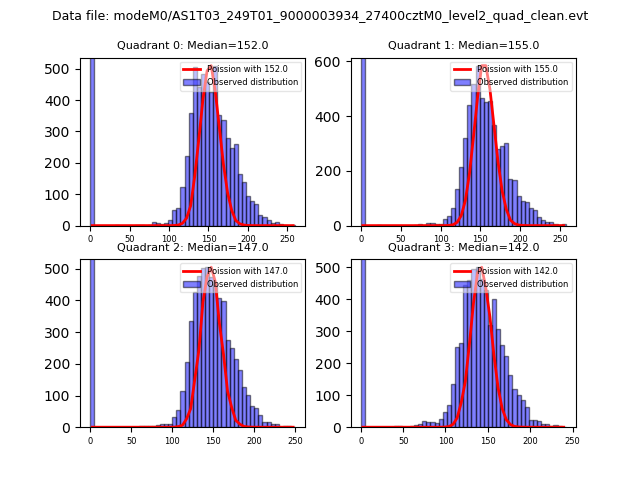 |
 |
| Quadrant-wise count rates Data is divided into 100 sec bins |
 |
|
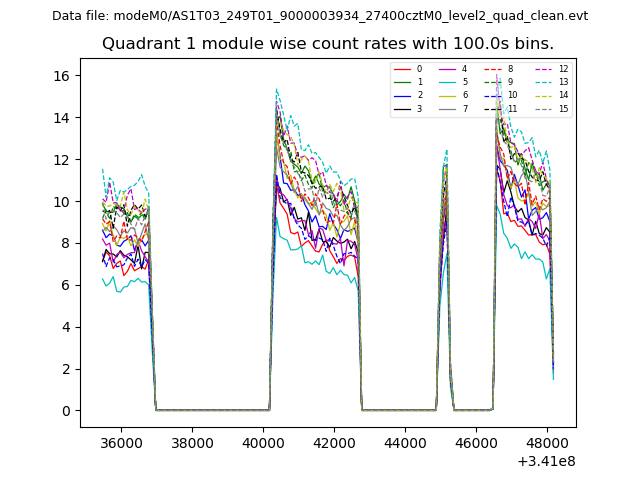
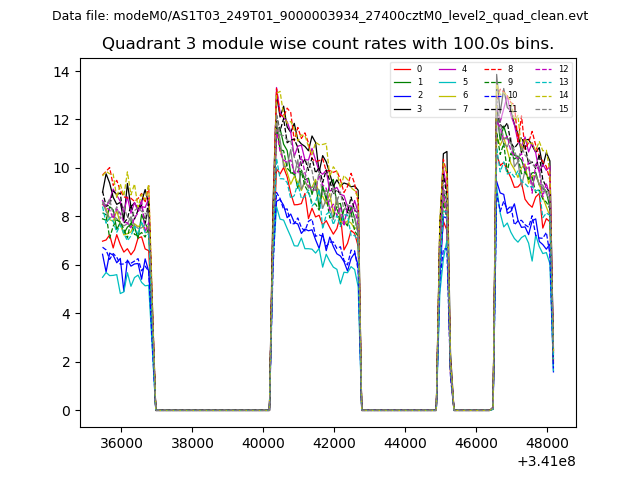
| Module-wise count rates for Quadrant A Data is divided into 100 sec bins |
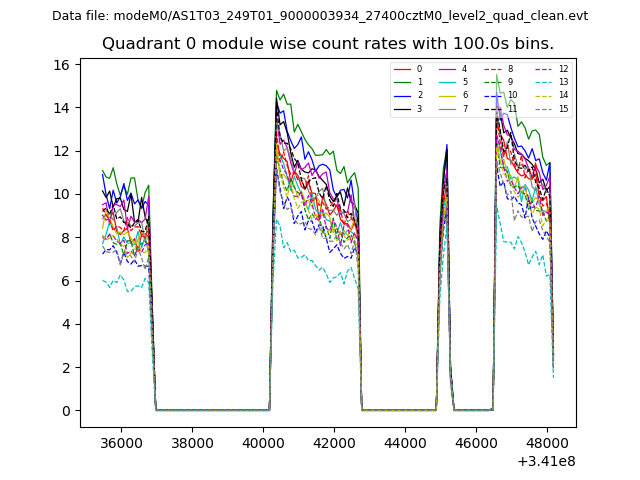 |
 |
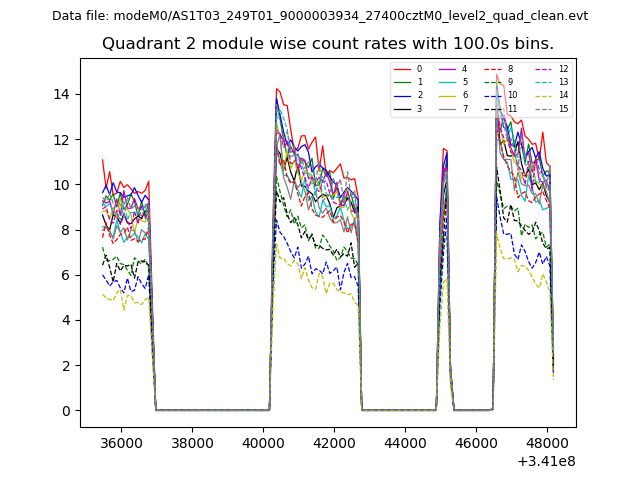
| Module-wise count rates for Quadrant B Data is divided into 100 sec bins |
 |
 |
| Module-wise count rates for Quadrant C Data is divided into 100 sec bins |
 |
 |
| Module-wise count rates for Quadrant D Data is divided into 100 sec bins |
 |
 |
| Parameter | Plot |
|---|---|
| CZT HV Monitor | 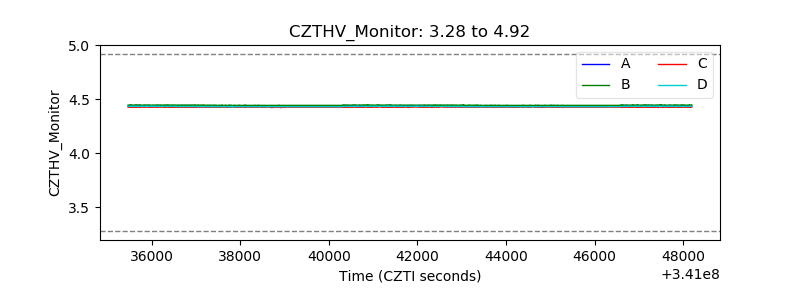 |
| D_VDD | 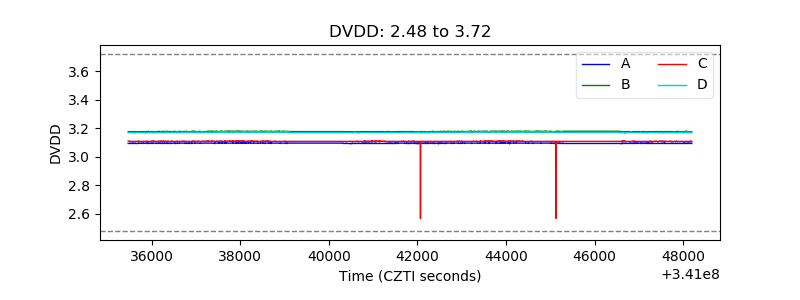 |
| Temperature 1 | 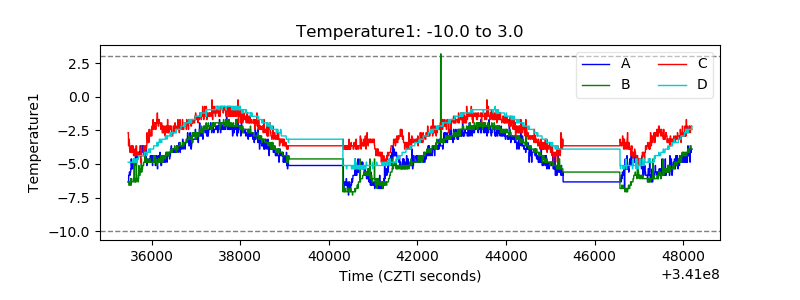 |
| Veto HV Monitor | 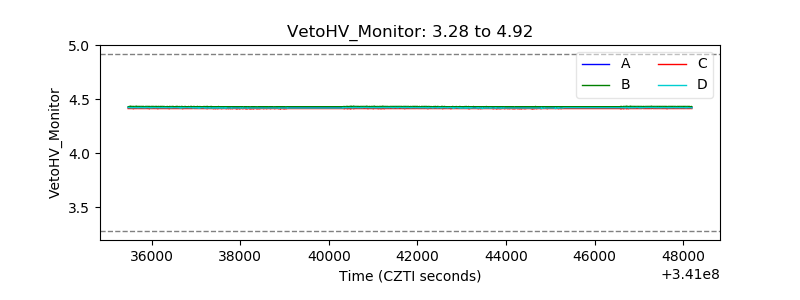 |
| Veto LLD | 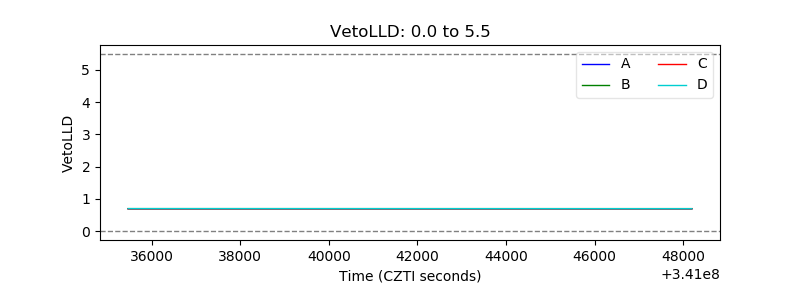 |
| Alpha Counter | 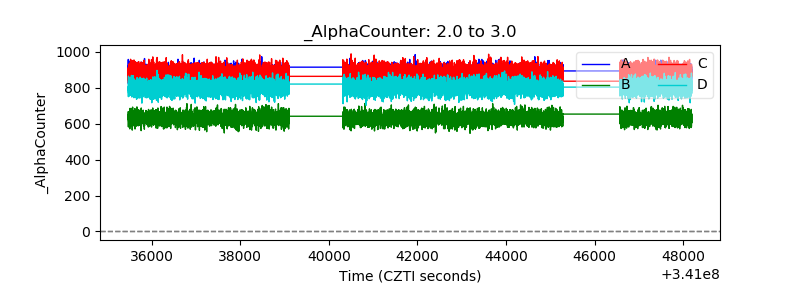 |
| _CPM_Rate |  |
| CZT Counter | 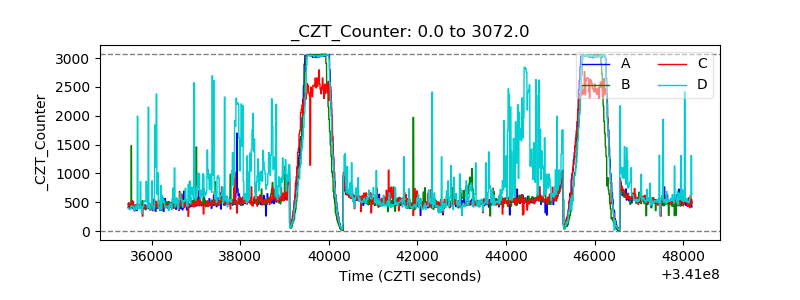 |
| +2.5 Volts monitor |  |
| +5 Volts monitor |  |
| _ROLL_ROT | 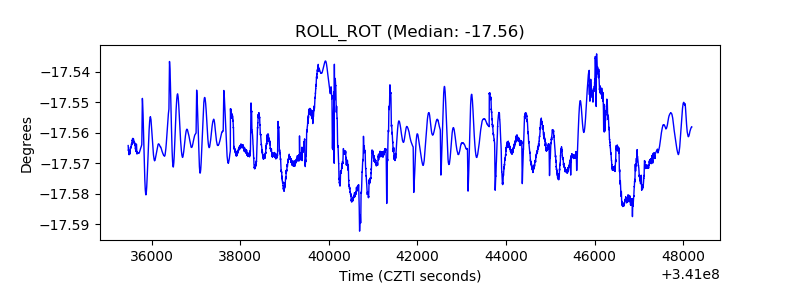 |
| _Roll_DEC | 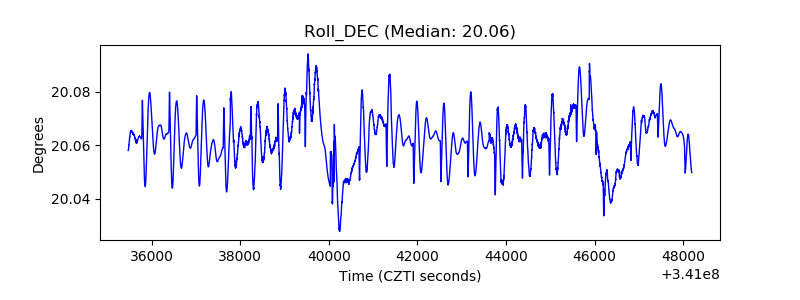 |
| _Roll_RA | 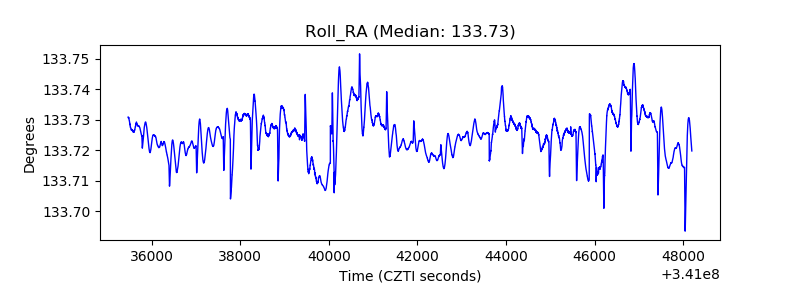 |
| Veto Counter | 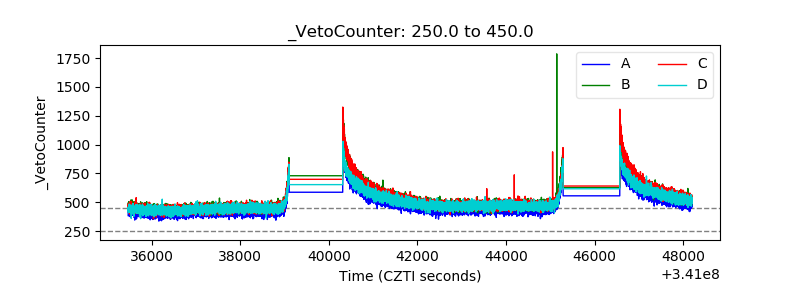 |