| Param | Original file | Final file |
|---|---|---|
| Filename | modeM0/AS1T03_249T01_9000003934_27401cztM0_level2.evt | modeM0/AS1T03_249T01_9000003934_27401cztM0_level2_quad_clean.evt |
| Size (bytes) | 1,106,049,600 | 167,385,600 |
| Size | 1.0 GB | 159.6 MB |
| Events in quadrant A | 6,952,211 | 1,060,986 |
| Events in quadrant B | 7,183,059 | 1,083,626 |
| Events in quadrant C | 7,024,532 | 1,022,589 |
| Events in quadrant D | 11,423,573 | 967,711 |
| Mode M0 | |||
|---|---|---|---|
| Quadrant | BADHDUFLAG | Total packets | Discarded packets |
| A | 0 | 28283 | 0 |
| B | 0 | 29205 | 0 |
| C | 0 | 28626 | 0 |
| D | 0 | 42831 | 0 |
| Mode M9 | |||
|---|---|---|---|
| Quadrant | BADHDUFLAG | Total packets | Discarded packets |
| A | 0 | 38 | 7 |
| B | 0 | 38 | 7 |
| C | 0 | 38 | 6 |
| D | 0 | 38 | 9 |
| Quadrant | Total seconds | Saturated seconds | Saturation percentage |
|---|---|---|---|
| A | 13441 | 91 | 0.677033% |
| B | 13459 | 128 | 0.951036% |
| C | 13459 | 193 | 1.433985% |
| D | 13386 | 1145 | 8.553713% |
Noise dominated data is calculated using 1-second bins in cleaned event files. If a bin has >2000 counts, and if more than 50% of those come from <1% of pixels, then it is considered to be noise-dominated and hence unusable.
| Quadrant | # 1 sec bins | Bins with >0 counts | Bins with >2000 counts | High rate bins dominated by noise | Noise dominated (total time) | Noise dominated (detector-on time) | Marked lightcurve |
|---|---|---|---|---|---|---|---|
| A | 18579 | 13607 | 6 | 6 | 0.03% | 0.04% | 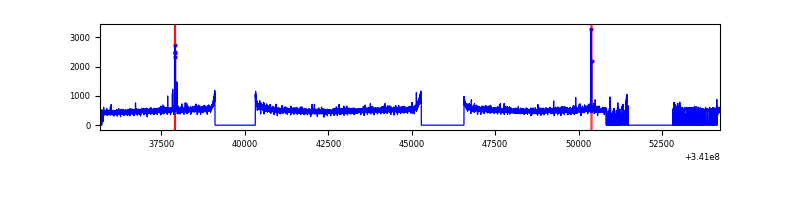 |
| B | 18582 | 13639 | 2 | 2 | 0.01% | 0.01% | 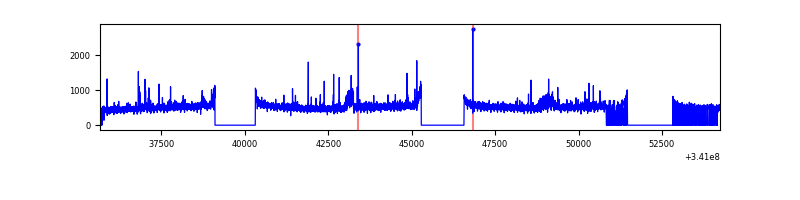 |
| C | 18584 | 13631 | 1 | 1 | 0.01% | 0.01% | 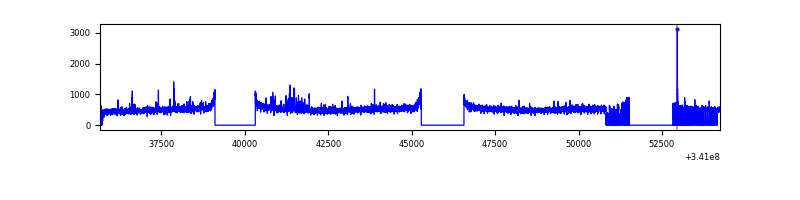 |
| D | 18581 | 13505 | 914 | 914 | 4.92% | 6.77% | 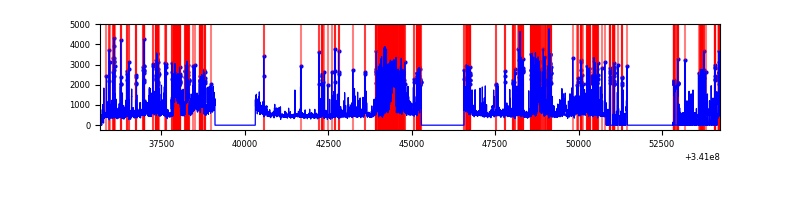 |
Top three noisy pixels from each quadrant. If the there are fewer than three noisy pixels in the level2.evt file, extra rows are filled as -1
| Pixel properties | Quadrant properties | ||||||
|---|---|---|---|---|---|---|---|
| Quadrant | DetID | PixID | Counts | Sigma | Mean | Median | Sigma |
| A | 12 | 96 | 50914 | 139.33 | 1785 | 1752 | 352.8 |
| A | 13 | 254 | 23229 | 60.87 | 1785 | 1752 | 352.8 |
| A | 12 | 189 | 15924 | 40.16 | 1785 | 1752 | 352.8 |
| B | 0 | 230 | 154137 | 467.37 | 1763 | 1725 | 326.1 |
| B | 12 | 111 | 39772 | 116.67 | 1763 | 1725 | 326.1 |
| B | 15 | 32 | 38755 | 113.55 | 1763 | 1725 | 326.1 |
| C | 14 | 238 | 276433 | 700.37 | 1699 | 1713 | 392.2 |
| C | 2 | 16 | 122971 | 309.13 | 1699 | 1713 | 392.2 |
| C | 13 | 61 | 11597 | 25.2 | 1699 | 1713 | 392.2 |
| D | 1 | 52 | 4531672 | 11680.1 | 1660 | 1624 | 387.8 |
| D | 2 | 250 | 378954 | 972.89 | 1660 | 1624 | 387.8 |
| D | 10 | 50 | 112812 | 286.68 | 1660 | 1624 | 387.8 |
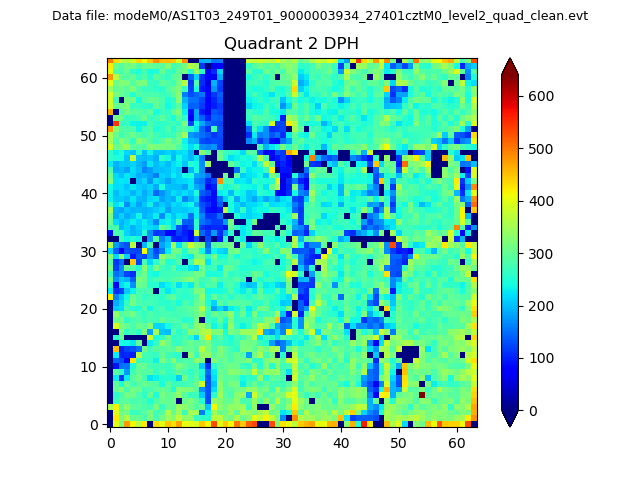
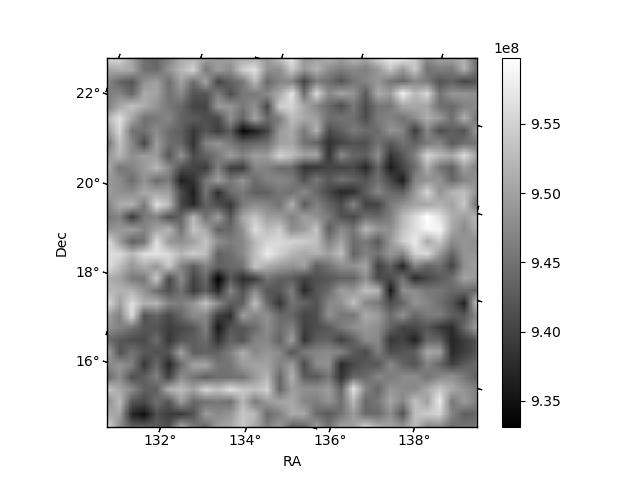
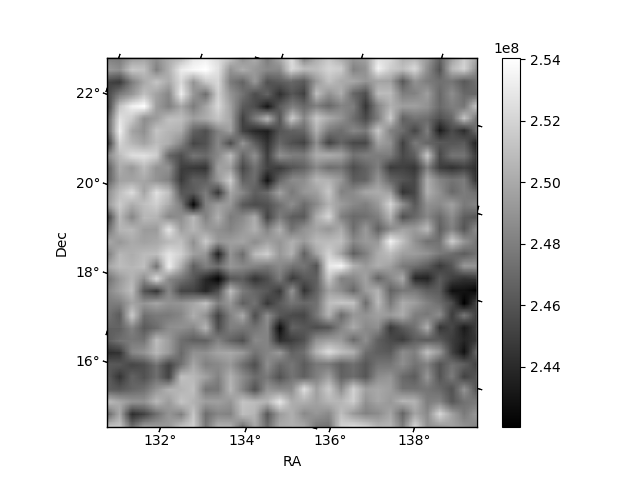
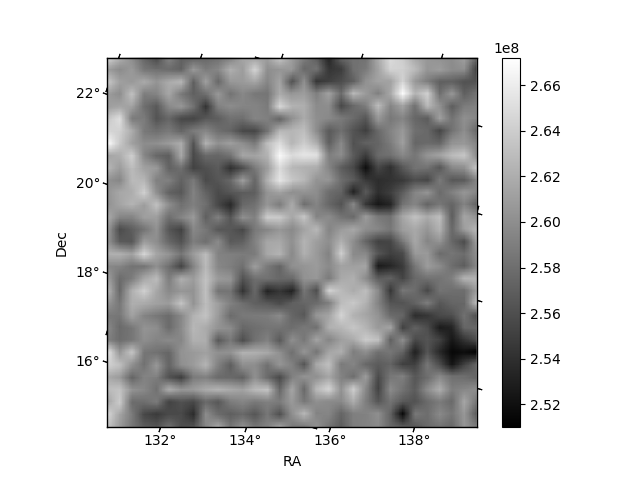
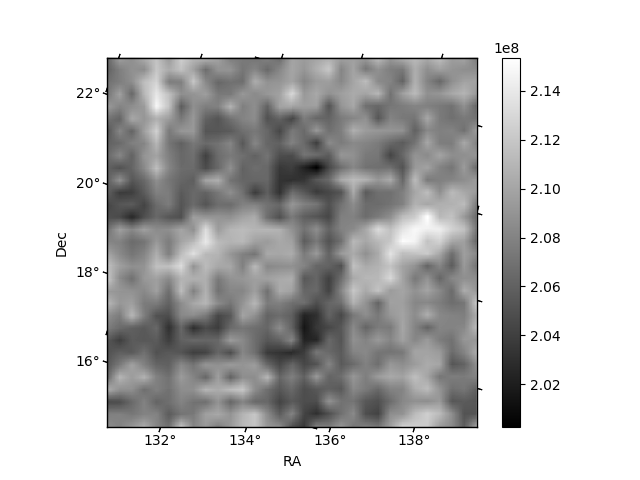
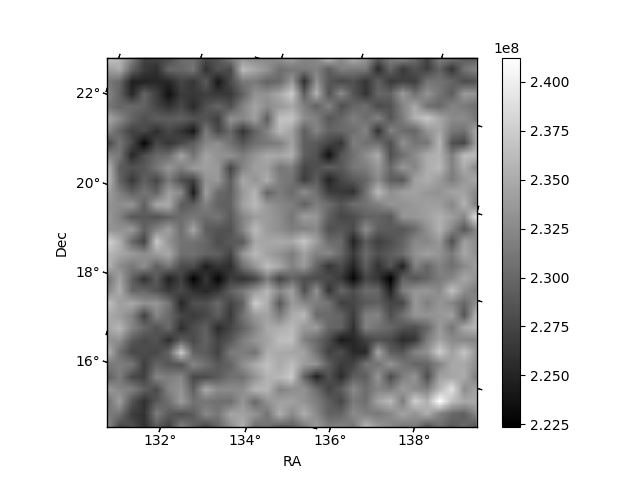
Histogram calculated using DETX and DETY for each event in the final _common_clean file
| Quadrant A | 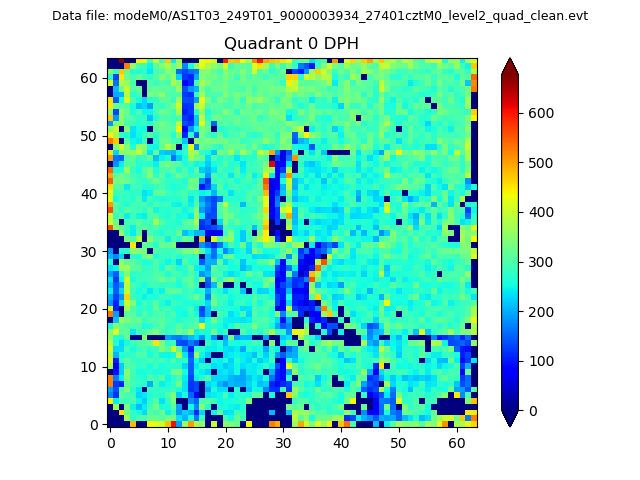 |
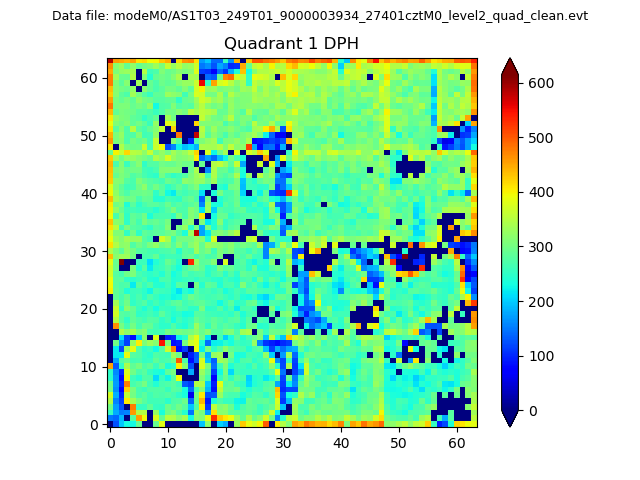 |
Quadrant B |
|---|---|---|---|
| Quadrant D | 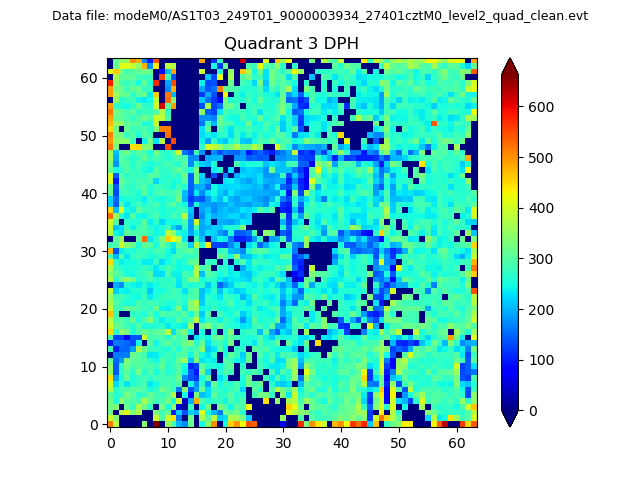 |
 |
Quadrant C |
| Plot type | Count rate plots | Images |
|---|---|---|
| Comparison with Poisson distribution Blue bars denote a histogram of data divided into 1 sec bins. Red curve is a Poisson curve with rate = median count rate of data. |
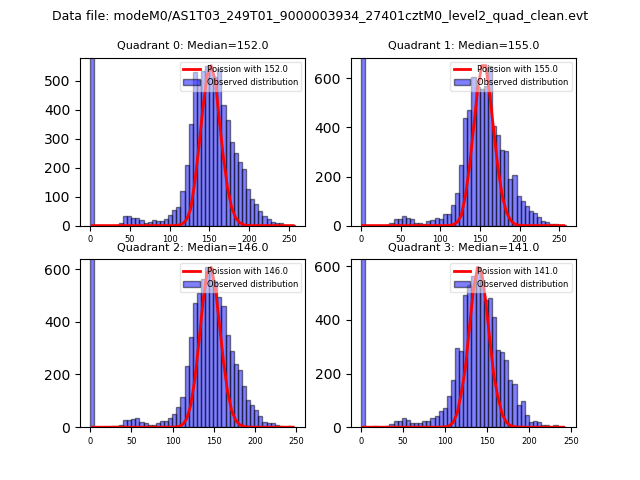 |
 |
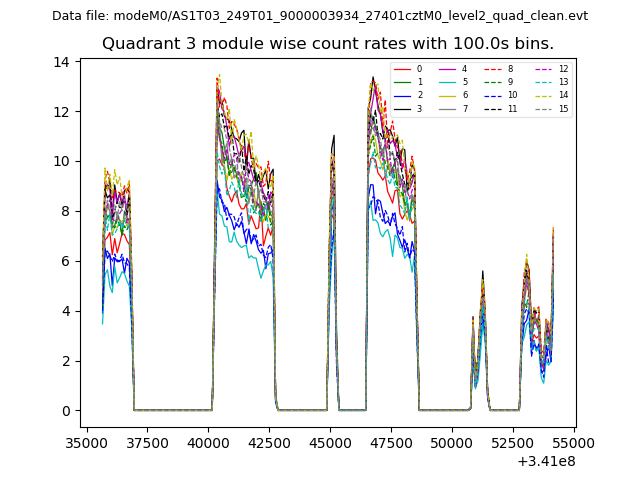
| Quadrant-wise count rates Data is divided into 100 sec bins |
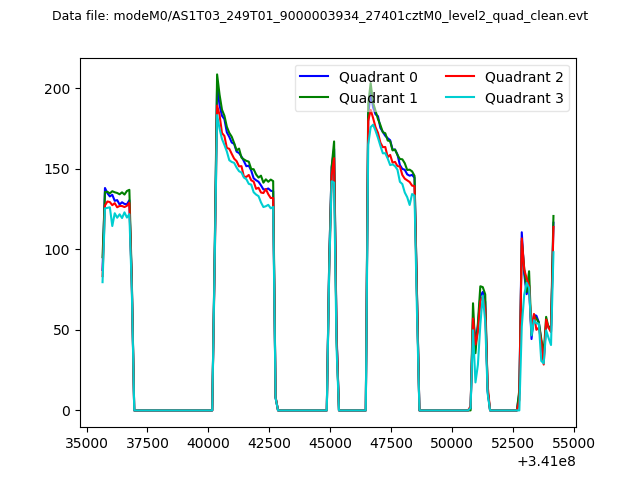 |
|
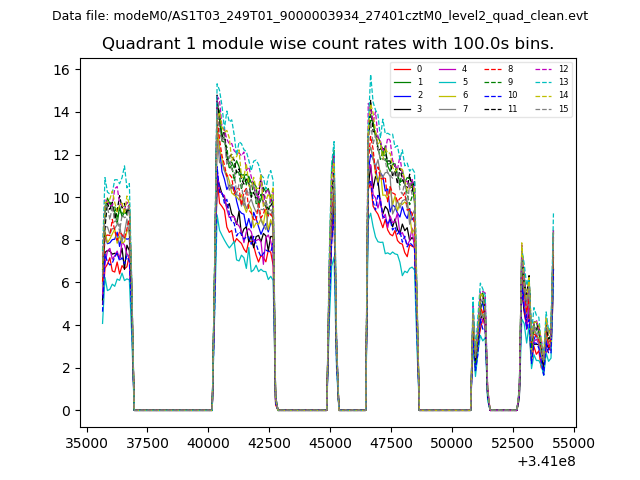
| Module-wise count rates for Quadrant A Data is divided into 100 sec bins |
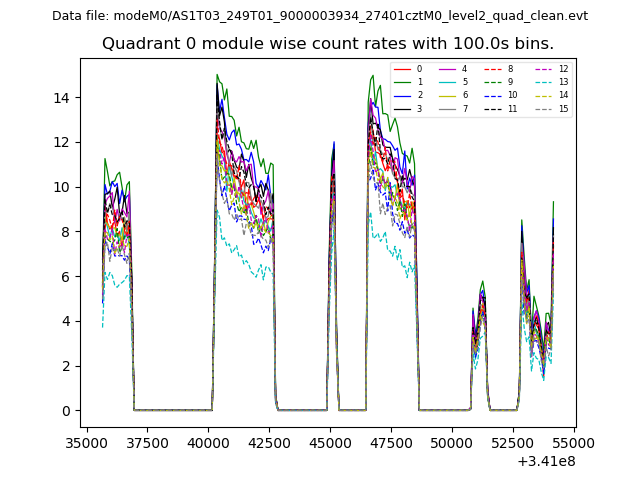 |
 |
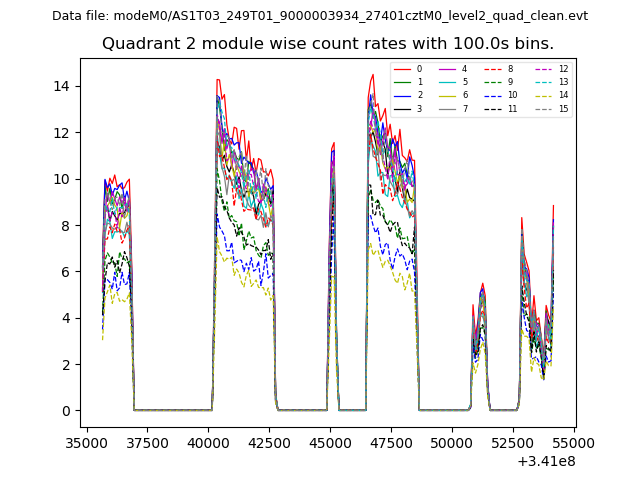
| Module-wise count rates for Quadrant B Data is divided into 100 sec bins |
 |
 |
| Module-wise count rates for Quadrant C Data is divided into 100 sec bins |
 |
 |
| Module-wise count rates for Quadrant D Data is divided into 100 sec bins |
 |
 |
| Parameter | Plot |
|---|---|
| CZT HV Monitor | 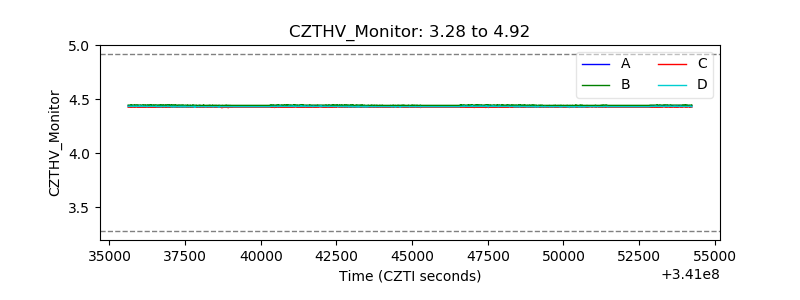 |
| D_VDD | 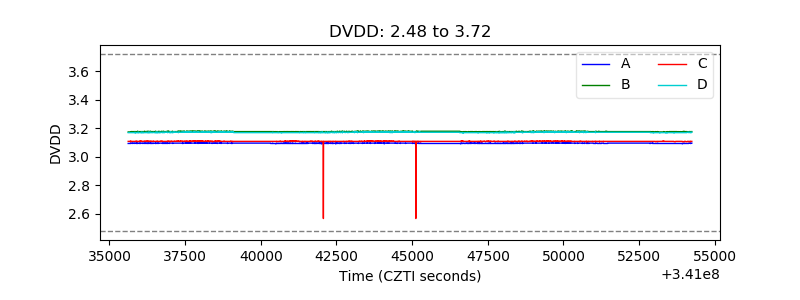 |
| Temperature 1 | 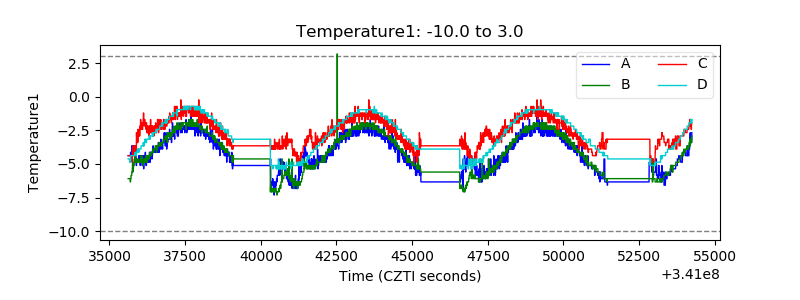 |
| Veto HV Monitor |  |
| Veto LLD | 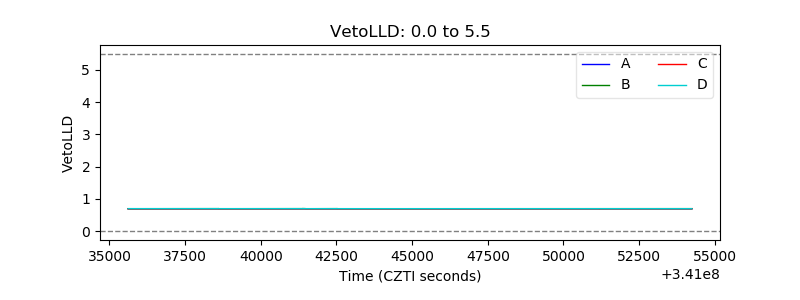 |
| Alpha Counter | 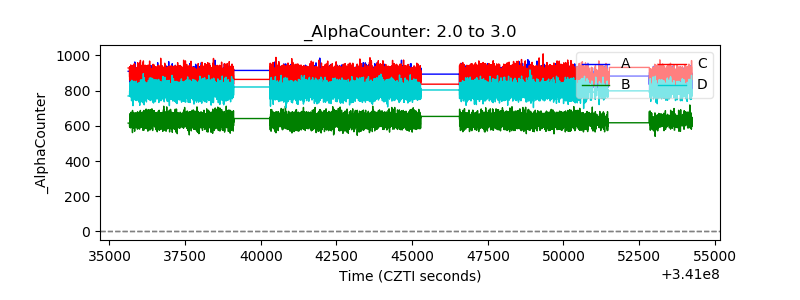 |
| _CPM_Rate |  |
| CZT Counter | 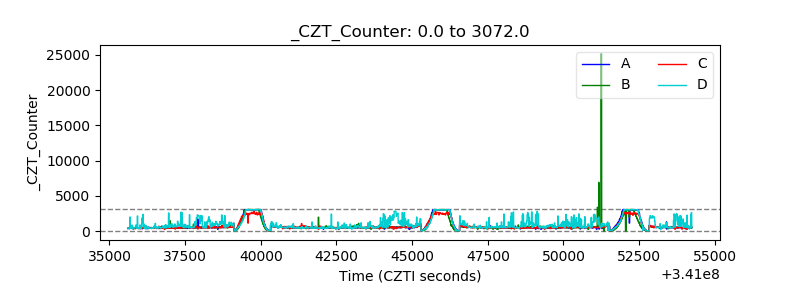 |
| +2.5 Volts monitor |  |
| +5 Volts monitor |  |
| _ROLL_ROT | 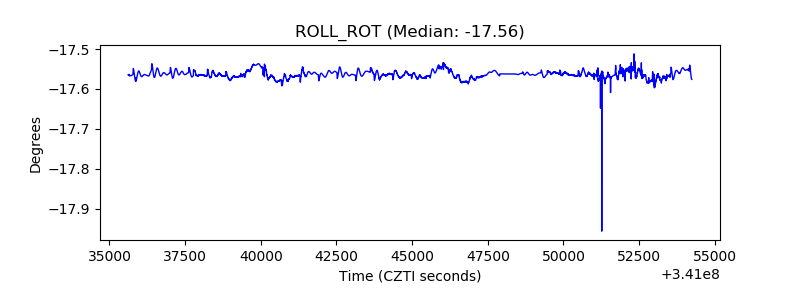 |
| _Roll_DEC | 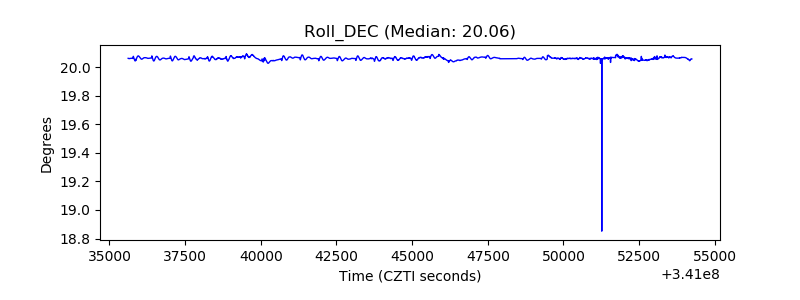 |
| _Roll_RA | 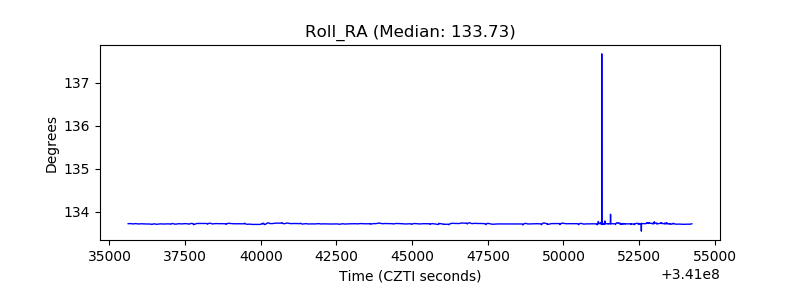 |
| Veto Counter | 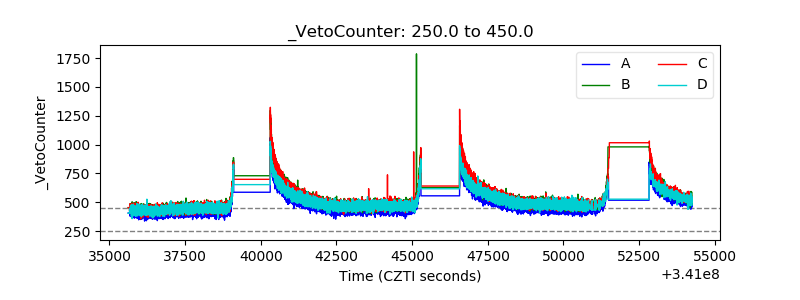 |