| Param | Original file | Final file |
|---|---|---|
| Filename | modeM0/AS1T03_249T01_9000003934_27404cztM0_level2.evt | modeM0/AS1T03_249T01_9000003934_27404cztM0_level2_quad_clean.evt |
| Size (bytes) | 2,361,631,680 | 370,713,600 |
| Size | 2.2 GB | 353.5 MB |
| Events in quadrant A | 15,106,986 | 2,367,922 |
| Events in quadrant B | 15,492,566 | 2,383,938 |
| Events in quadrant C | 15,380,288 | 2,270,262 |
| Events in quadrant D | 23,562,424 | 2,186,550 |
| Mode M0 | |||
|---|---|---|---|
| Quadrant | BADHDUFLAG | Total packets | Discarded packets |
| A | 0 | 61557 | 0 |
| B | 0 | 63078 | 0 |
| C | 0 | 62574 | 0 |
| D | 0 | 89104 | 0 |
| Mode M9 | |||
|---|---|---|---|
| Quadrant | BADHDUFLAG | Total packets | Discarded packets |
| A | 0 | 65 | 0 |
| B | 0 | 65 | 0 |
| C | 0 | 66 | 2 |
| D | 0 | 65 | 0 |
| Quadrant | Total seconds | Saturated seconds | Saturation percentage |
|---|---|---|---|
| A | 29314 | 414 | 1.412294% |
| B | 29330 | 495 | 1.687692% |
| C | 29318 | 618 | 2.107920% |
| D | 29267 | 2180 | 7.448662% |
Noise dominated data is calculated using 1-second bins in cleaned event files. If a bin has >2000 counts, and if more than 50% of those come from <1% of pixels, then it is considered to be noise-dominated and hence unusable.
| Quadrant | # 1 sec bins | Bins with >0 counts | Bins with >2000 counts | High rate bins dominated by noise | Noise dominated (total time) | Noise dominated (detector-on time) | Marked lightcurve |
|---|---|---|---|---|---|---|---|
| A | 37565 | 29451 | 10 | 10 | 0.03% | 0.03% | 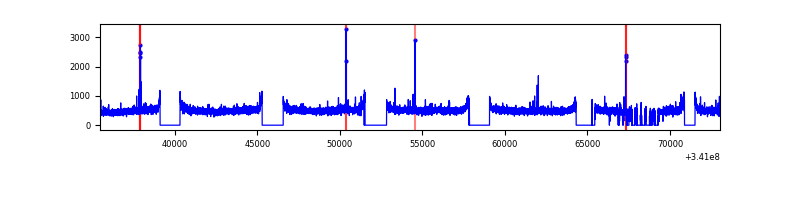 |
| B | 37565 | 29484 | 40 | 40 | 0.11% | 0.14% | 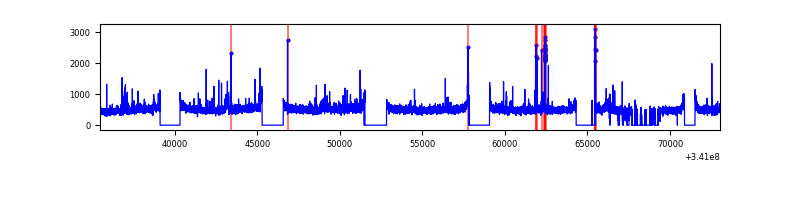 |
| C | 37565 | 29461 | 38 | 38 | 0.10% | 0.13% | 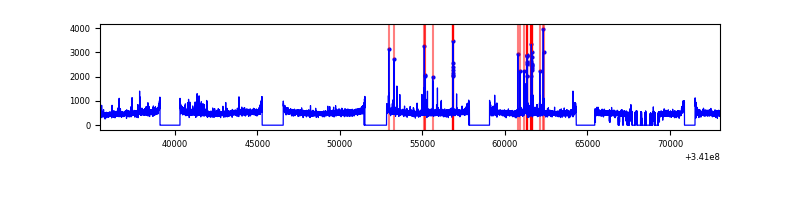 |
| D | 37565 | 29392 | 1607 | 1607 | 4.28% | 5.47% | 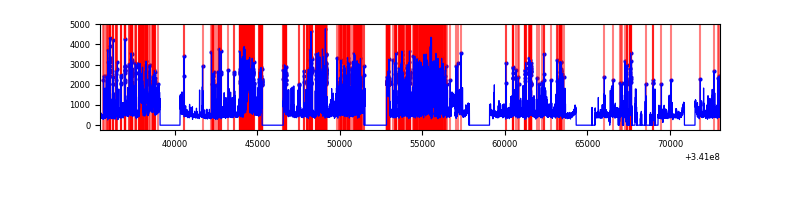 |
Top three noisy pixels from each quadrant. If the there are fewer than three noisy pixels in the level2.evt file, extra rows are filled as -1
| Pixel properties | Quadrant properties | ||||||
|---|---|---|---|---|---|---|---|
| Quadrant | DetID | PixID | Counts | Sigma | Mean | Median | Sigma |
| A | 12 | 96 | 98861 | 123.86 | 3878 | 3804 | 767.5 |
| A | 13 | 254 | 49678 | 59.77 | 3878 | 3804 | 767.5 |
| A | 12 | 189 | 36814 | 43.01 | 3878 | 3804 | 767.5 |
| B | 0 | 230 | 227462 | 315.71 | 3812 | 3727 | 708.7 |
| B | 15 | 32 | 133419 | 183.0 | 3812 | 3727 | 708.7 |
| B | 12 | 111 | 86732 | 117.13 | 3812 | 3727 | 708.7 |
| C | 14 | 238 | 593079 | 691.91 | 3681 | 3709 | 851.8 |
| C | 2 | 16 | 443411 | 516.2 | 3681 | 3709 | 851.8 |
| C | 13 | 61 | 25047 | 25.05 | 3681 | 3709 | 851.8 |
| D | 1 | 52 | 8580944 | 9975.06 | 3652 | 3565 | 859.9 |
| D | 2 | 250 | 727980 | 842.46 | 3652 | 3565 | 859.9 |
| D | 10 | 50 | 231270 | 264.81 | 3652 | 3565 | 859.9 |
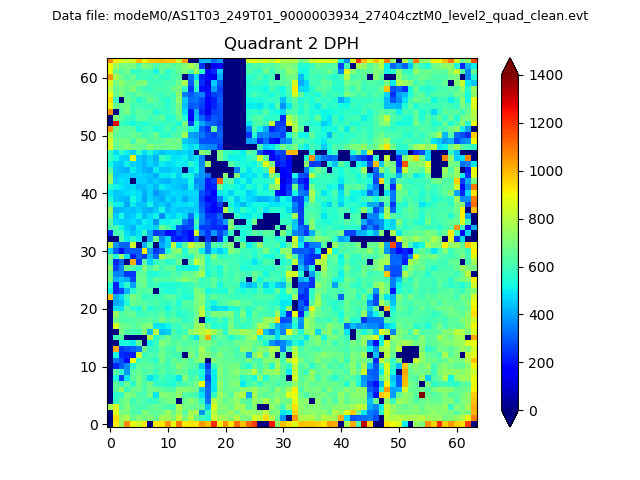
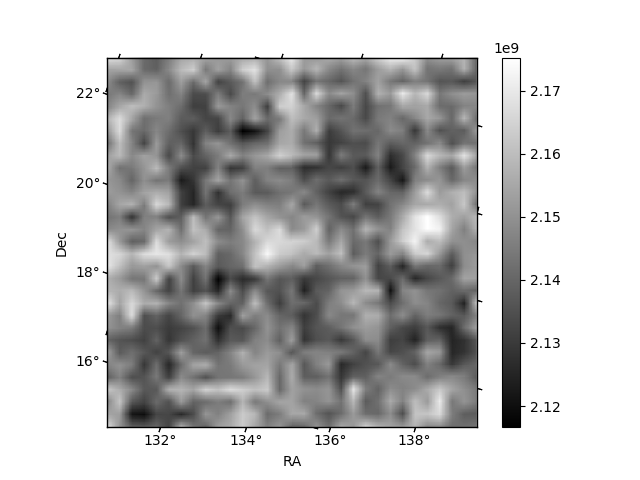
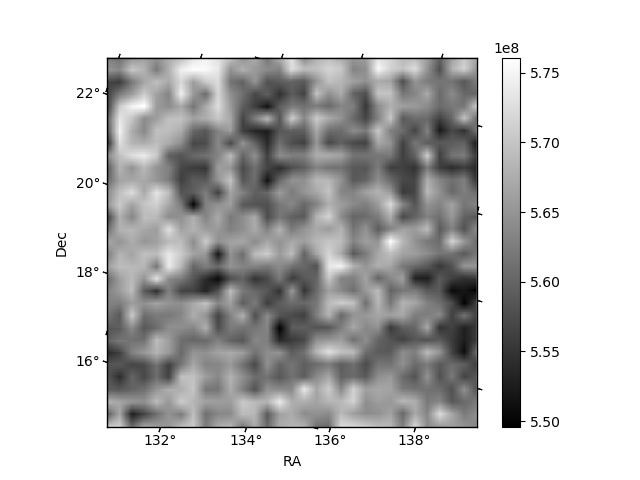
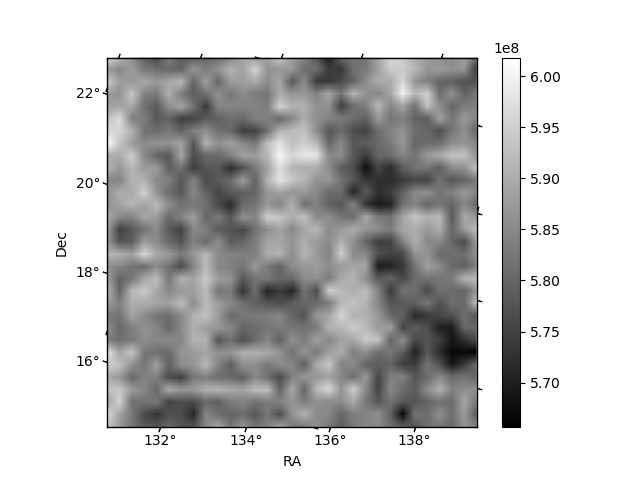
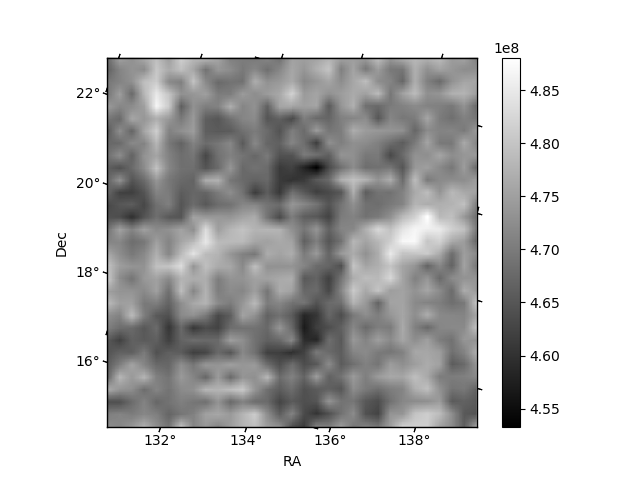
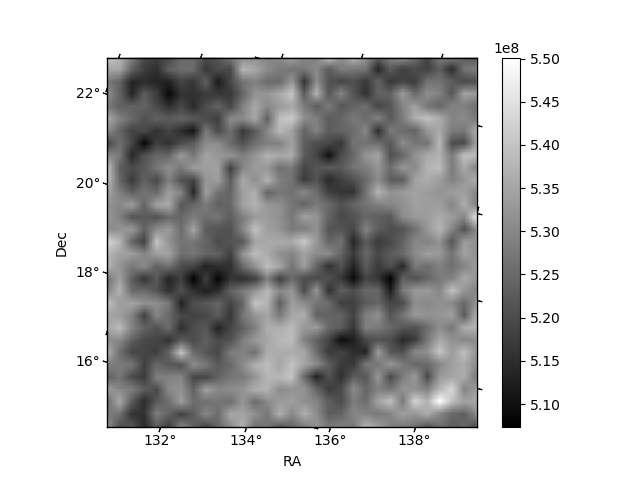
Histogram calculated using DETX and DETY for each event in the final _common_clean file
| Quadrant A | 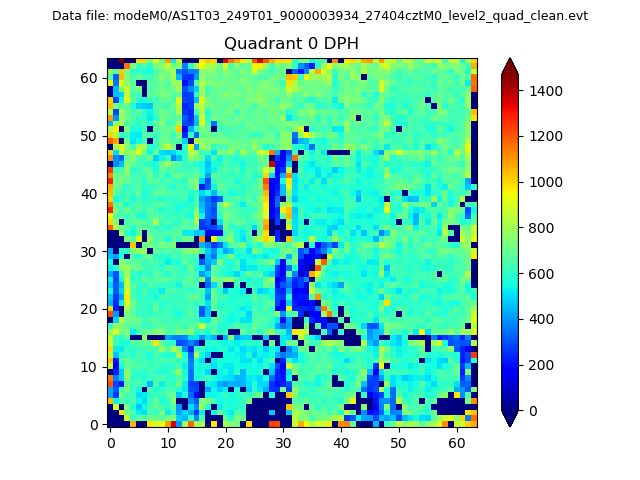 |
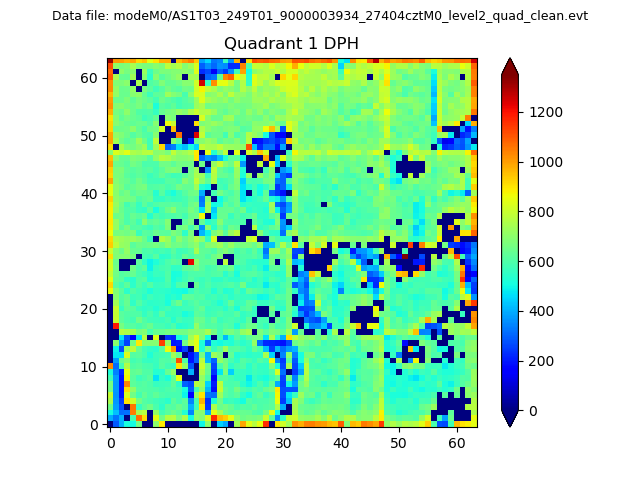 |
Quadrant B |
|---|---|---|---|
| Quadrant D | 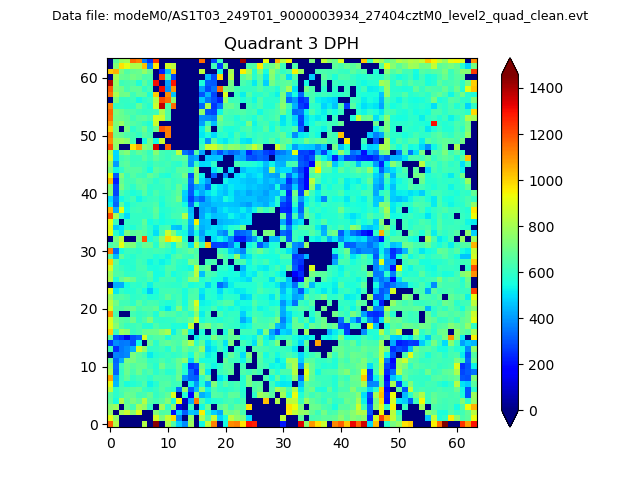 |
 |
Quadrant C |
| Plot type | Count rate plots | Images |
|---|---|---|
| Comparison with Poisson distribution Blue bars denote a histogram of data divided into 1 sec bins. Red curve is a Poisson curve with rate = median count rate of data. |
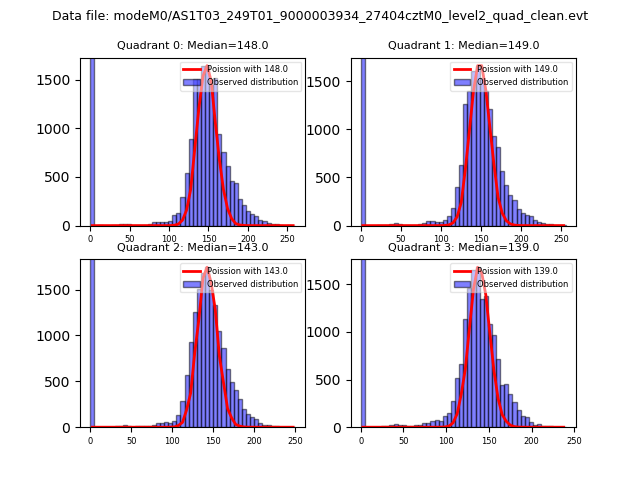 |
 |
| Quadrant-wise count rates Data is divided into 100 sec bins |
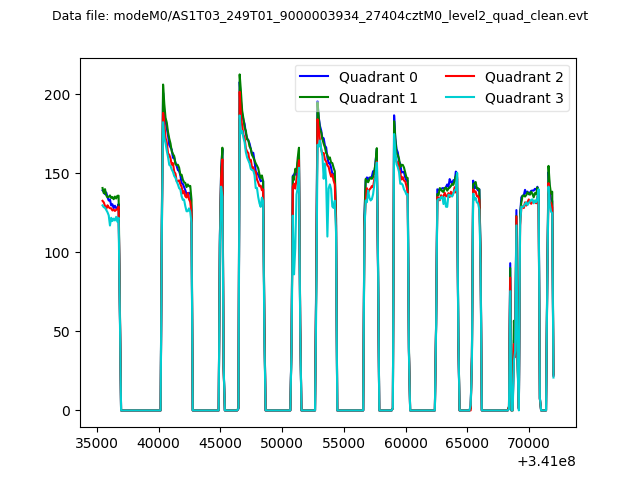 |
|
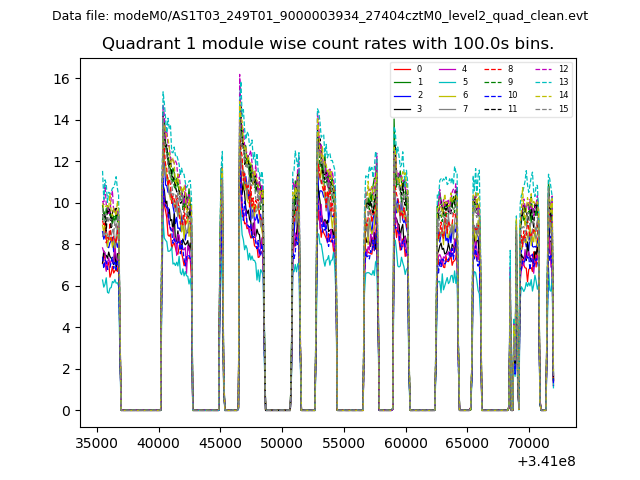
| Module-wise count rates for Quadrant A Data is divided into 100 sec bins |
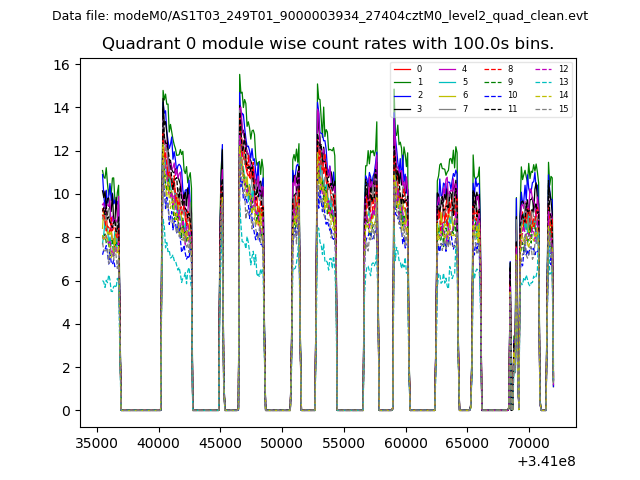 |
 |
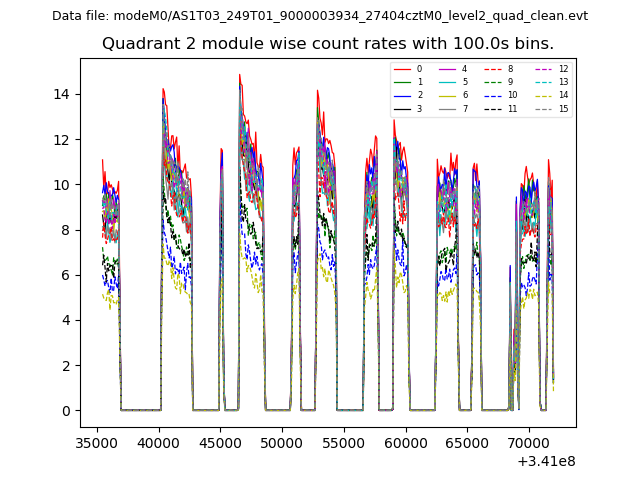
| Module-wise count rates for Quadrant B Data is divided into 100 sec bins |
 |
 |
| Module-wise count rates for Quadrant C Data is divided into 100 sec bins |
 |
 |
| Module-wise count rates for Quadrant D Data is divided into 100 sec bins |
 |
 |
| Parameter | Plot |
|---|---|
| CZT HV Monitor | 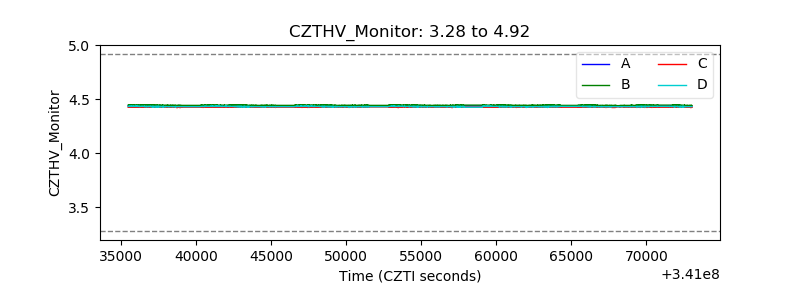 |
| D_VDD | 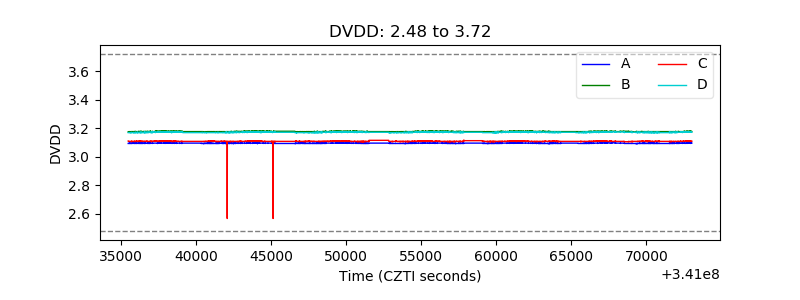 |
| Temperature 1 | 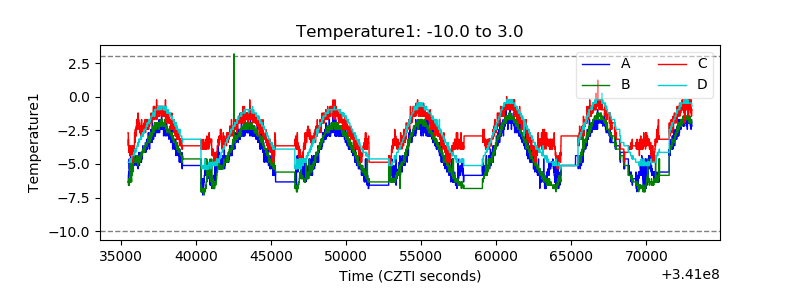 |
| Veto HV Monitor | 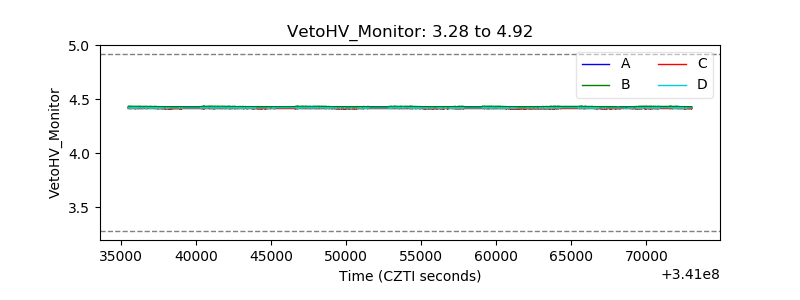 |
| Veto LLD | 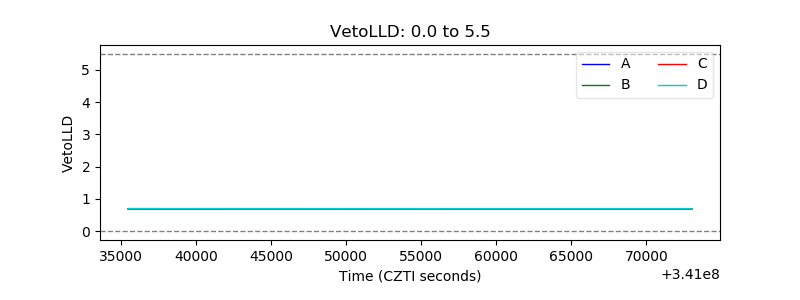 |
| Alpha Counter | 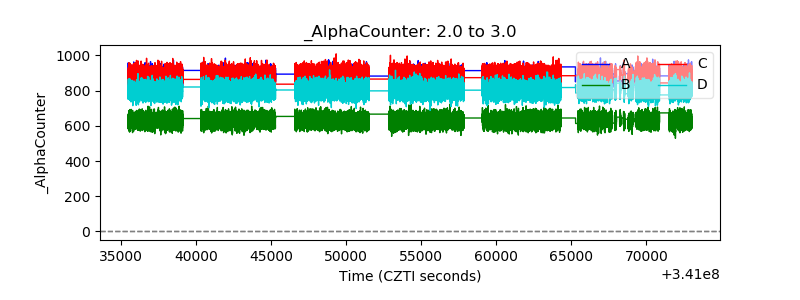 |
| _CPM_Rate | 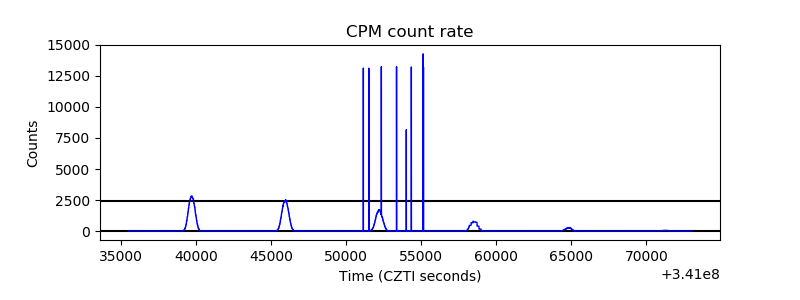 |
| CZT Counter | 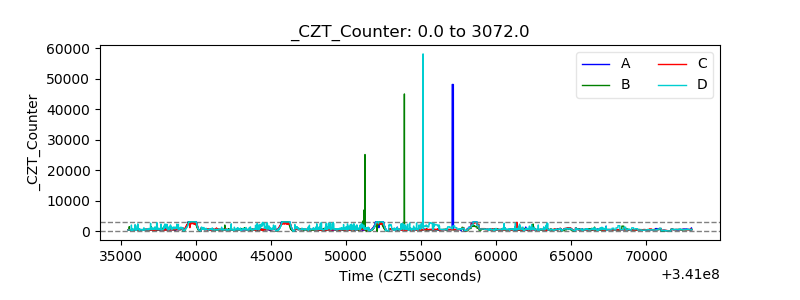 |
| +2.5 Volts monitor |  |
| +5 Volts monitor | 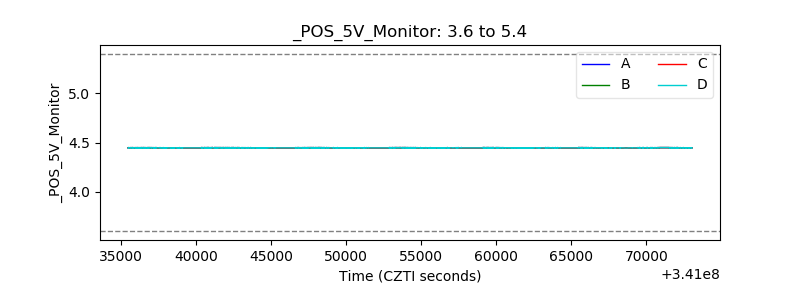 |
| _ROLL_ROT |  |
| _Roll_DEC | 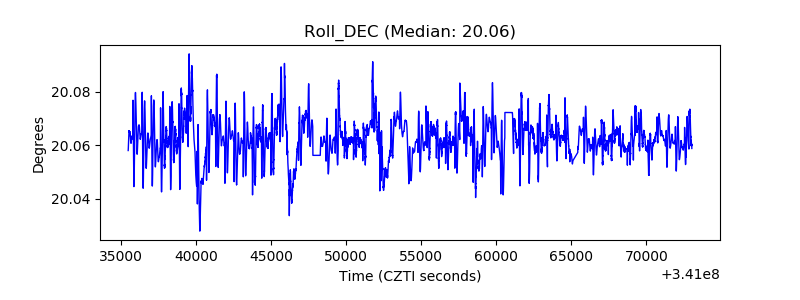 |
| _Roll_RA | 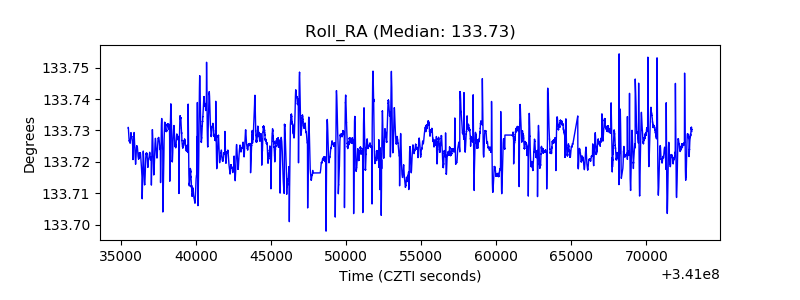 |
| Veto Counter | 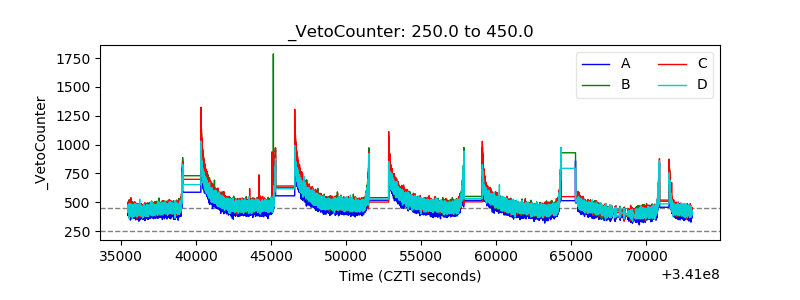 |