| Param | Original file | Final file |
|---|---|---|
| Filename | modeM0/AS1T03_249T01_9000003934_27405cztM0_level2.evt | modeM0/AS1T03_249T01_9000003934_27405cztM0_level2_quad_clean.evt |
| Size (bytes) | 523,823,040 | 80,988,480 |
| Size | 499.6 MB | 77.2 MB |
| Events in quadrant A | 3,630,549 | 496,409 |
| Events in quadrant B | 3,664,350 | 494,596 |
| Events in quadrant C | 3,640,483 | 474,398 |
| Events in quadrant D | 4,426,959 | 472,510 |
| Mode M0 | |||
|---|---|---|---|
| Quadrant | BADHDUFLAG | Total packets | Discarded packets |
| A | 0 | 15318 | 0 |
| B | 0 | 15404 | 0 |
| C | 0 | 15354 | 0 |
| D | 0 | 17953 | 0 |
| Mode M9 | |||
|---|---|---|---|
| Quadrant | BADHDUFLAG | Total packets | Discarded packets |
| A | 0 | 3 | 0 |
| B | 0 | 4 | 0 |
| C | 0 | 4 | 0 |
| D | 0 | 4 | 0 |
| Quadrant | Total seconds | Saturated seconds | Saturation percentage |
|---|---|---|---|
| A | 7383 | 63 | 0.853312% |
| B | 7383 | 107 | 1.449275% |
| C | 7383 | 150 | 2.031694% |
| D | 7383 | 118 | 1.598266% |
Noise dominated data is calculated using 1-second bins in cleaned event files. If a bin has >2000 counts, and if more than 50% of those come from <1% of pixels, then it is considered to be noise-dominated and hence unusable.
| Quadrant | # 1 sec bins | Bins with >0 counts | Bins with >2000 counts | High rate bins dominated by noise | Noise dominated (total time) | Noise dominated (detector-on time) | Marked lightcurve |
|---|---|---|---|---|---|---|---|
| A | 7763 | 7384 | 0 | 0 | 0.00% | 0.00% | 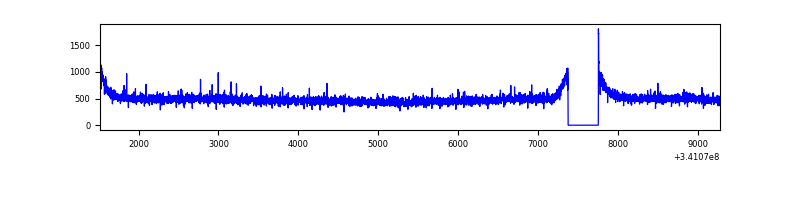 |
| B | 7763 | 7384 | 5 | 5 | 0.06% | 0.07% | 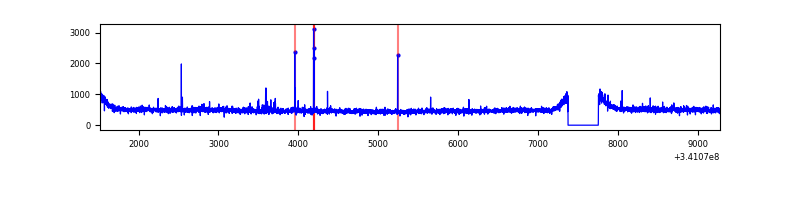 |
| C | 7763 | 7384 | 1 | 1 | 0.01% | 0.01% | 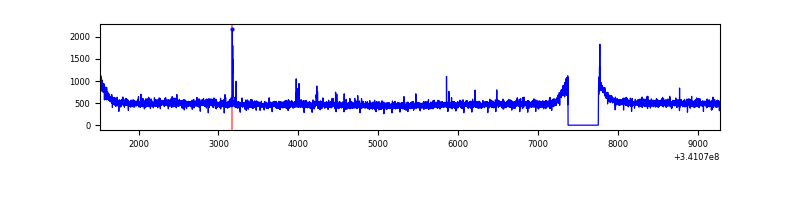 |
| D | 7763 | 7384 | 49 | 49 | 0.63% | 0.66% | 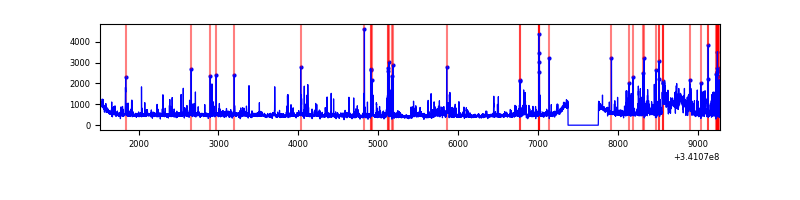 |
Top three noisy pixels from each quadrant. If the there are fewer than three noisy pixels in the level2.evt file, extra rows are filled as -1
| Pixel properties | Quadrant properties | ||||||
|---|---|---|---|---|---|---|---|
| Quadrant | DetID | PixID | Counts | Sigma | Mean | Median | Sigma |
| A | 13 | 254 | 13356 | 66.19 | 935 | 916 | 188.0 |
| A | 3 | 137 | 9048 | 43.27 | 935 | 916 | 188.0 |
| A | 0 | 226 | 7980 | 37.58 | 935 | 916 | 188.0 |
| B | 12 | 111 | 22176 | 119.64 | 920 | 895 | 177.9 |
| B | 11 | 111 | 19879 | 106.73 | 920 | 895 | 177.9 |
| B | 14 | 111 | 17328 | 92.38 | 920 | 895 | 177.9 |
| C | 14 | 238 | 140341 | 657.62 | 891 | 894 | 212.0 |
| C | 2 | 16 | 29401 | 134.44 | 891 | 894 | 212.0 |
| C | 13 | 61 | 6126 | 24.67 | 891 | 894 | 212.0 |
| D | 1 | 52 | 803875 | 3697.41 | 906 | 882 | 217.2 |
| D | 2 | 250 | 131009 | 599.17 | 906 | 882 | 217.2 |
| D | 2 | 234 | 32266 | 144.51 | 906 | 882 | 217.2 |
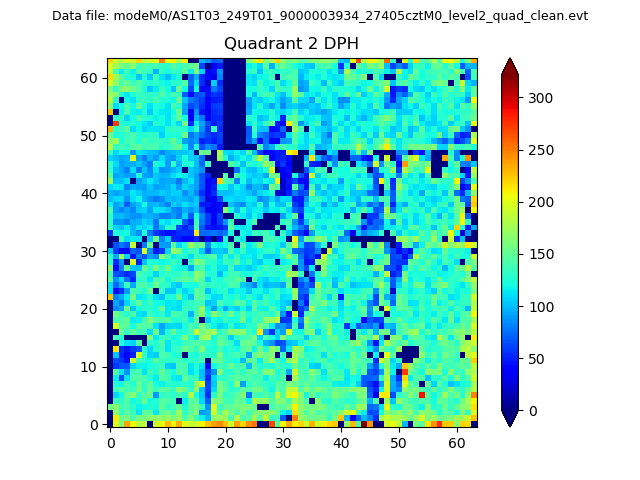
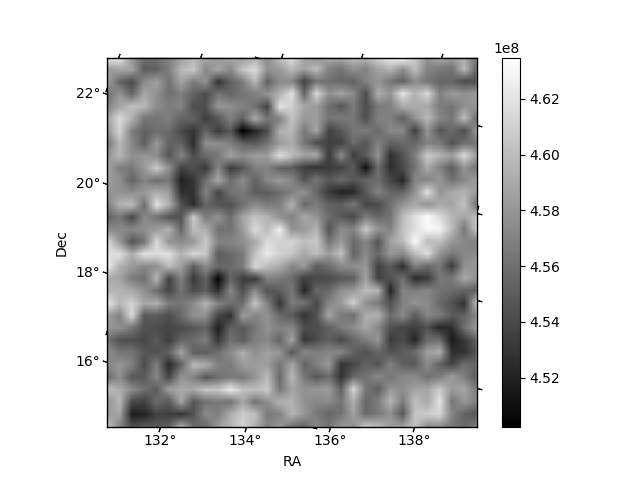
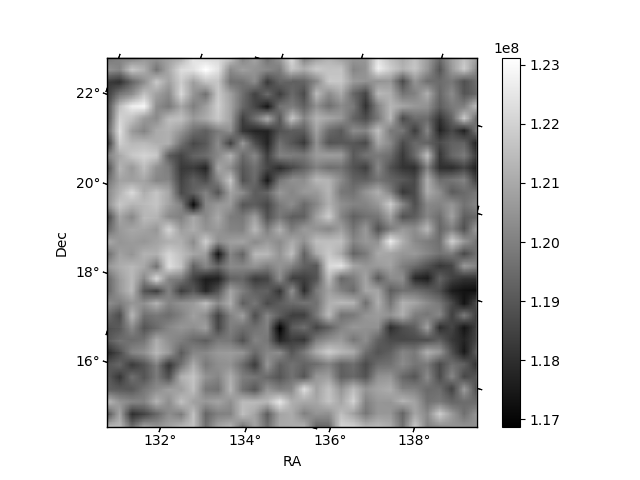
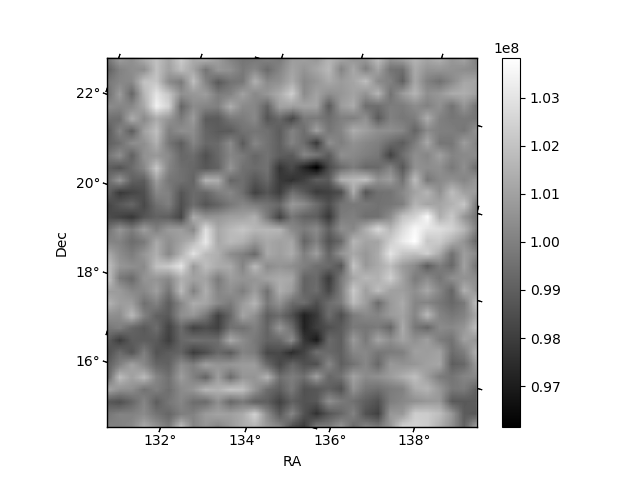
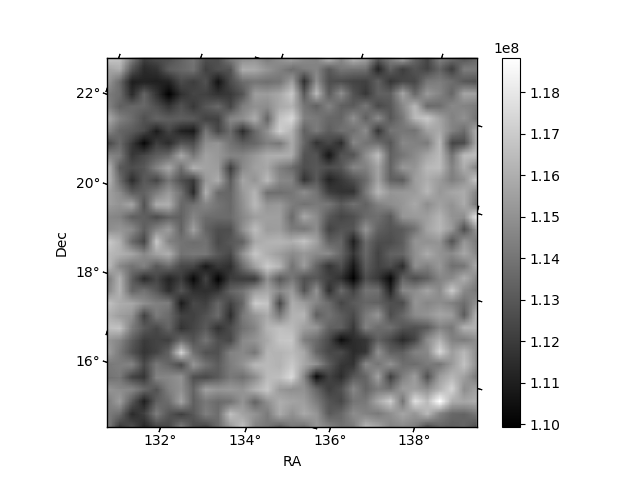
Histogram calculated using DETX and DETY for each event in the final _common_clean file
| Quadrant A | 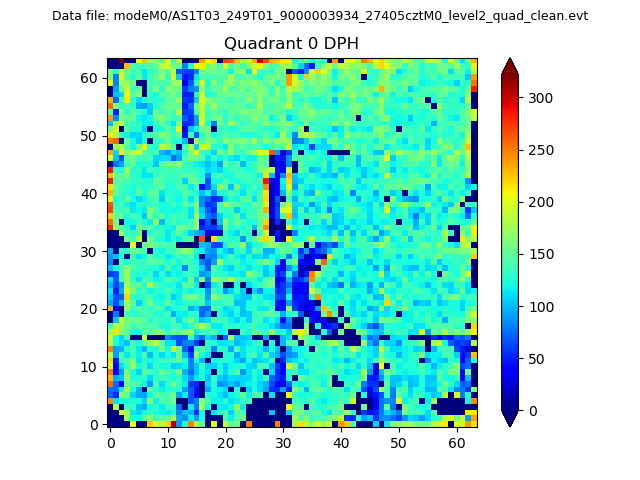 |
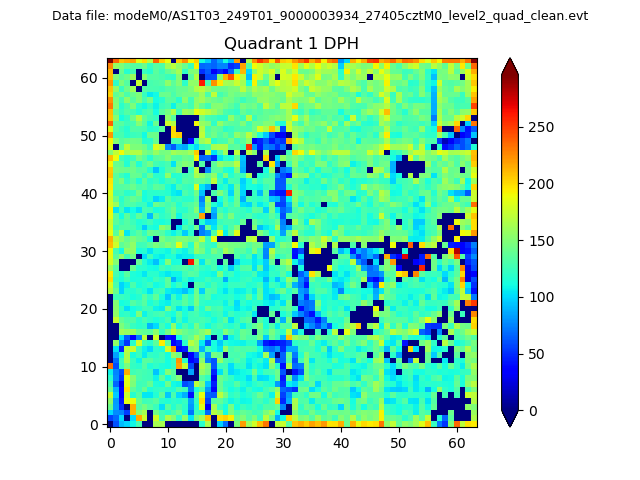 |
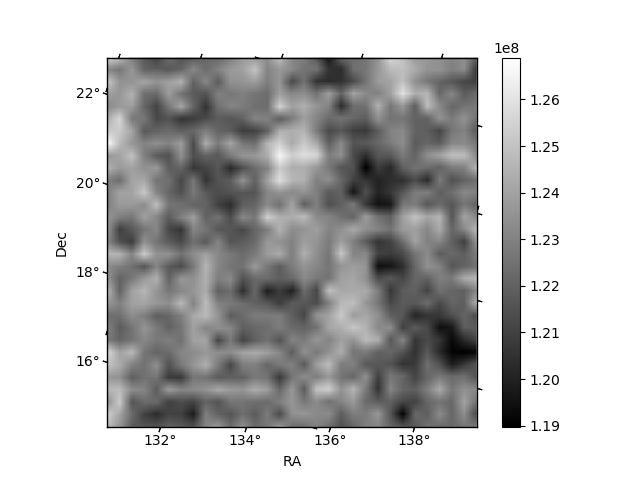
Quadrant B |
|---|---|---|---|
| Quadrant D | 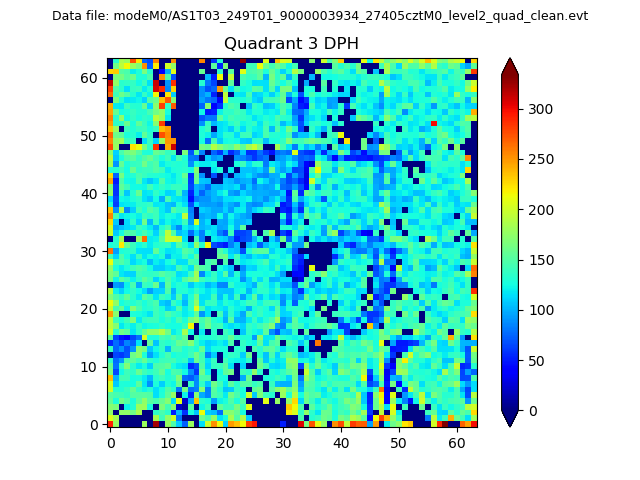 |
 |
Quadrant C |
| Plot type | Count rate plots | Images |
|---|---|---|
| Comparison with Poisson distribution Blue bars denote a histogram of data divided into 1 sec bins. Red curve is a Poisson curve with rate = median count rate of data. |
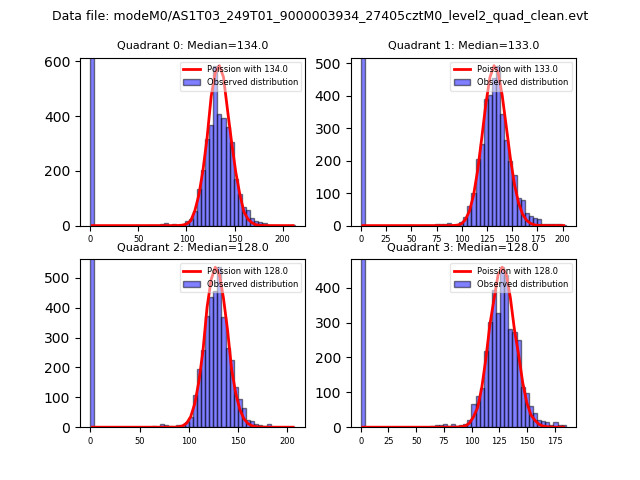 |
 |
| Quadrant-wise count rates Data is divided into 100 sec bins |
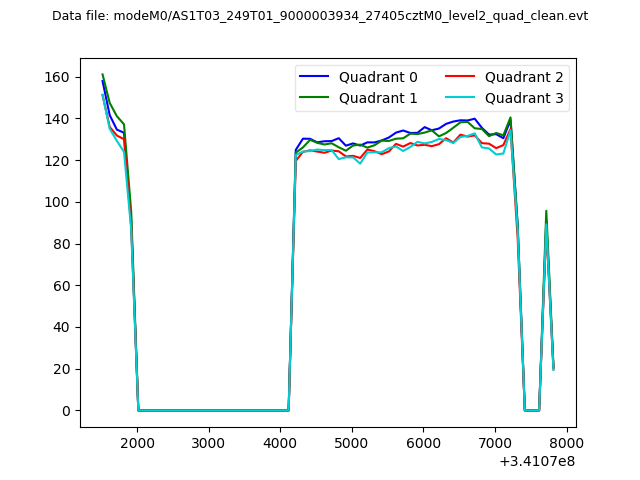 |
|
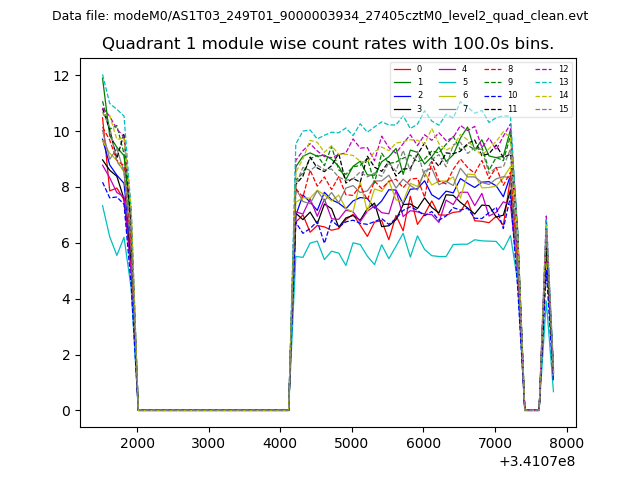
| Module-wise count rates for Quadrant A Data is divided into 100 sec bins |
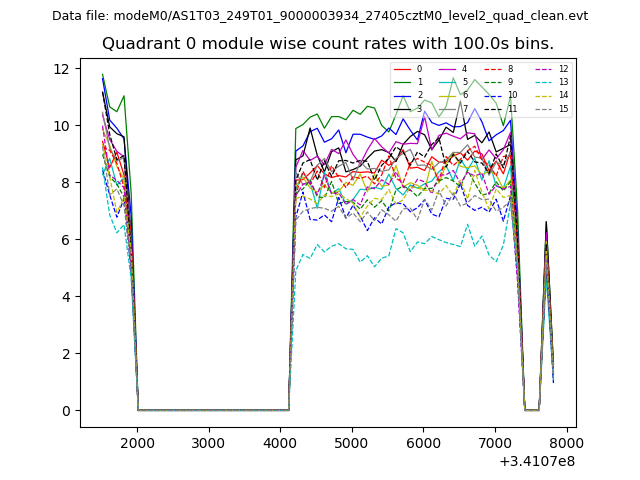 |
 |
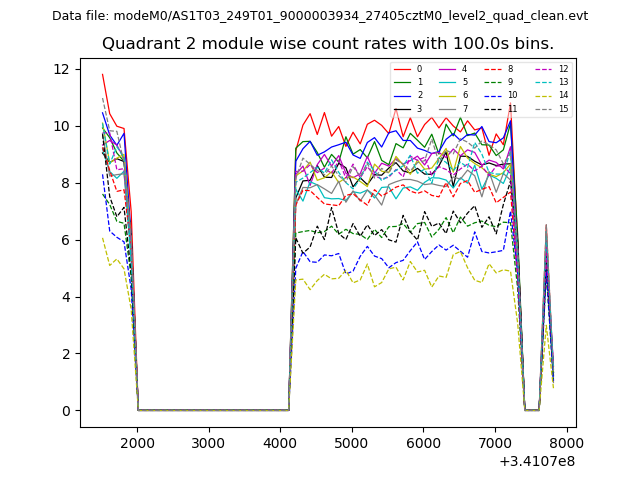
| Module-wise count rates for Quadrant B Data is divided into 100 sec bins |
 |
 |
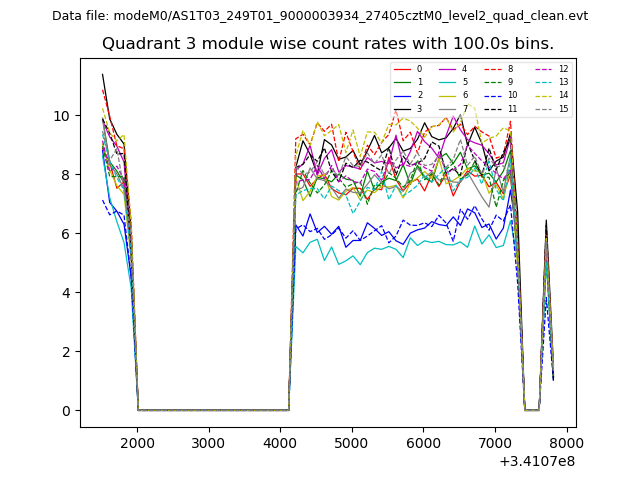
| Module-wise count rates for Quadrant C Data is divided into 100 sec bins |
 |
 |
| Module-wise count rates for Quadrant D Data is divided into 100 sec bins |
 |
 |
| Parameter | Plot |
|---|---|
| CZT HV Monitor | 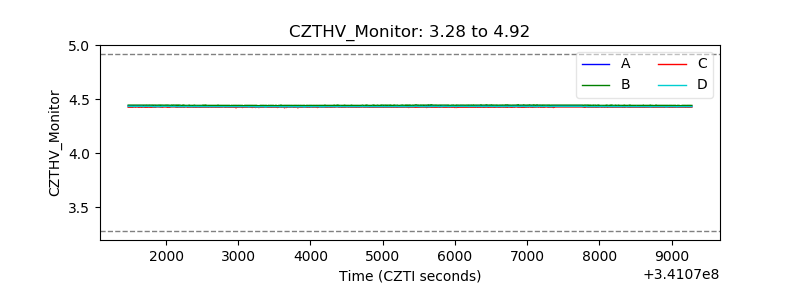 |
| D_VDD | 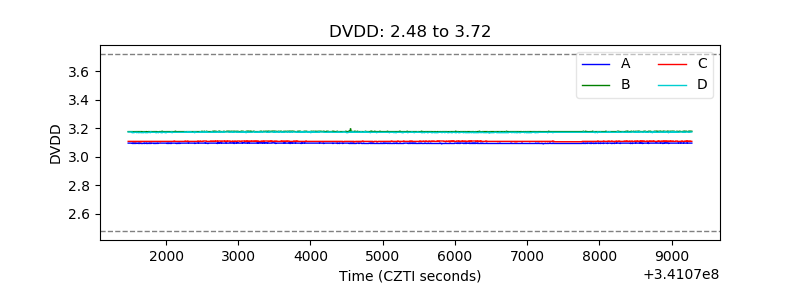 |
| Temperature 1 | 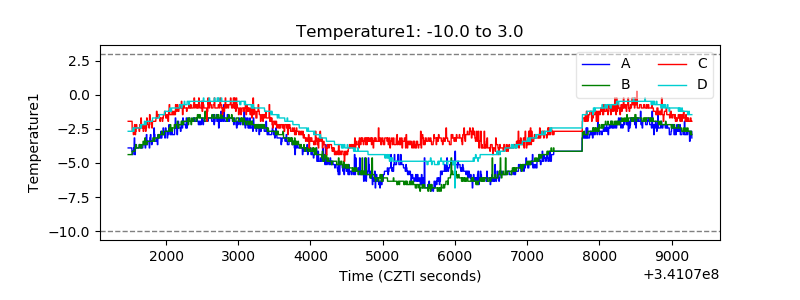 |
| Veto HV Monitor | 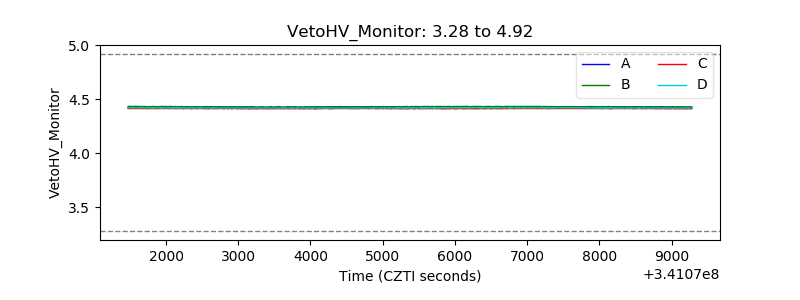 |
| Veto LLD | 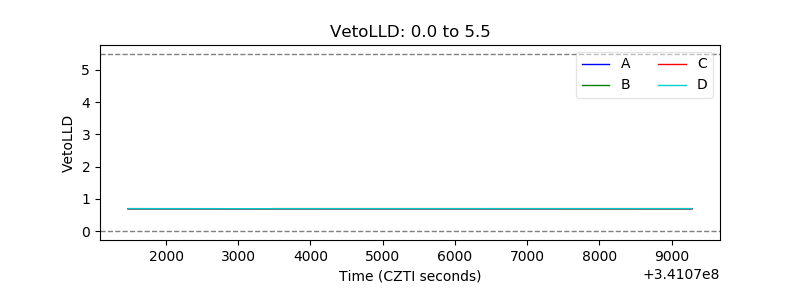 |
| Alpha Counter | 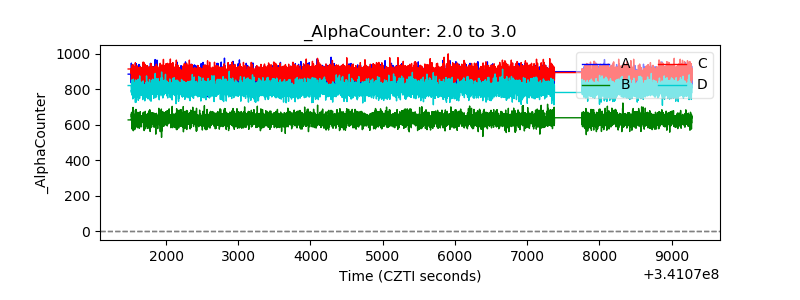 |
| _CPM_Rate | 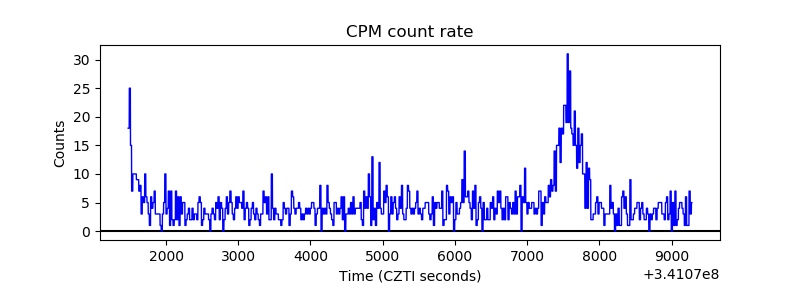 |
| CZT Counter | 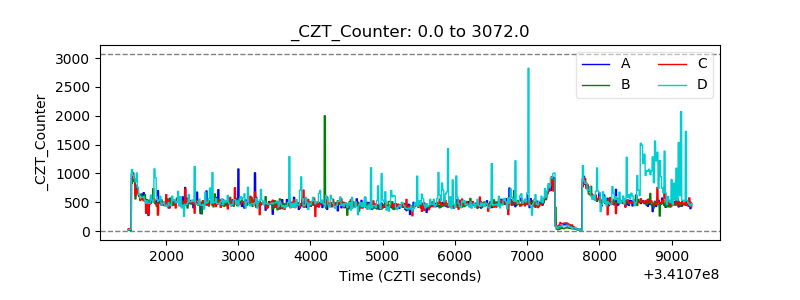 |
| +2.5 Volts monitor | 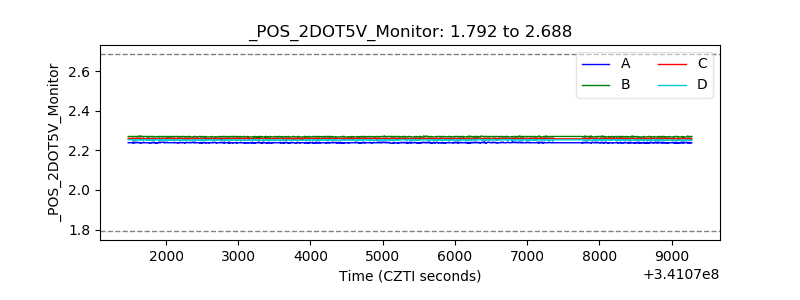 |
| +5 Volts monitor |  |
| _ROLL_ROT | 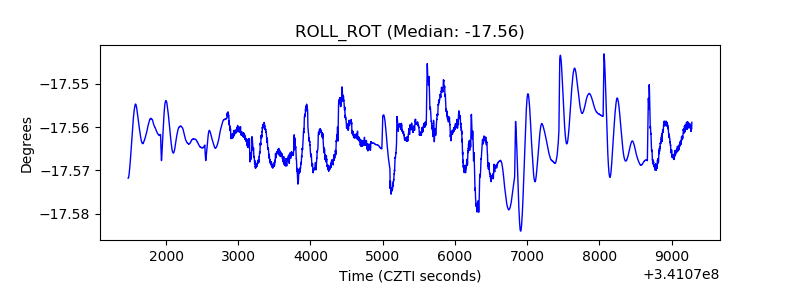 |
| _Roll_DEC | 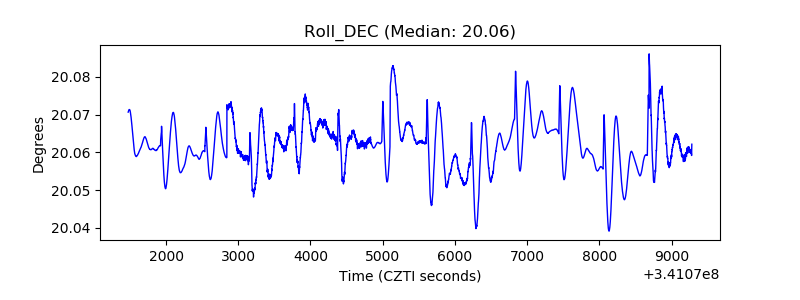 |
| _Roll_RA | 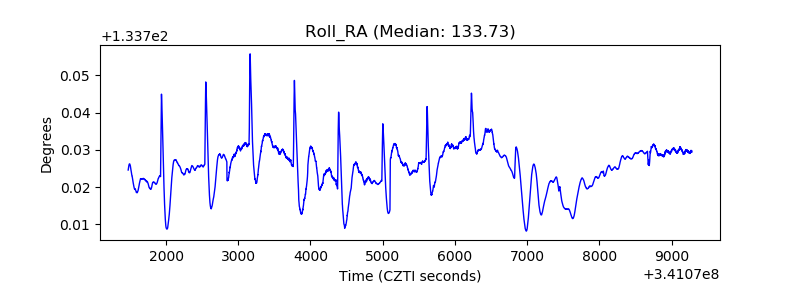 |
| Veto Counter | 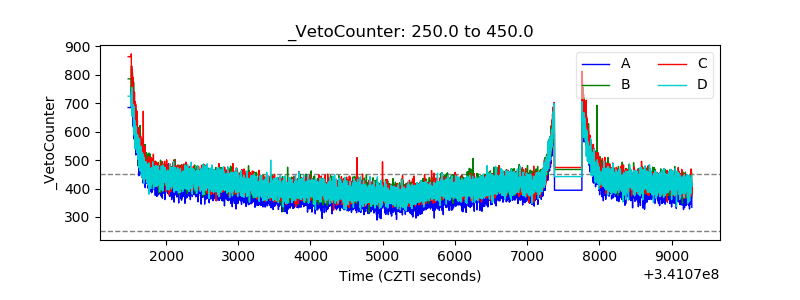 |