| Param | Original file | Final file |
|---|---|---|
| Filename | modeM0/AS1T03_249T01_9000003934_27406cztM0_level2.evt | modeM0/AS1T03_249T01_9000003934_27406cztM0_level2_quad_clean.evt |
| Size (bytes) | 533,531,520 | 77,232,960 |
| Size | 508.8 MB | 73.7 MB |
| Events in quadrant A | 3,525,359 | 468,597 |
| Events in quadrant B | 3,596,673 | 465,795 |
| Events in quadrant C | 3,601,243 | 448,363 |
| Events in quadrant D | 4,938,351 | 446,599 |
| Mode M0 | |||
|---|---|---|---|
| Quadrant | BADHDUFLAG | Total packets | Discarded packets |
| A | 0 | 15037 | 0 |
| B | 0 | 15157 | 0 |
| C | 0 | 15273 | 0 |
| D | 0 | 19422 | 0 |
| Mode M9 | |||
|---|---|---|---|
| Quadrant | BADHDUFLAG | Total packets | Discarded packets |
| A | 0 | 3 | 0 |
| B | 0 | 3 | 0 |
| C | 0 | 3 | 0 |
| D | 0 | 3 | 0 |
| Quadrant | Total seconds | Saturated seconds | Saturation percentage |
|---|---|---|---|
| A | 7308 | 66 | 0.903120% |
| B | 7309 | 101 | 1.381858% |
| C | 7308 | 149 | 2.038862% |
| D | 7309 | 326 | 4.460254% |
Noise dominated data is calculated using 1-second bins in cleaned event files. If a bin has >2000 counts, and if more than 50% of those come from <1% of pixels, then it is considered to be noise-dominated and hence unusable.
| Quadrant | # 1 sec bins | Bins with >0 counts | Bins with >2000 counts | High rate bins dominated by noise | Noise dominated (total time) | Noise dominated (detector-on time) | Marked lightcurve |
|---|---|---|---|---|---|---|---|
| A | 7623 | 7309 | 0 | 0 | 0.00% | 0.00% | 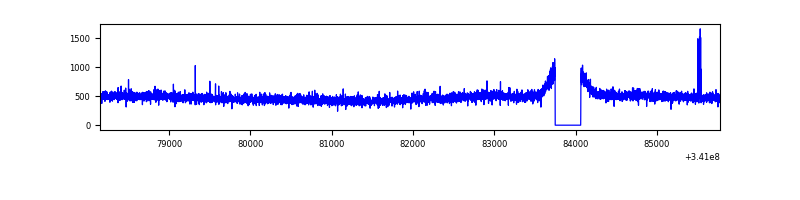 |
| B | 7624 | 7310 | 3 | 3 | 0.04% | 0.04% | 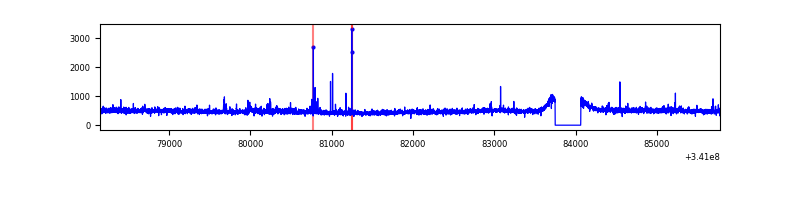 |
| C | 7624 | 7310 | 11 | 11 | 0.14% | 0.15% | 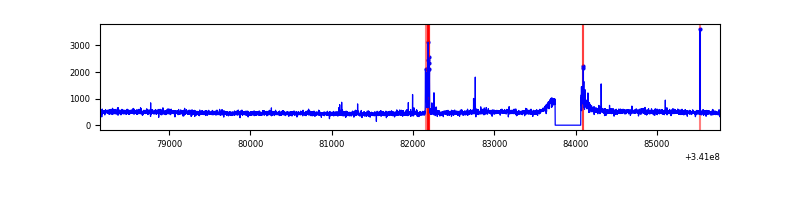 |
| D | 7624 | 7310 | 255 | 255 | 3.34% | 3.49% | 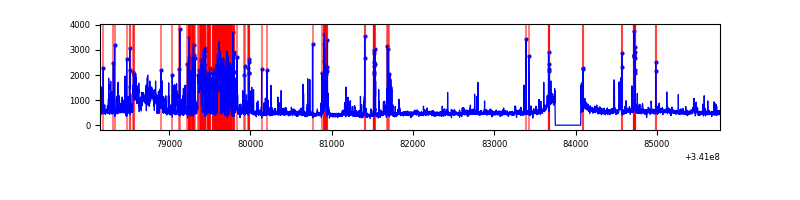 |
Top three noisy pixels from each quadrant. If the there are fewer than three noisy pixels in the level2.evt file, extra rows are filled as -1
| Pixel properties | Quadrant properties | ||||||
|---|---|---|---|---|---|---|---|
| Quadrant | DetID | PixID | Counts | Sigma | Mean | Median | Sigma |
| A | 13 | 254 | 13429 | 68.68 | 907 | 887 | 182.6 |
| A | 13 | 248 | 11320 | 57.13 | 907 | 887 | 182.6 |
| A | 3 | 137 | 8632 | 42.41 | 907 | 887 | 182.6 |
| B | 4 | 206 | 27221 | 152.64 | 893 | 871 | 172.6 |
| B | 15 | 33 | 27081 | 151.83 | 893 | 871 | 172.6 |
| B | 12 | 111 | 21348 | 118.62 | 893 | 871 | 172.6 |
| C | 14 | 238 | 135144 | 661.2 | 861 | 865 | 203.1 |
| C | 2 | 16 | 109695 | 535.89 | 861 | 865 | 203.1 |
| C | 13 | 61 | 5900 | 24.79 | 861 | 865 | 203.1 |
| D | 1 | 52 | 1343034 | 6471.14 | 870 | 846 | 207.4 |
| D | 2 | 250 | 250825 | 1205.23 | 870 | 846 | 207.4 |
| D | 2 | 234 | 33095 | 155.48 | 870 | 846 | 207.4 |
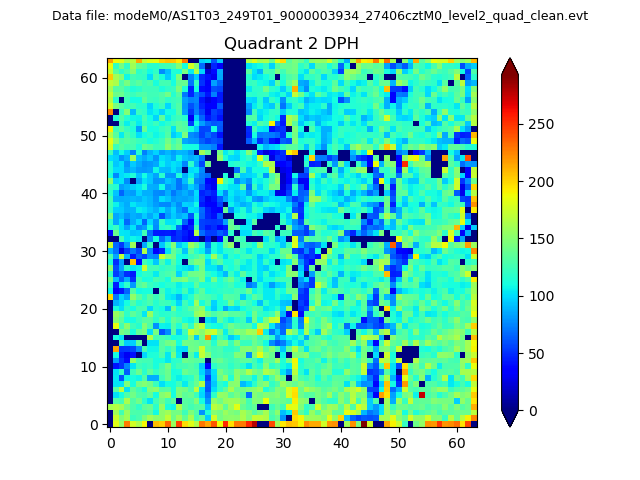
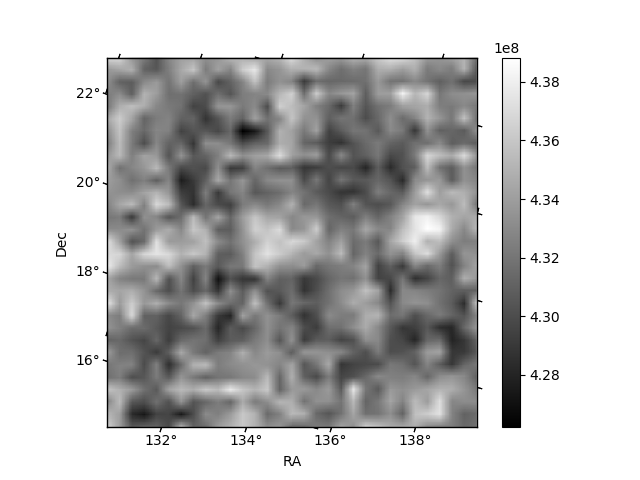
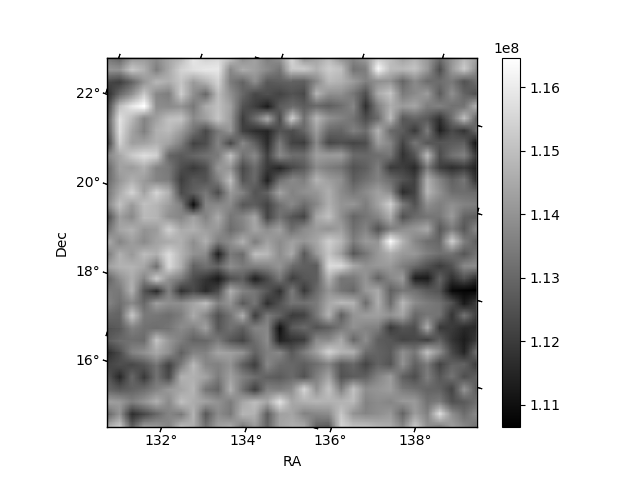
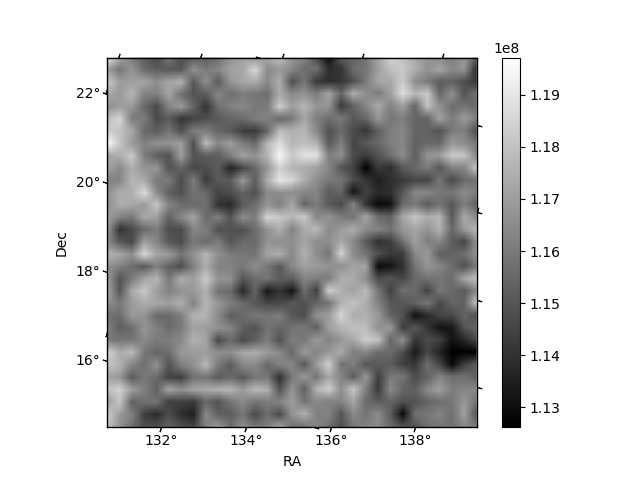
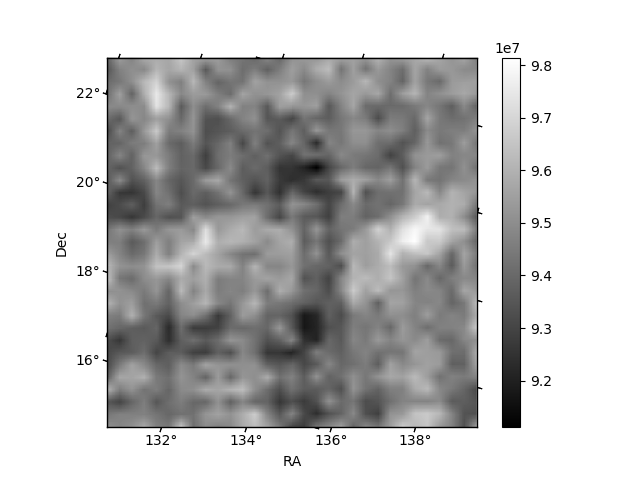
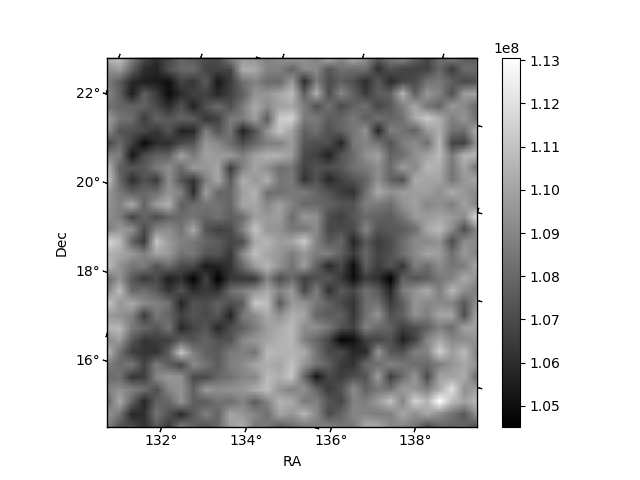
Histogram calculated using DETX and DETY for each event in the final _common_clean file
| Quadrant A | 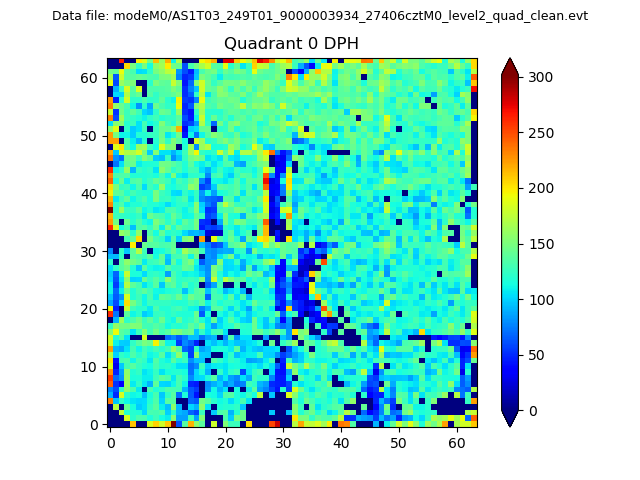 |
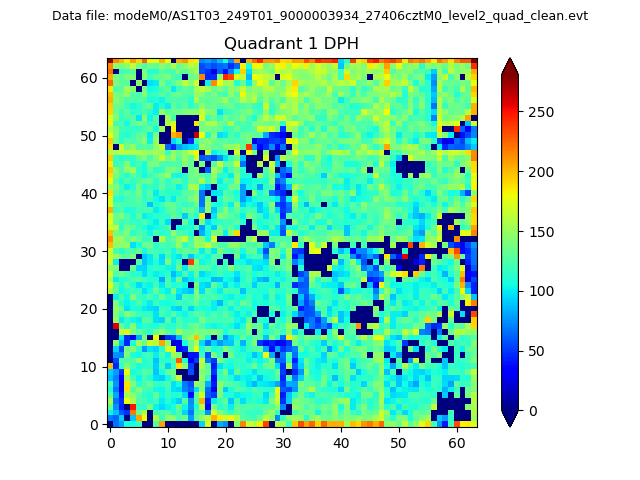 |
Quadrant B |
|---|---|---|---|
| Quadrant D | 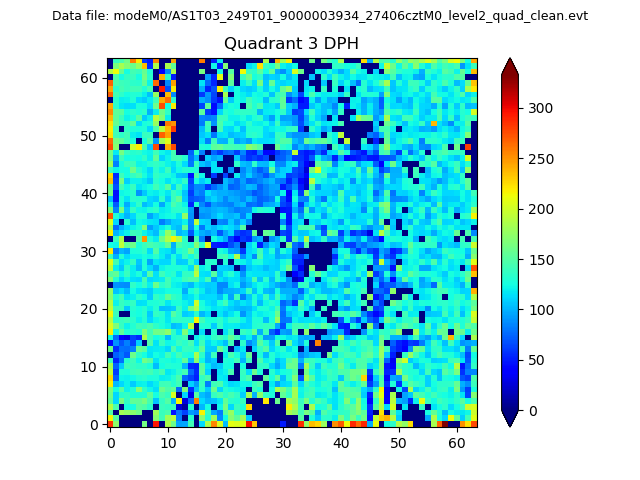 |
 |
Quadrant C |
| Plot type | Count rate plots | Images |
|---|---|---|
| Comparison with Poisson distribution Blue bars denote a histogram of data divided into 1 sec bins. Red curve is a Poisson curve with rate = median count rate of data. |
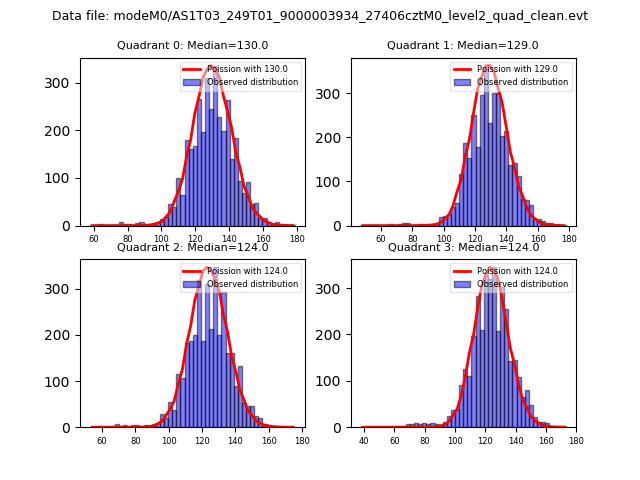 |
 |
| Quadrant-wise count rates Data is divided into 100 sec bins |
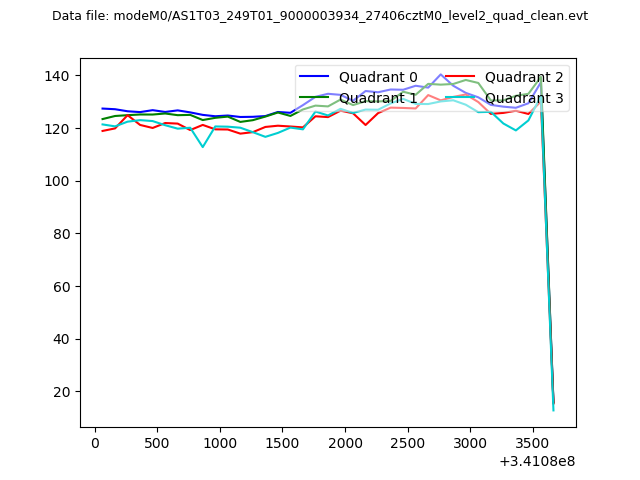 |
|
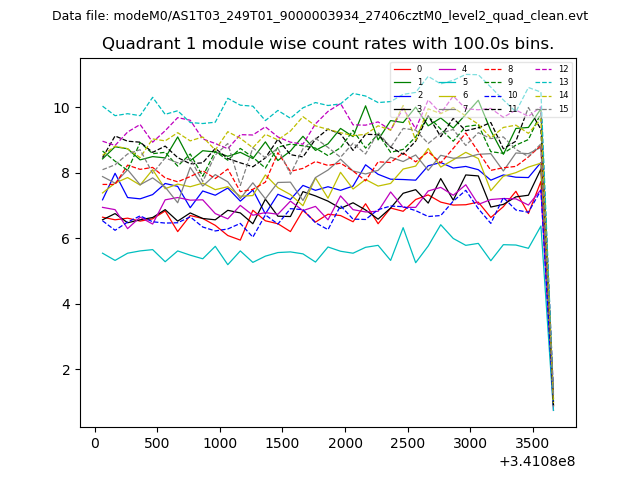
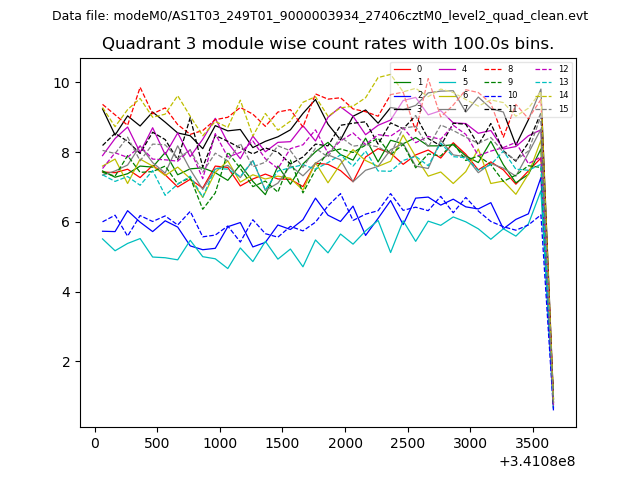
| Module-wise count rates for Quadrant A Data is divided into 100 sec bins |
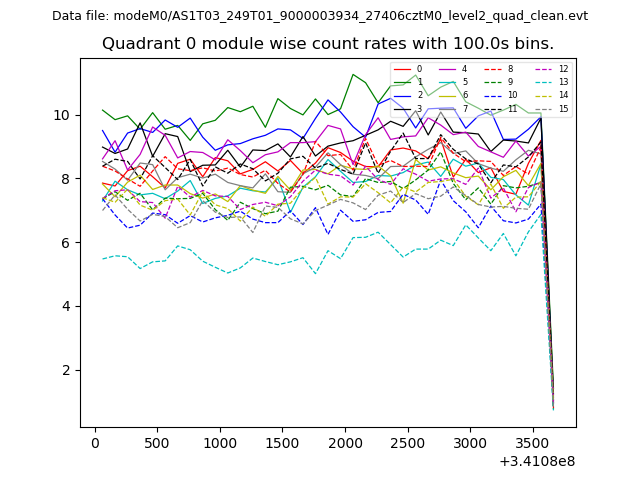 |
 |
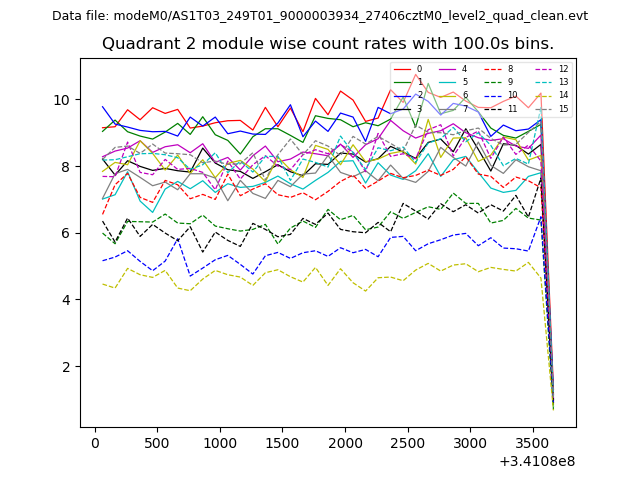
| Module-wise count rates for Quadrant B Data is divided into 100 sec bins |
 |
 |
| Module-wise count rates for Quadrant C Data is divided into 100 sec bins |
 |
 |
| Module-wise count rates for Quadrant D Data is divided into 100 sec bins |
 |
 |
| Parameter | Plot |
|---|---|
| CZT HV Monitor | 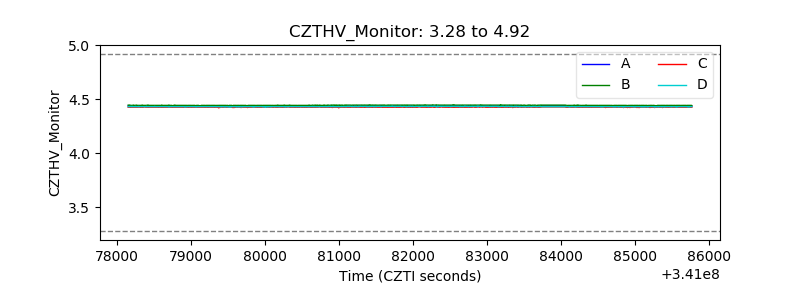 |
| D_VDD | 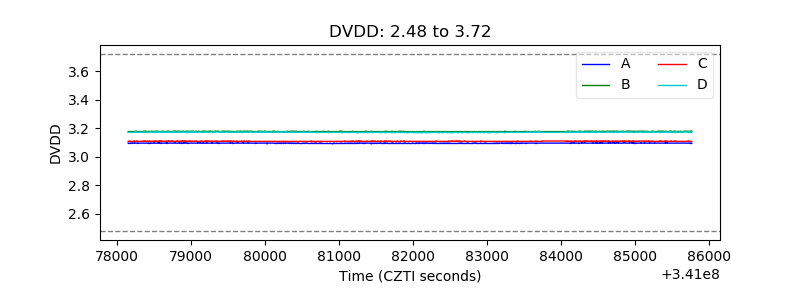 |
| Temperature 1 | 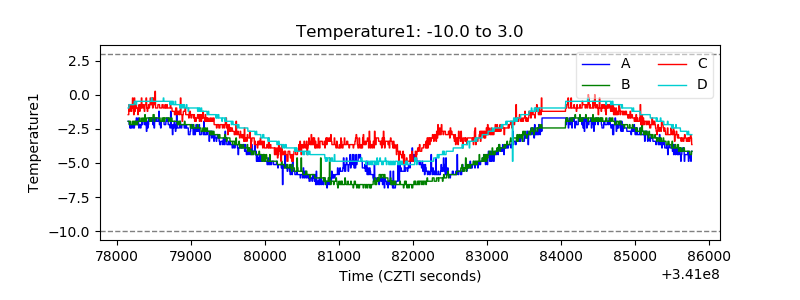 |
| Veto HV Monitor | 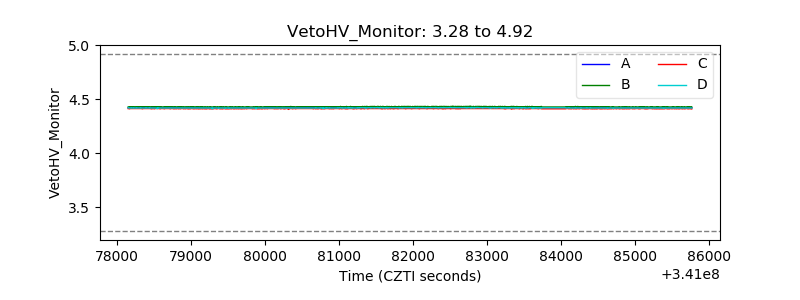 |
| Veto LLD | 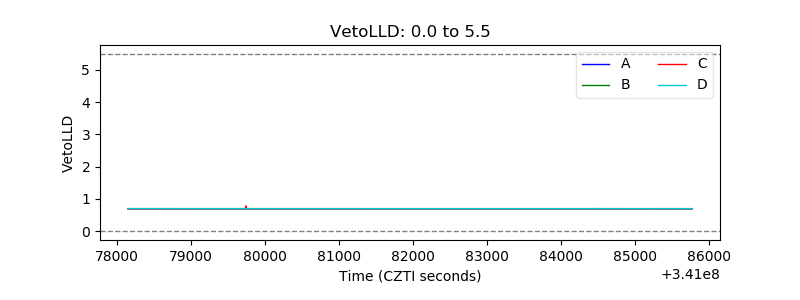 |
| Alpha Counter | 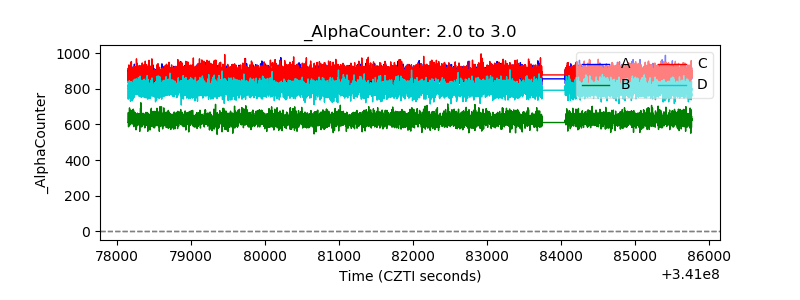 |
| _CPM_Rate | 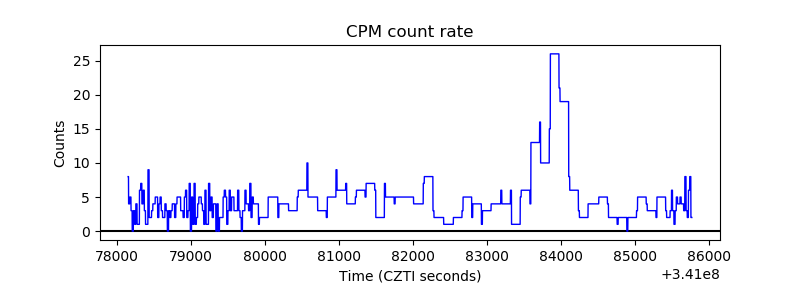 |
| CZT Counter | 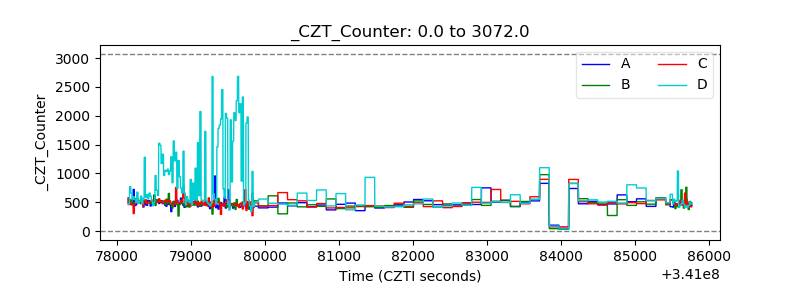 |
| +2.5 Volts monitor | 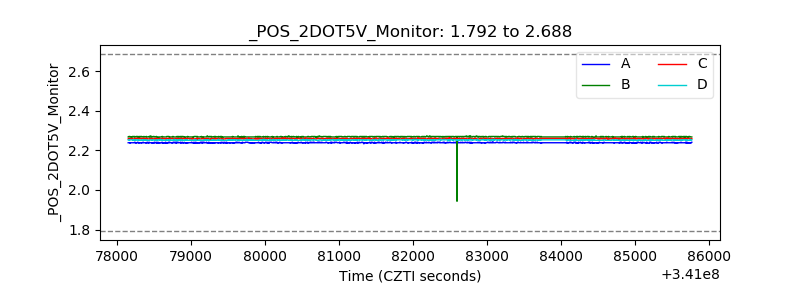 |
| +5 Volts monitor |  |
| _ROLL_ROT | 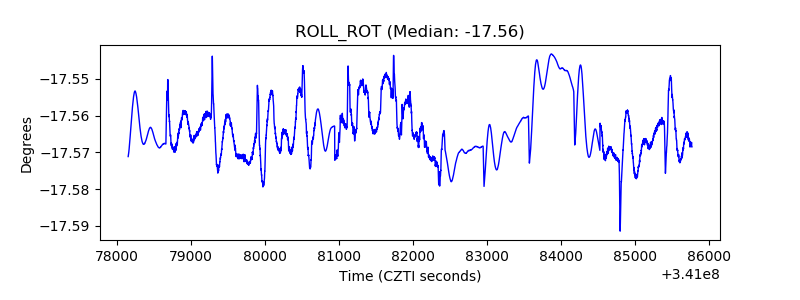 |
| _Roll_DEC | 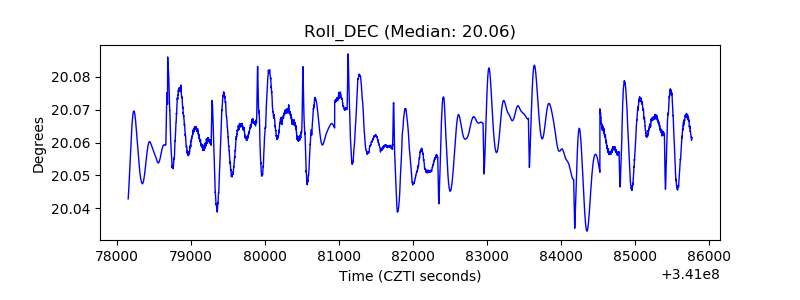 |
| _Roll_RA | 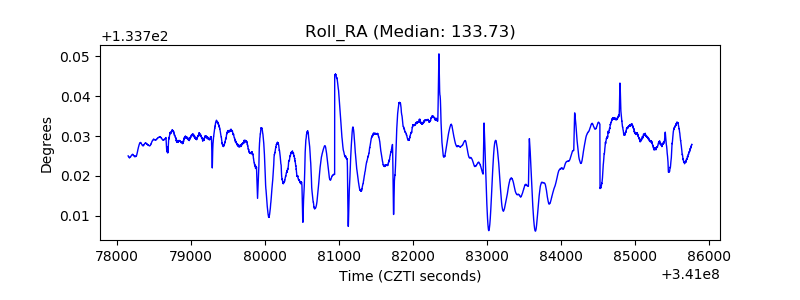 |
| Veto Counter | 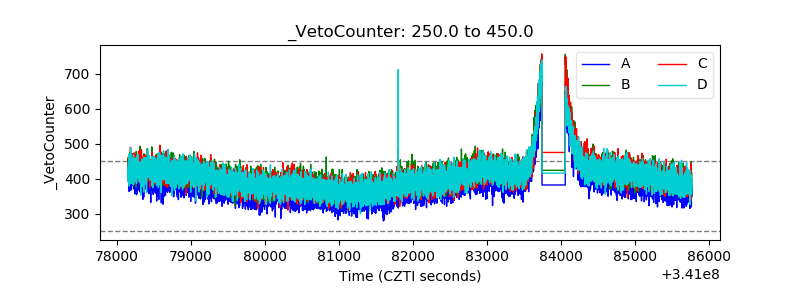 |