| Param | Original file | Final file |
|---|---|---|
| Filename | modeM0/AS1T03_249T01_9000003934_27410cztM0_level2.evt | modeM0/AS1T03_249T01_9000003934_27410cztM0_level2_quad_clean.evt |
| Size (bytes) | 729,774,720 | 142,430,400 |
| Size | 696.0 MB | 135.8 MB |
| Events in quadrant A | 5,010,109 | 915,359 |
| Events in quadrant B | 5,086,475 | 912,681 |
| Events in quadrant C | 5,453,813 | 873,602 |
| Events in quadrant D | 5,829,684 | 875,179 |
| Mode M0 | |||
|---|---|---|---|
| Quadrant | BADHDUFLAG | Total packets | Discarded packets |
| A | 0 | 21804 | 0 |
| B | 0 | 22022 | 0 |
| C | 0 | 22968 | 0 |
| D | 0 | 24322 | 0 |
| Mode M9 | |||
|---|---|---|---|
| Quadrant | BADHDUFLAG | Total packets | Discarded packets |
| A | 0 | 11 | 0 |
| B | 0 | 11 | 0 |
| C | 0 | 11 | 0 |
| D | 0 | 11 | 0 |
| Quadrant | Total seconds | Saturated seconds | Saturation percentage |
|---|---|---|---|
| A | 10637 | 104 | 0.977719% |
| B | 10638 | 124 | 1.165633% |
| C | 10638 | 247 | 2.321865% |
| D | 10638 | 197 | 1.851852% |
Noise dominated data is calculated using 1-second bins in cleaned event files. If a bin has >2000 counts, and if more than 50% of those come from <1% of pixels, then it is considered to be noise-dominated and hence unusable.
| Quadrant | # 1 sec bins | Bins with >0 counts | Bins with >2000 counts | High rate bins dominated by noise | Noise dominated (total time) | Noise dominated (detector-on time) | Marked lightcurve |
|---|---|---|---|---|---|---|---|
| A | 11717 | 10638 | 3 | 3 | 0.03% | 0.03% | 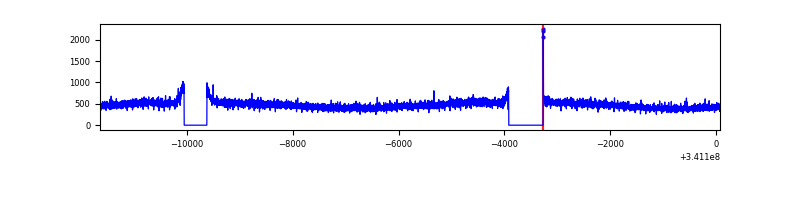 |
| B | 11718 | 10639 | 4 | 4 | 0.03% | 0.04% | 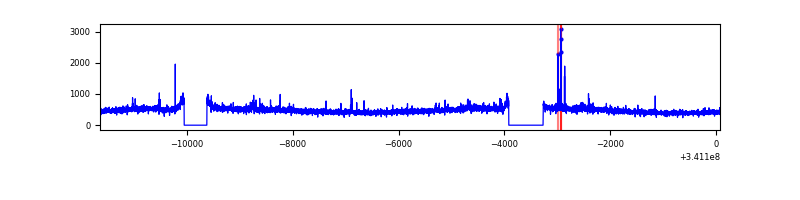 |
| C | 11718 | 10639 | 62 | 62 | 0.53% | 0.58% | 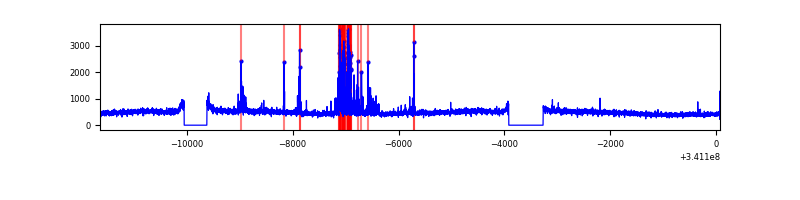 |
| D | 11718 | 10639 | 92 | 92 | 0.79% | 0.86% | 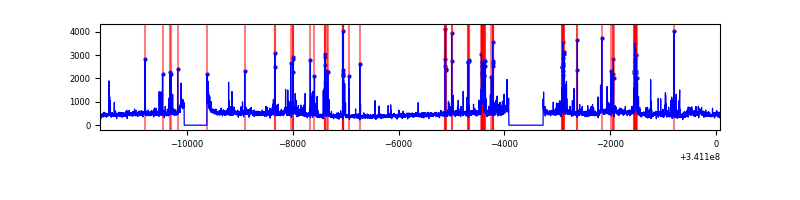 |
Top three noisy pixels from each quadrant. If the there are fewer than three noisy pixels in the level2.evt file, extra rows are filled as -1
| Pixel properties | Quadrant properties | ||||||
|---|---|---|---|---|---|---|---|
| Quadrant | DetID | PixID | Counts | Sigma | Mean | Median | Sigma |
| A | 13 | 254 | 18707 | 66.99 | 1292 | 1265 | 260.4 |
| A | 10 | 67 | 13352 | 46.43 | 1292 | 1265 | 260.4 |
| A | 3 | 137 | 12434 | 42.9 | 1292 | 1265 | 260.4 |
| B | 4 | 52 | 33897 | 132.84 | 1276 | 1241 | 245.8 |
| B | 12 | 111 | 30220 | 117.88 | 1276 | 1241 | 245.8 |
| B | 11 | 111 | 27101 | 105.19 | 1276 | 1241 | 245.8 |
| C | 2 | 16 | 453498 | 1548.39 | 1231 | 1236 | 292.1 |
| C | 14 | 238 | 193819 | 659.34 | 1231 | 1236 | 292.1 |
| C | 13 | 61 | 8423 | 24.61 | 1231 | 1236 | 292.1 |
| D | 1 | 52 | 589092 | 1984.68 | 1246 | 1212 | 296.2 |
| D | 2 | 250 | 406974 | 1369.85 | 1246 | 1212 | 296.2 |
| D | 12 | 227 | 47949 | 157.78 | 1246 | 1212 | 296.2 |
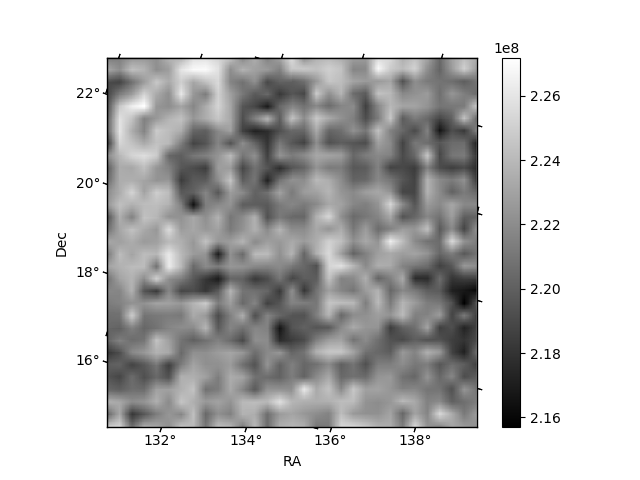
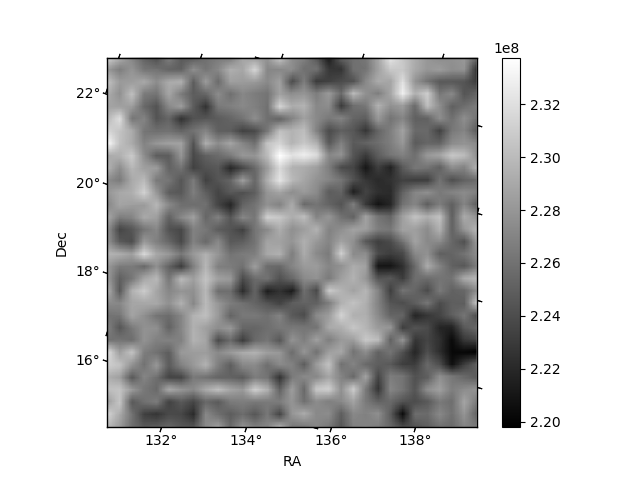
Histogram calculated using DETX and DETY for each event in the final _common_clean file
| Quadrant A | 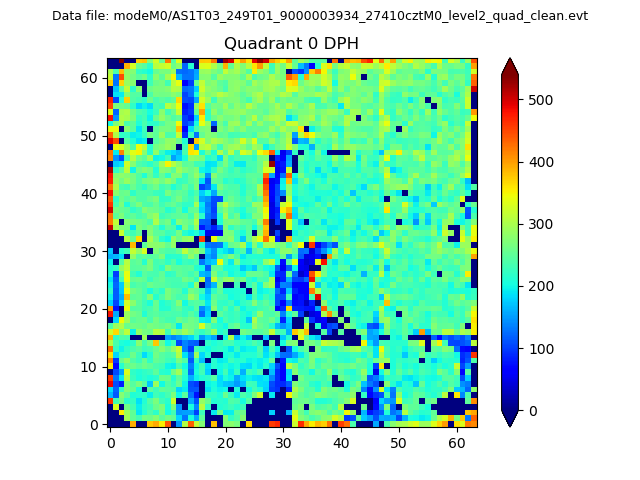 |
 |
Quadrant B |
|---|---|---|---|
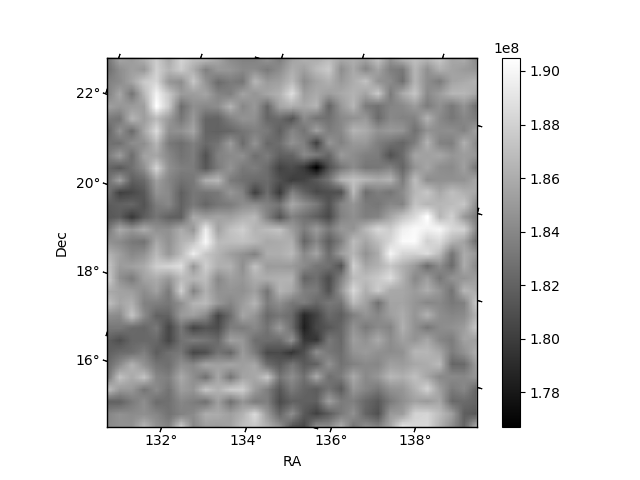
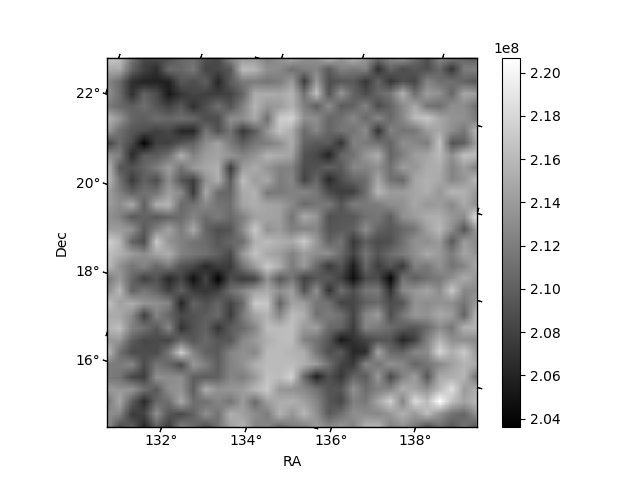
| Quadrant D | 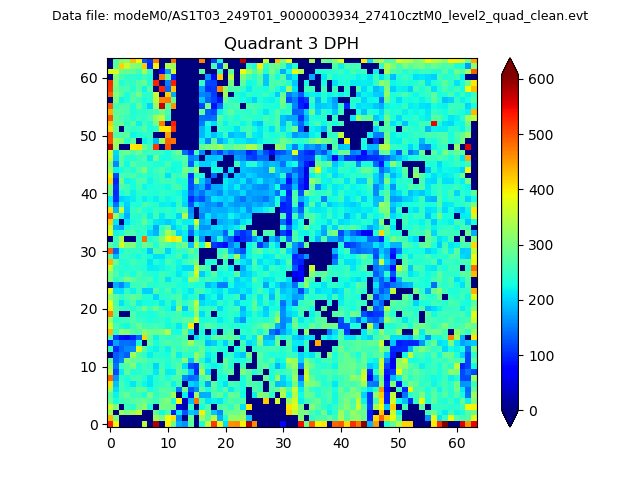 |
 |
Quadrant C |
| Plot type | Count rate plots | Images |
|---|---|---|
| Comparison with Poisson distribution Blue bars denote a histogram of data divided into 1 sec bins. Red curve is a Poisson curve with rate = median count rate of data. |
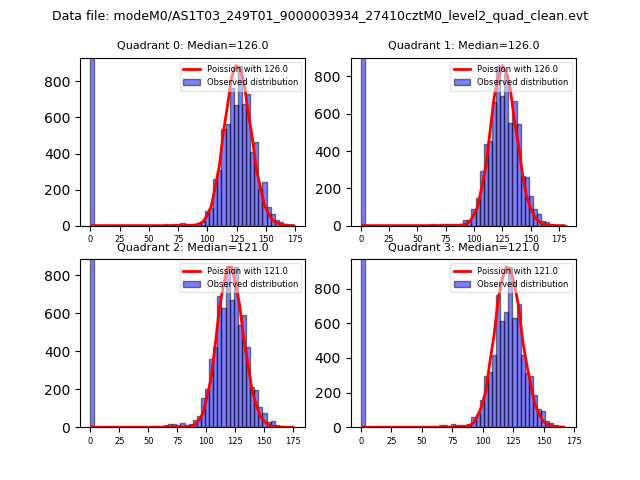 |
 |
| Quadrant-wise count rates Data is divided into 100 sec bins |
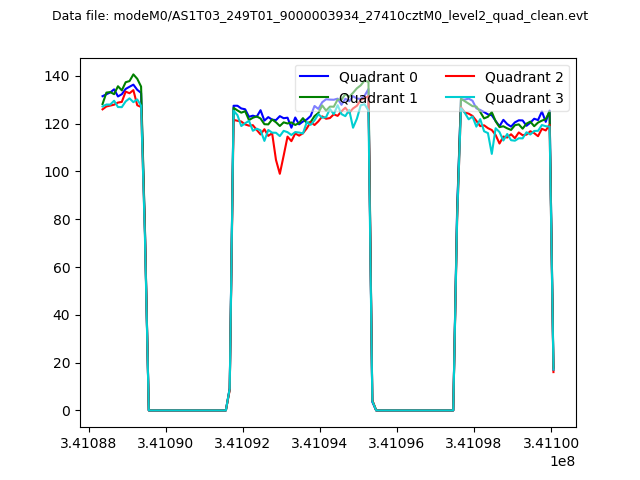 |
|
| Module-wise count rates for Quadrant A Data is divided into 100 sec bins |
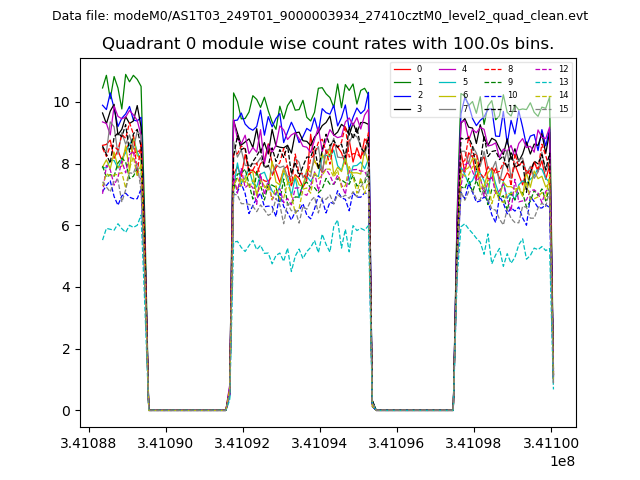 |
 |
| Module-wise count rates for Quadrant B Data is divided into 100 sec bins |
 |
 |
| Module-wise count rates for Quadrant C Data is divided into 100 sec bins |
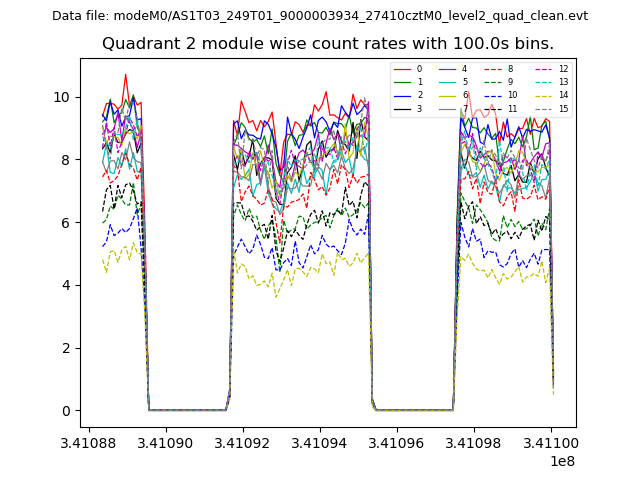 |
 |
| Module-wise count rates for Quadrant D Data is divided into 100 sec bins |
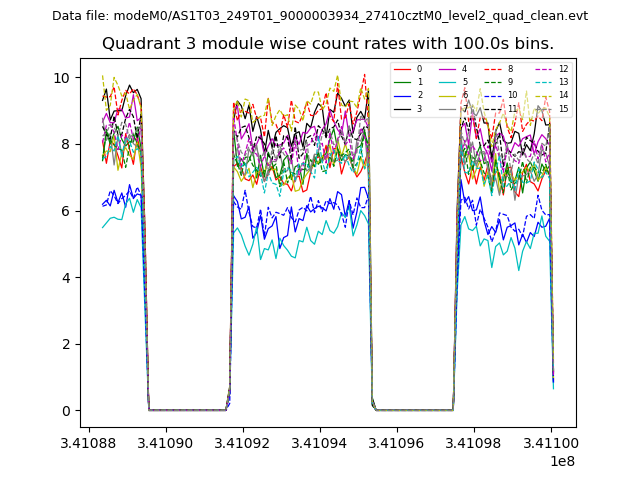 |
 |
| Parameter | Plot |
|---|---|
| CZT HV Monitor |  |
| D_VDD | 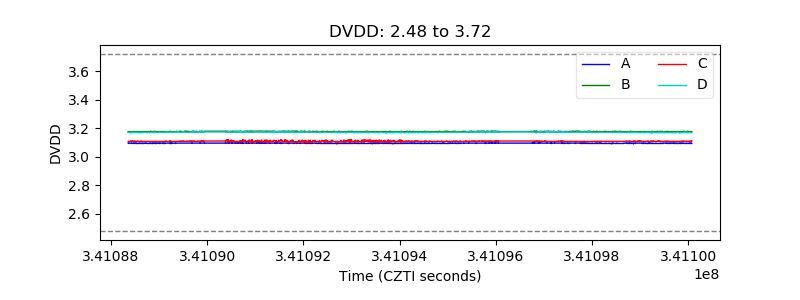 |
| Temperature 1 | 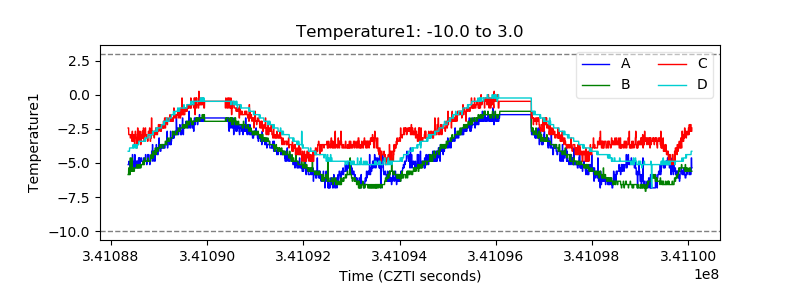 |
| Veto HV Monitor | 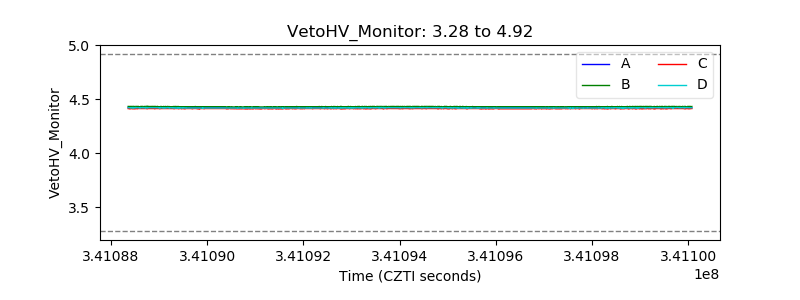 |
| Veto LLD | 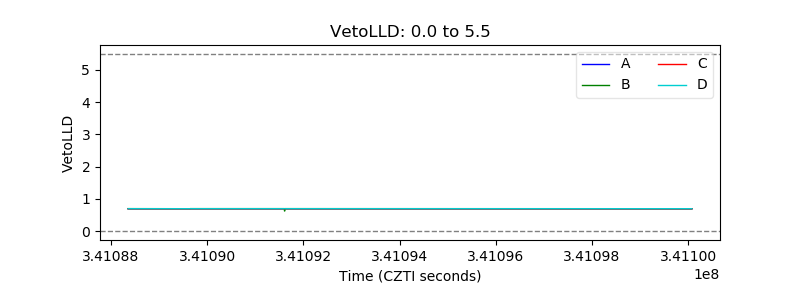 |
| Alpha Counter | 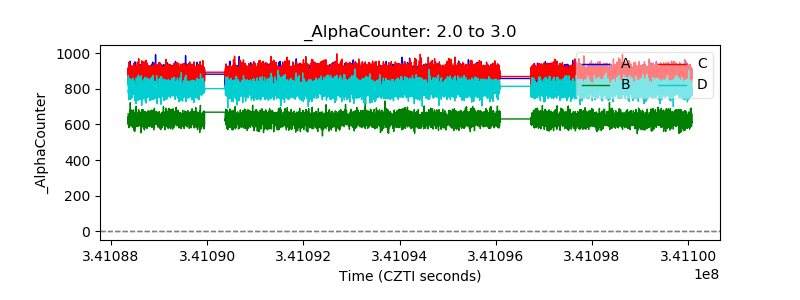 |
| _CPM_Rate | 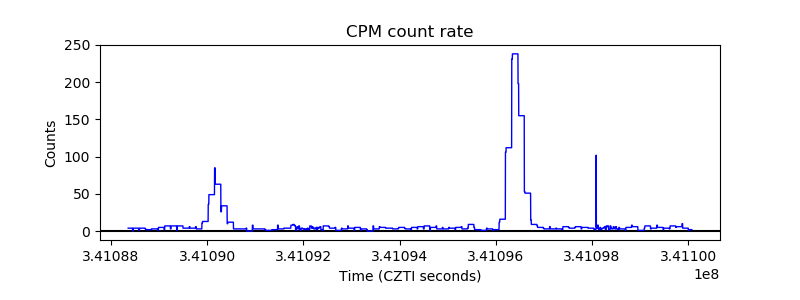 |
| CZT Counter | 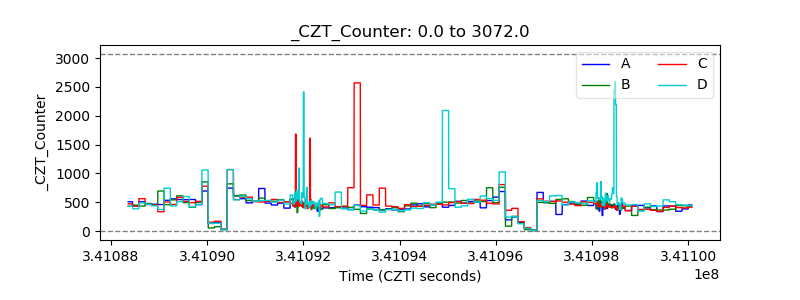 |
| +2.5 Volts monitor |  |
| +5 Volts monitor | 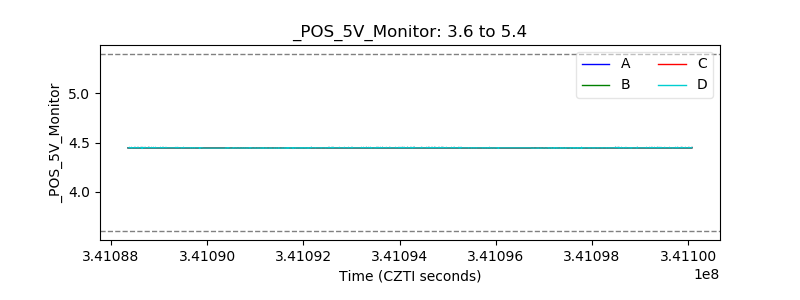 |
| _ROLL_ROT | 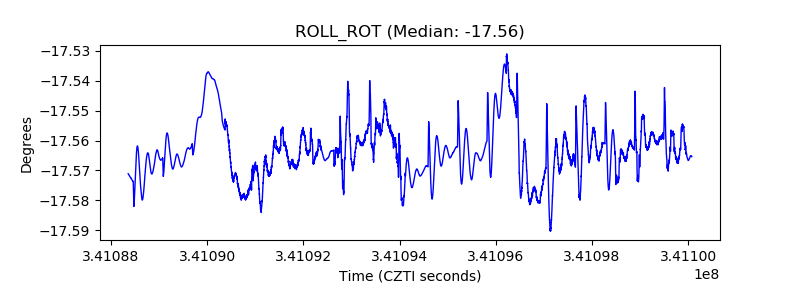 |
| _Roll_DEC | 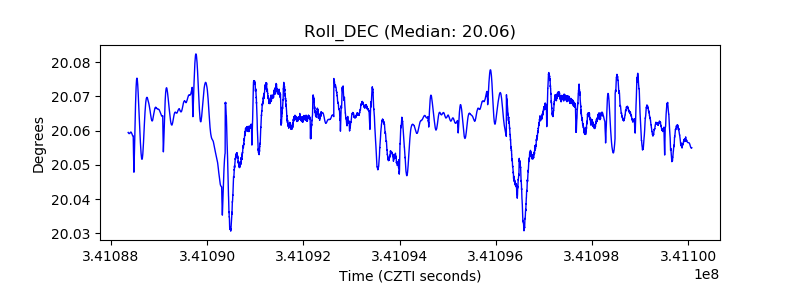 |
| _Roll_RA | 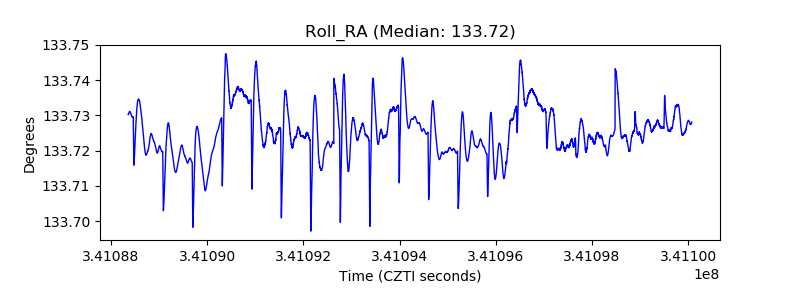 |
| Veto Counter | 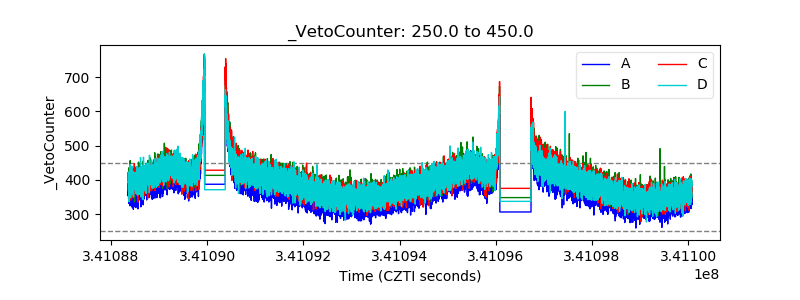 |