| Param | Original file | Final file |
|---|---|---|
| Filename | modeM0/AS1T03_249T01_9000003934_27412cztM0_level2.evt | modeM0/AS1T03_249T01_9000003934_27412cztM0_level2_quad_clean.evt |
| Size (bytes) | 1,117,008,000 | 202,124,160 |
| Size | 1.0 GB | 192.8 MB |
| Events in quadrant A | 6,970,516 | 1,321,702 |
| Events in quadrant B | 6,994,061 | 1,335,283 |
| Events in quadrant C | 7,135,621 | 1,265,970 |
| Events in quadrant D | 11,758,338 | 1,207,425 |
| Mode M0 | |||
|---|---|---|---|
| Quadrant | BADHDUFLAG | Total packets | Discarded packets |
| A | 0 | 29907 | 0 |
| B | 0 | 30060 | 0 |
| C | 0 | 30428 | 0 |
| D | 0 | 44824 | 0 |
| Mode M9 | |||
|---|---|---|---|
| Quadrant | BADHDUFLAG | Total packets | Discarded packets |
| A | 0 | 28 | 0 |
| B | 0 | 28 | 0 |
| C | 0 | 28 | 0 |
| D | 0 | 28 | 0 |
| Quadrant | Total seconds | Saturated seconds | Saturation percentage |
|---|---|---|---|
| A | 14357 | 59 | 0.410949% |
| B | 14356 | 94 | 0.654778% |
| C | 14357 | 200 | 1.393049% |
| D | 14357 | 1002 | 6.979174% |
Noise dominated data is calculated using 1-second bins in cleaned event files. If a bin has >2000 counts, and if more than 50% of those come from <1% of pixels, then it is considered to be noise-dominated and hence unusable.
| Quadrant | # 1 sec bins | Bins with >0 counts | Bins with >2000 counts | High rate bins dominated by noise | Noise dominated (total time) | Noise dominated (detector-on time) | Marked lightcurve |
|---|---|---|---|---|---|---|---|
| A | 17152 | 14360 | 12 | 12 | 0.07% | 0.08% | 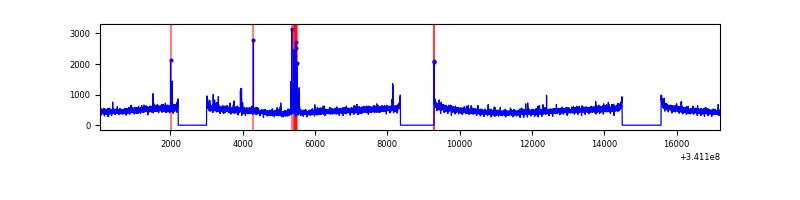 |
| B | 17151 | 14358 | 2 | 2 | 0.01% | 0.01% | 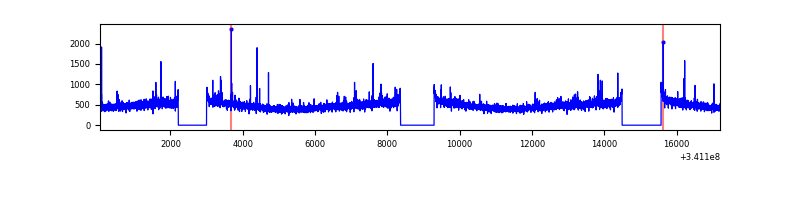 |
| C | 17152 | 14360 | 13 | 13 | 0.08% | 0.09% | 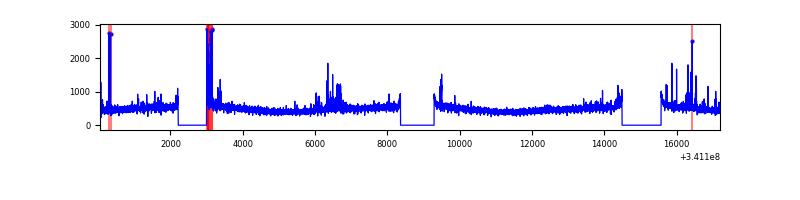 |
| D | 17152 | 14360 | 945 | 945 | 5.51% | 6.58% | 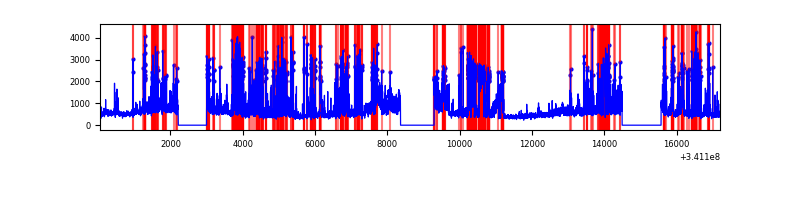 |
Top three noisy pixels from each quadrant. If the there are fewer than three noisy pixels in the level2.evt file, extra rows are filled as -1
| Pixel properties | Quadrant properties | ||||||
|---|---|---|---|---|---|---|---|
| Quadrant | DetID | PixID | Counts | Sigma | Mean | Median | Sigma |
| A | 14 | 235 | 96892 | 270.48 | 1770 | 1733 | 351.8 |
| A | 13 | 254 | 23981 | 63.24 | 1770 | 1733 | 351.8 |
| A | 12 | 96 | 19596 | 50.77 | 1770 | 1733 | 351.8 |
| B | 12 | 111 | 41680 | 119.89 | 1759 | 1716 | 333.3 |
| B | 11 | 111 | 37145 | 106.29 | 1759 | 1716 | 333.3 |
| B | 14 | 111 | 33217 | 94.5 | 1759 | 1716 | 333.3 |
| C | 14 | 238 | 274668 | 690.92 | 1691 | 1701 | 395.1 |
| C | 2 | 16 | 258585 | 650.21 | 1691 | 1701 | 395.1 |
| C | 13 | 61 | 11735 | 25.4 | 1691 | 1701 | 395.1 |
| D | 1 | 52 | 5000437 | 12674.23 | 1663 | 1619 | 394.4 |
| D | 2 | 250 | 369856 | 933.64 | 1663 | 1619 | 394.4 |
| D | 2 | 234 | 56521 | 139.2 | 1663 | 1619 | 394.4 |
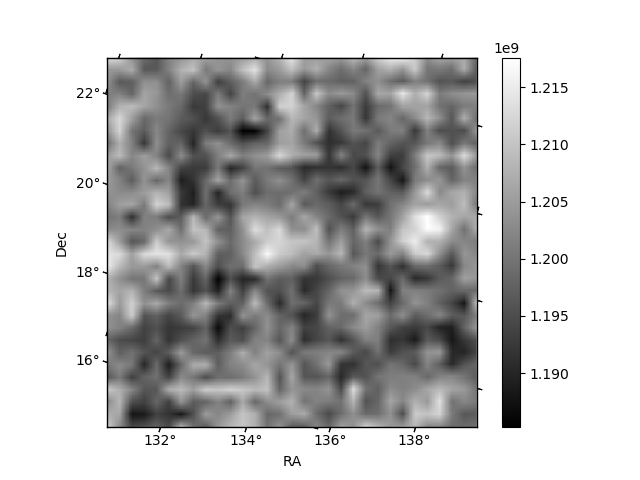
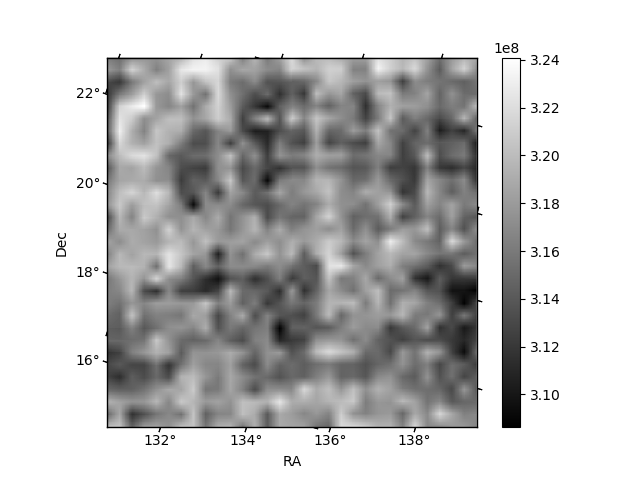
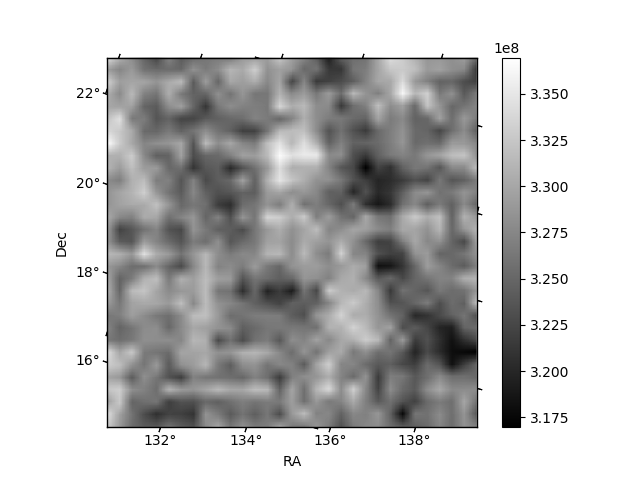
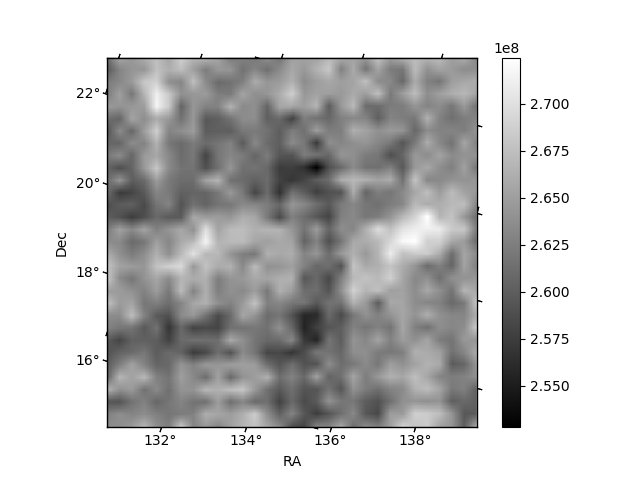
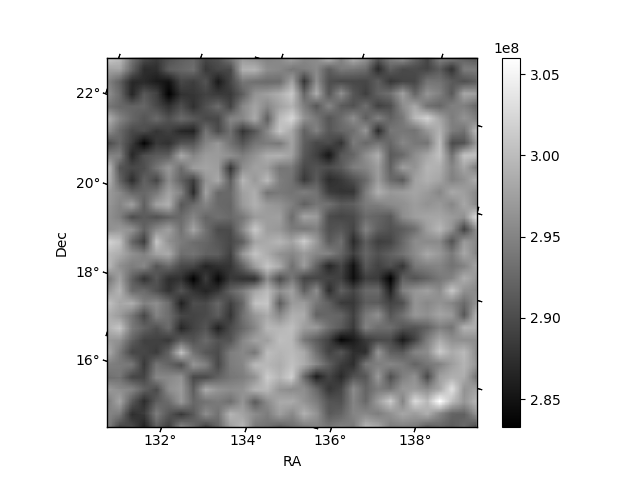
Histogram calculated using DETX and DETY for each event in the final _common_clean file
| Quadrant A | 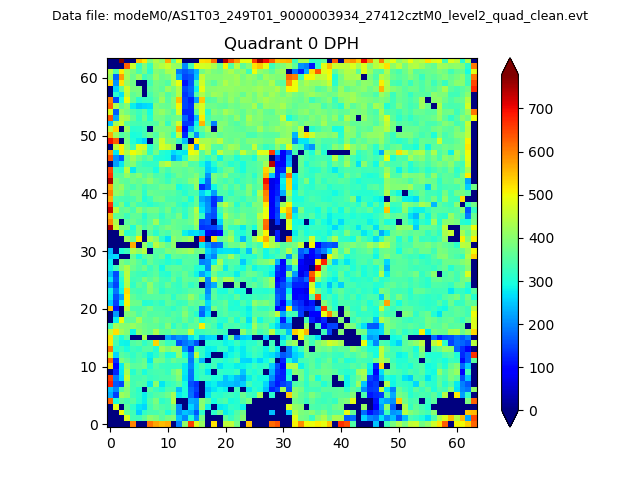 |
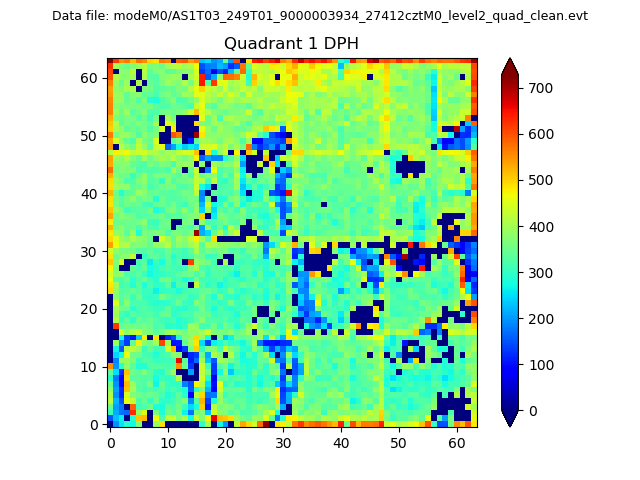 |
Quadrant B |
|---|---|---|---|
| Quadrant D |  |
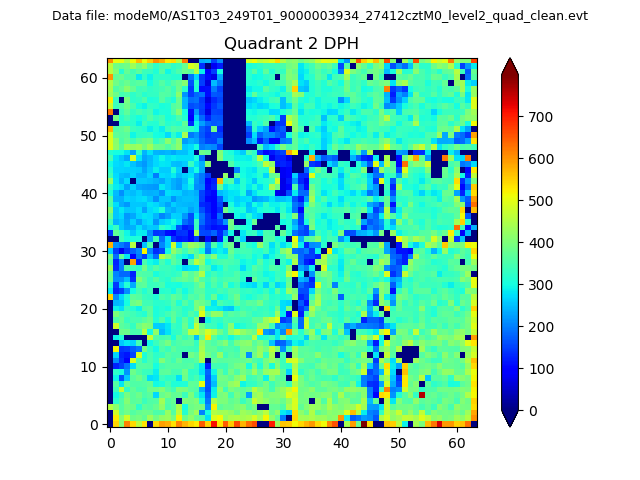 |
Quadrant C |
| Plot type | Count rate plots | Images |
|---|---|---|
| Comparison with Poisson distribution Blue bars denote a histogram of data divided into 1 sec bins. Red curve is a Poisson curve with rate = median count rate of data. |
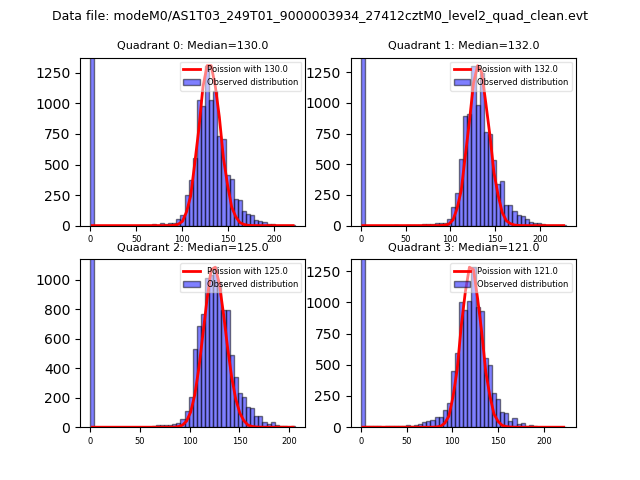 |
 |
| Quadrant-wise count rates Data is divided into 100 sec bins |
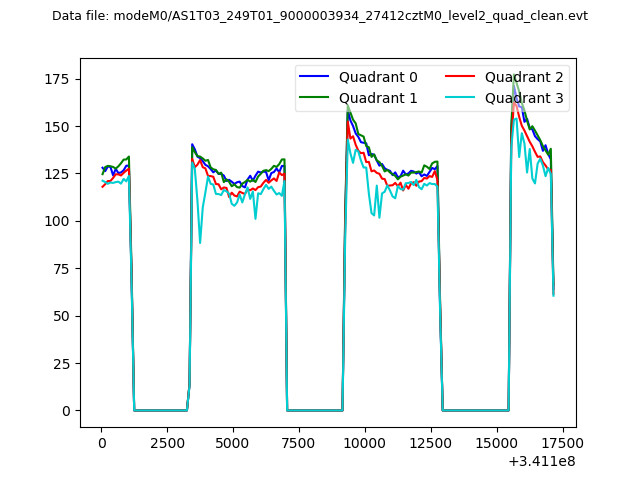 |
|
| Module-wise count rates for Quadrant A Data is divided into 100 sec bins |
 |
 |
| Module-wise count rates for Quadrant B Data is divided into 100 sec bins |
 |
 |
| Module-wise count rates for Quadrant C Data is divided into 100 sec bins |
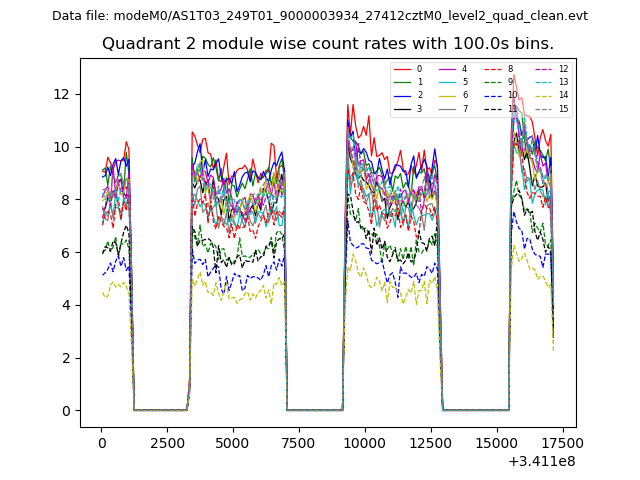 |
 |
| Module-wise count rates for Quadrant D Data is divided into 100 sec bins |
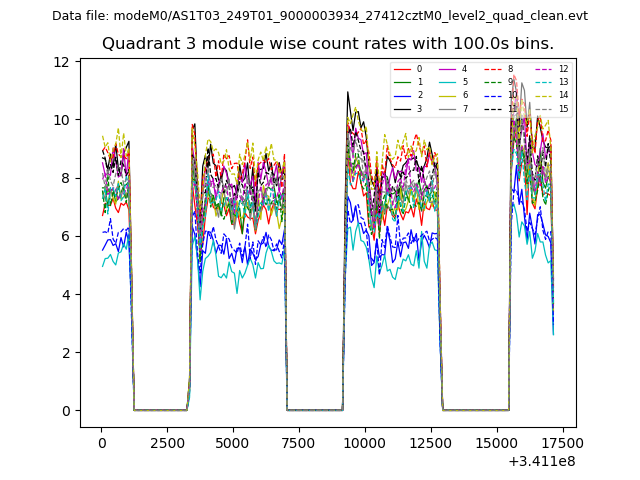 |
 |
| Parameter | Plot |
|---|---|
| CZT HV Monitor | 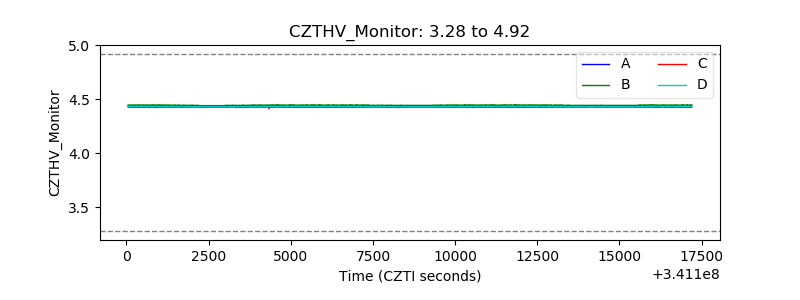 |
| D_VDD | 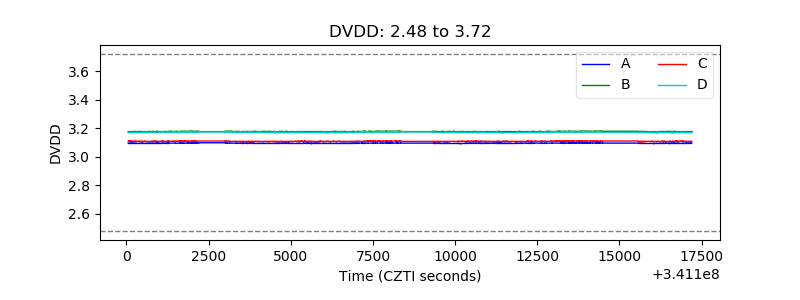 |
| Temperature 1 | 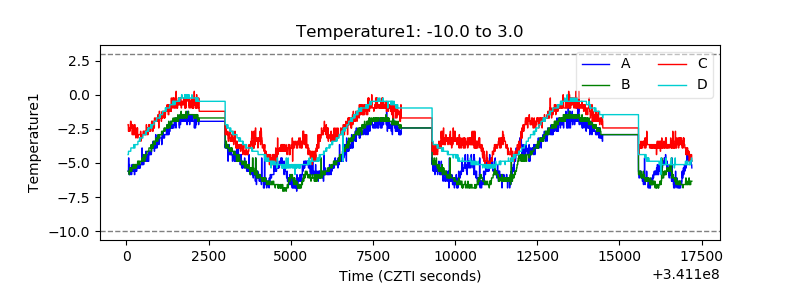 |
| Veto HV Monitor | 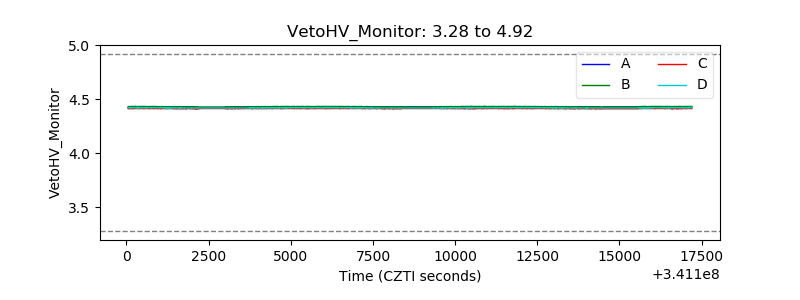 |
| Veto LLD | 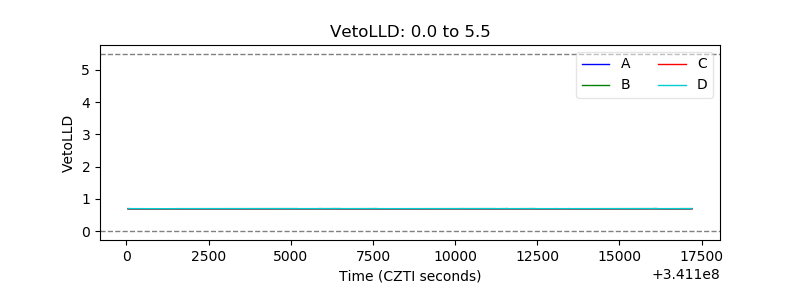 |
| Alpha Counter | 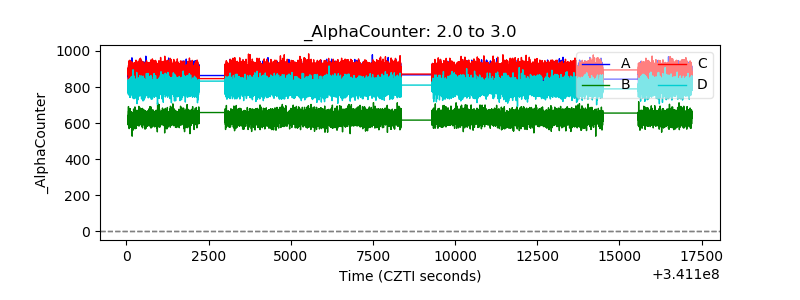 |
| _CPM_Rate | 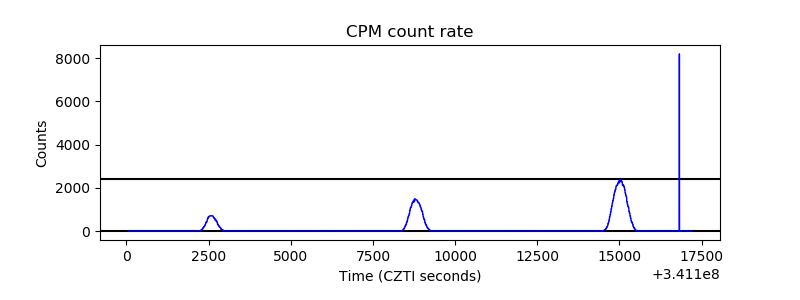 |
| CZT Counter | 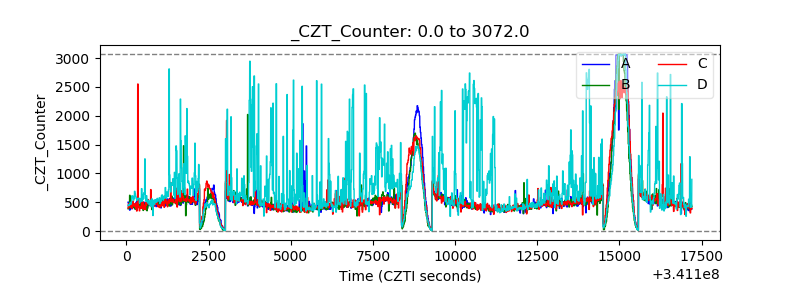 |
| +2.5 Volts monitor |  |
| +5 Volts monitor |  |
| _ROLL_ROT |  |
| _Roll_DEC | 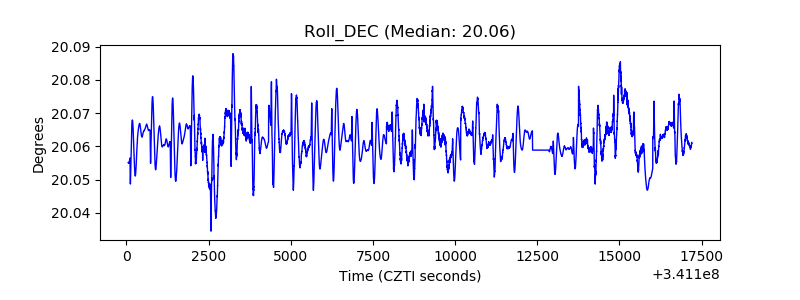 |
| _Roll_RA | 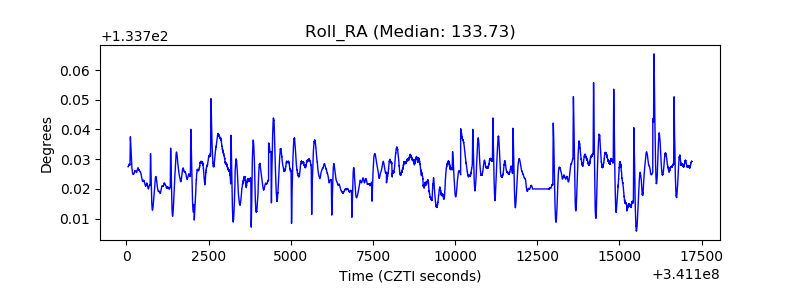 |
| Veto Counter | 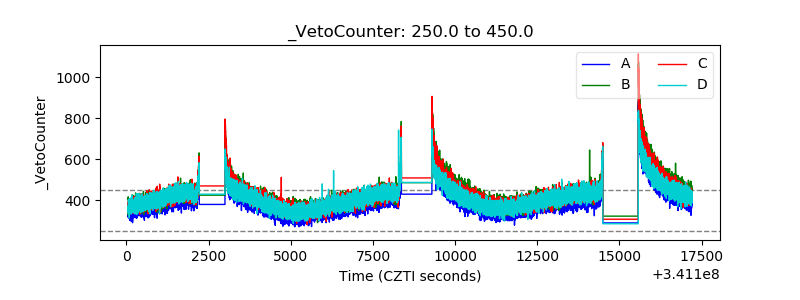 |