| Param | Original file | Final file |
|---|---|---|
| Filename | modeM0/AS1T03_249T01_9000003934_27414cztM0_level2.evt | modeM0/AS1T03_249T01_9000003934_27414cztM0_level2_quad_clean.evt |
| Size (bytes) | 2,801,537,280 | 528,955,200 |
| Size | 2.6 GB | 504.5 MB |
| Events in quadrant A | 18,669,123 | 3,429,005 |
| Events in quadrant B | 18,888,522 | 3,455,969 |
| Events in quadrant C | 19,372,326 | 3,279,830 |
| Events in quadrant D | 25,303,324 | 3,199,047 |
| Mode M0 | |||
|---|---|---|---|
| Quadrant | BADHDUFLAG | Total packets | Discarded packets |
| A | 0 | 80074 | 0 |
| B | 0 | 80876 | 0 |
| C | 0 | 82015 | 0 |
| D | 0 | 101232 | 0 |
| Mode M9 | |||
|---|---|---|---|
| Quadrant | BADHDUFLAG | Total packets | Discarded packets |
| A | 0 | 64 | 0 |
| B | 0 | 64 | 0 |
| C | 0 | 64 | 0 |
| D | 0 | 64 | 0 |
| Quadrant | Total seconds | Saturated seconds | Saturation percentage |
|---|---|---|---|
| A | 38712 | 224 | 0.578632% |
| B | 38713 | 315 | 0.813680% |
| C | 38713 | 607 | 1.567949% |
| D | 38713 | 1395 | 3.603441% |
Noise dominated data is calculated using 1-second bins in cleaned event files. If a bin has >2000 counts, and if more than 50% of those come from <1% of pixels, then it is considered to be noise-dominated and hence unusable.
| Quadrant | # 1 sec bins | Bins with >0 counts | Bins with >2000 counts | High rate bins dominated by noise | Noise dominated (total time) | Noise dominated (detector-on time) | Marked lightcurve |
|---|---|---|---|---|---|---|---|
| A | 45017 | 38718 | 15 | 15 | 0.03% | 0.04% | 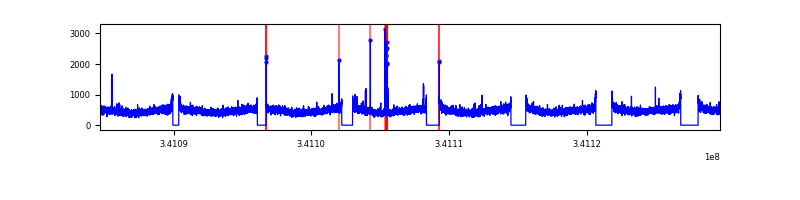 |
| B | 45018 | 38717 | 15 | 15 | 0.03% | 0.04% | 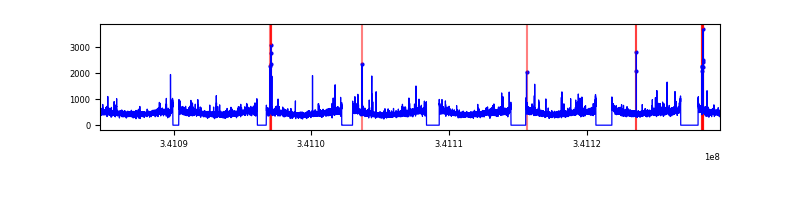 |
| C | 45018 | 38718 | 83 | 83 | 0.18% | 0.21% | 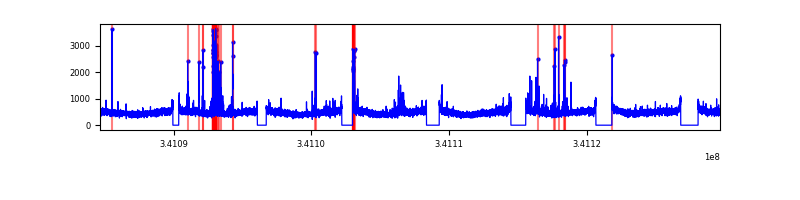 |
| D | 45018 | 38719 | 1173 | 1173 | 2.61% | 3.03% | 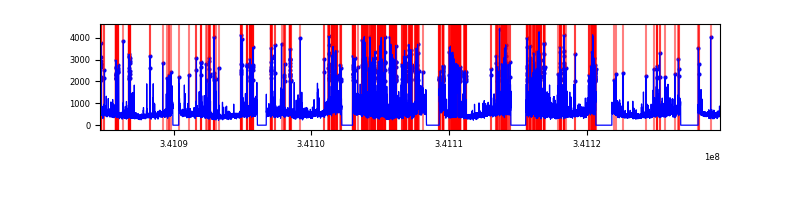 |
Top three noisy pixels from each quadrant. If the there are fewer than three noisy pixels in the level2.evt file, extra rows are filled as -1
| Pixel properties | Quadrant properties | ||||||
|---|---|---|---|---|---|---|---|
| Quadrant | DetID | PixID | Counts | Sigma | Mean | Median | Sigma |
| A | 14 | 235 | 102197 | 103.52 | 4787 | 4688 | 941.9 |
| A | 13 | 254 | 66366 | 65.48 | 4787 | 4688 | 941.9 |
| A | 3 | 137 | 44797 | 42.58 | 4787 | 4688 | 941.9 |
| B | 12 | 111 | 110811 | 118.02 | 4752 | 4635 | 899.7 |
| B | 11 | 111 | 98971 | 104.86 | 4752 | 4635 | 899.7 |
| B | 14 | 111 | 89144 | 93.93 | 4752 | 4635 | 899.7 |
| C | 2 | 16 | 791863 | 738.51 | 4571 | 4606 | 1066.0 |
| C | 14 | 238 | 734975 | 685.14 | 4571 | 4606 | 1066.0 |
| C | 13 | 61 | 31586 | 25.31 | 4571 | 4606 | 1066.0 |
| D | 1 | 52 | 6618151 | 6137.82 | 4563 | 4443 | 1077.5 |
| D | 2 | 250 | 1126534 | 1041.35 | 4563 | 4443 | 1077.5 |
| D | 2 | 234 | 159796 | 144.17 | 4563 | 4443 | 1077.5 |
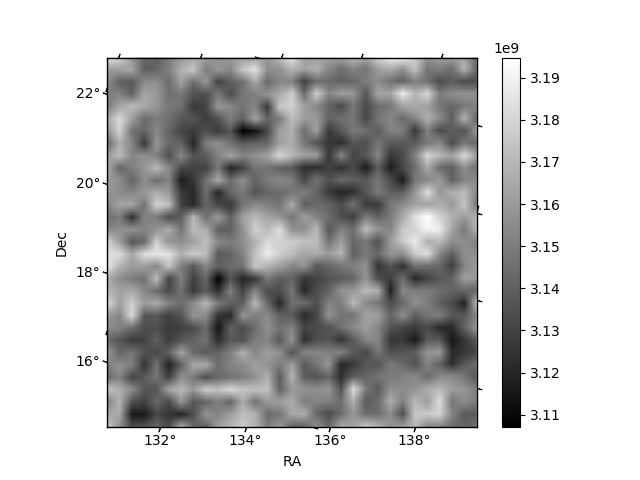
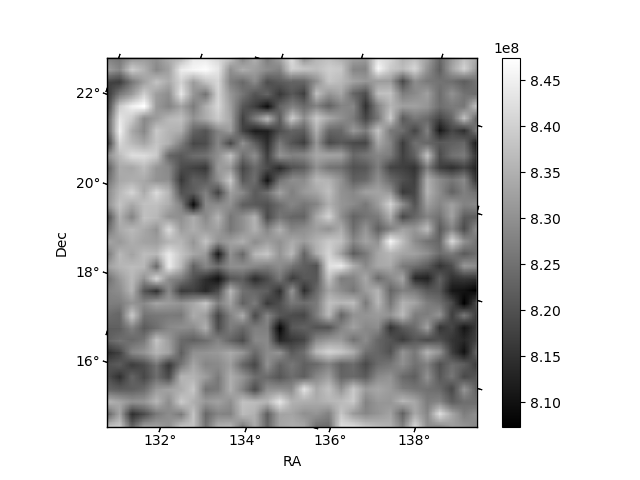
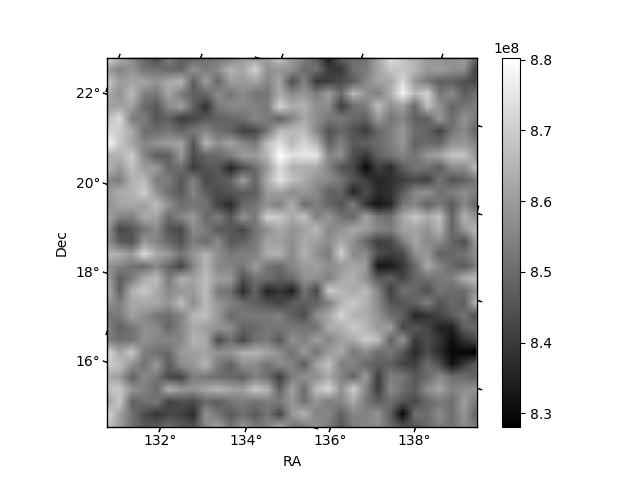
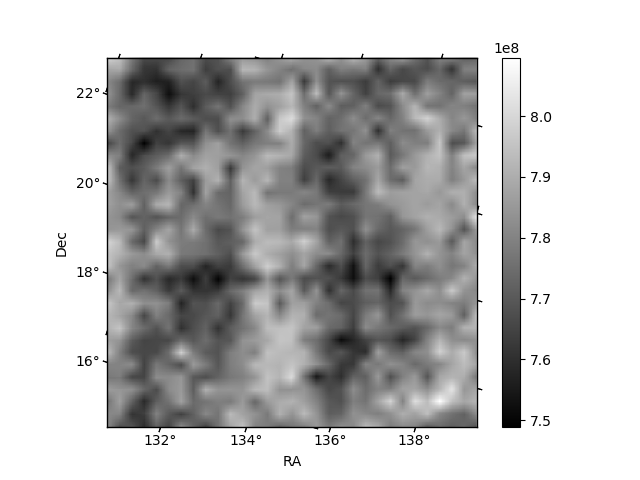
Histogram calculated using DETX and DETY for each event in the final _common_clean file
| Quadrant A | 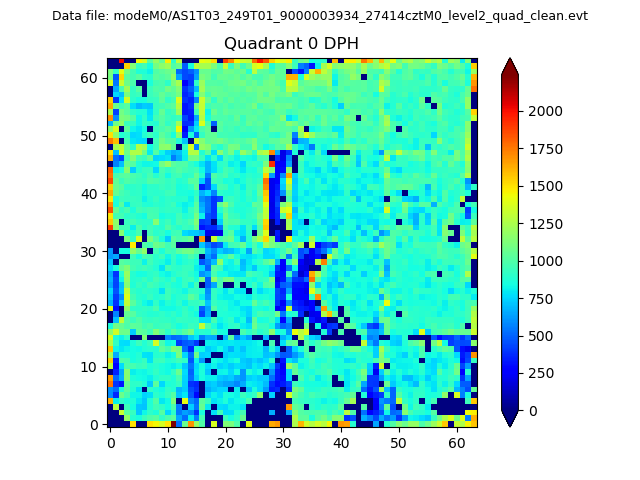 |
 |
Quadrant B |
|---|---|---|---|
| Quadrant D | 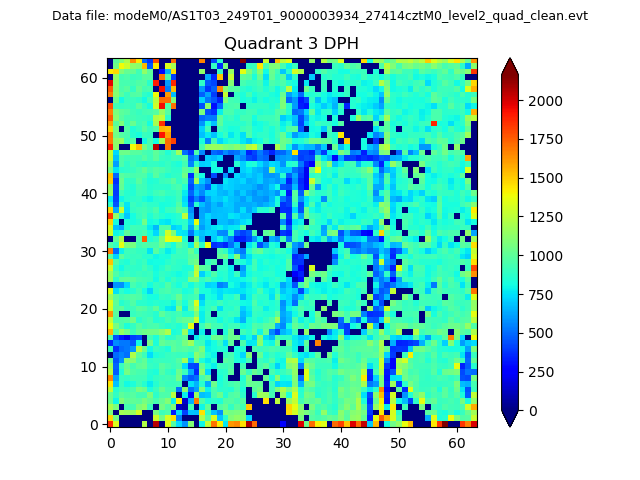 |
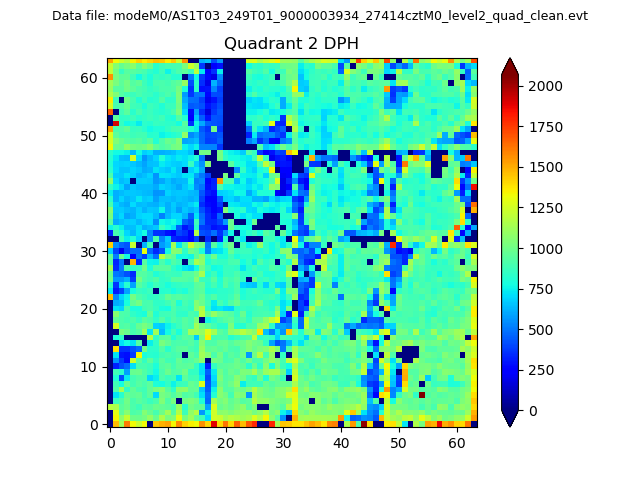 |
Quadrant C |
| Plot type | Count rate plots | Images |
|---|---|---|
| Comparison with Poisson distribution Blue bars denote a histogram of data divided into 1 sec bins. Red curve is a Poisson curve with rate = median count rate of data. |
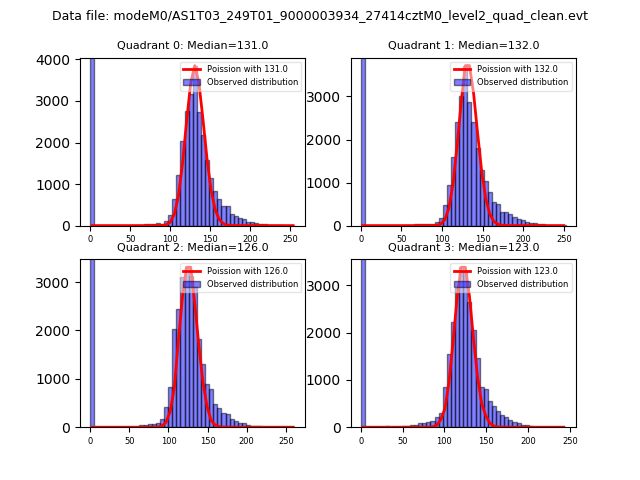 |
 |
| Quadrant-wise count rates Data is divided into 100 sec bins |
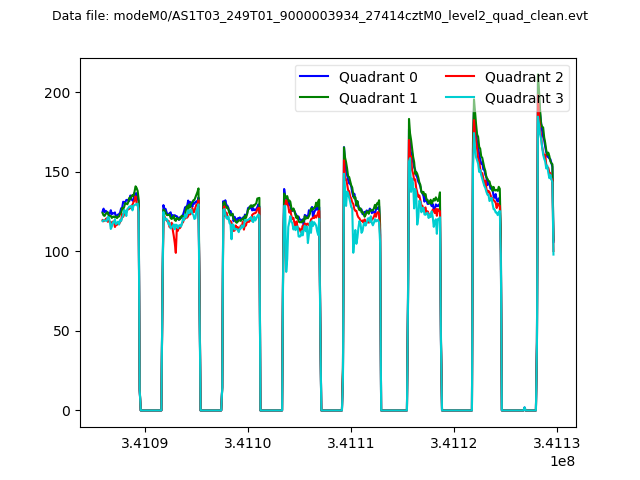 |
|
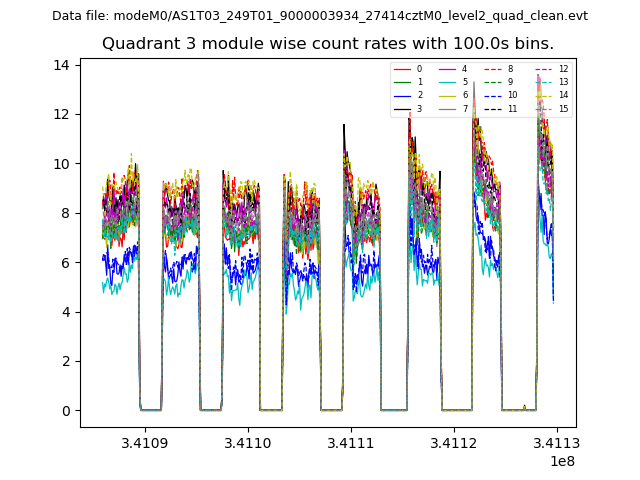
| Module-wise count rates for Quadrant A Data is divided into 100 sec bins |
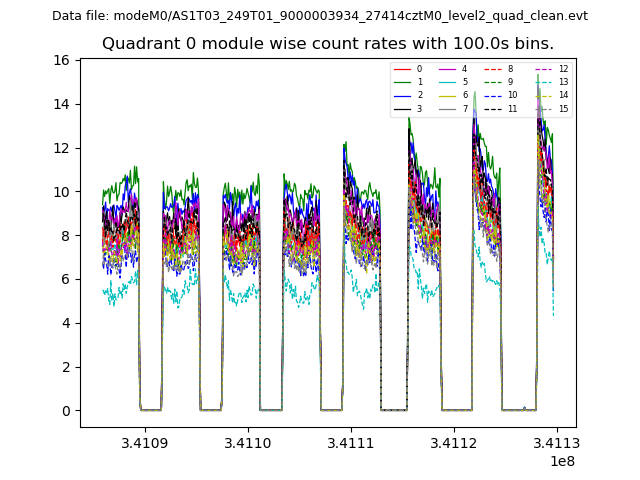 |
 |
| Module-wise count rates for Quadrant B Data is divided into 100 sec bins |
 |
 |
| Module-wise count rates for Quadrant C Data is divided into 100 sec bins |
 |
 |
| Module-wise count rates for Quadrant D Data is divided into 100 sec bins |
 |
 |
| Parameter | Plot |
|---|---|
| CZT HV Monitor | 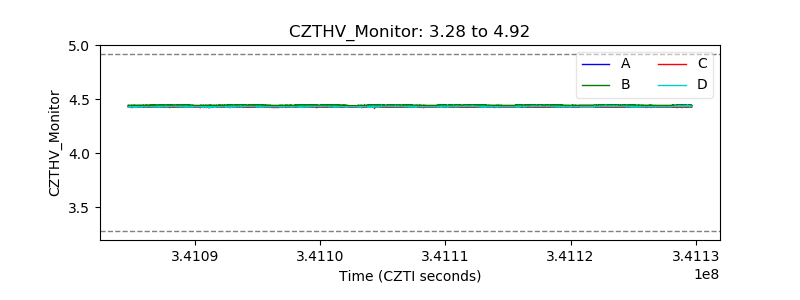 |
| D_VDD | 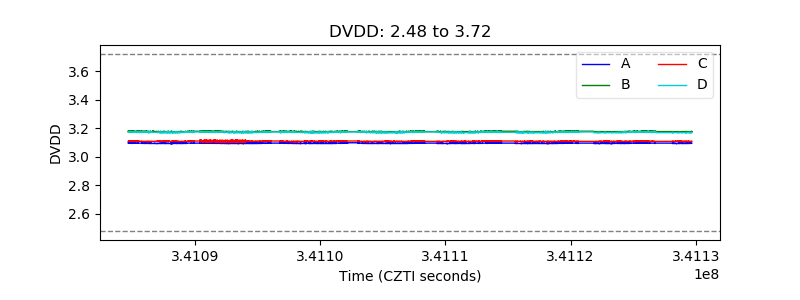 |
| Temperature 1 | 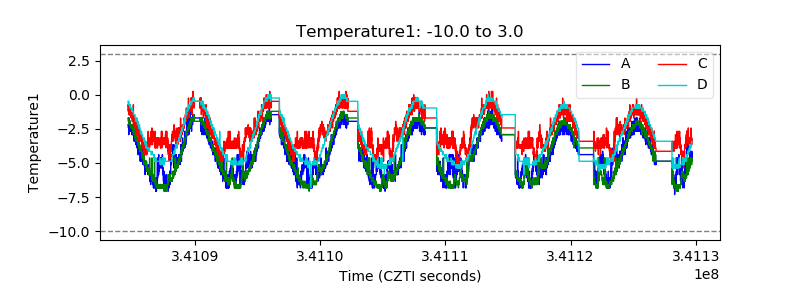 |
| Veto HV Monitor | 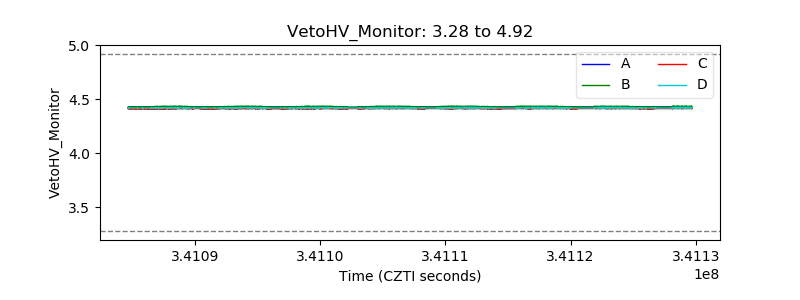 |
| Veto LLD | 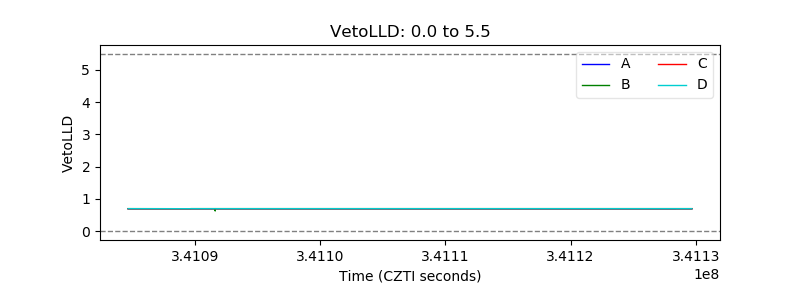 |
| Alpha Counter |  |
| _CPM_Rate | 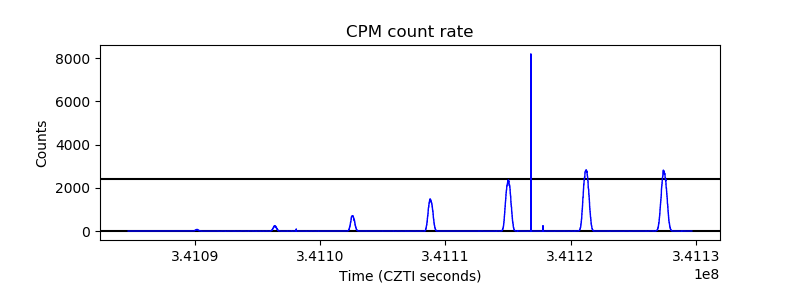 |
| CZT Counter |  |
| +2.5 Volts monitor |  |
| +5 Volts monitor |  |
| _ROLL_ROT | 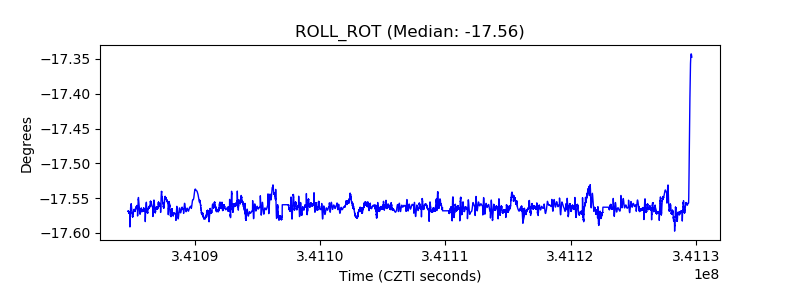 |
| _Roll_DEC | 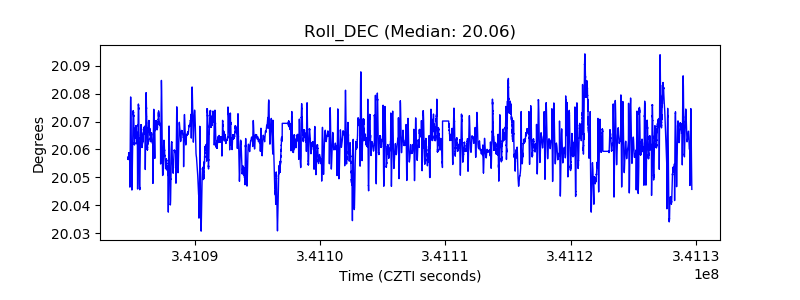 |
| _Roll_RA | 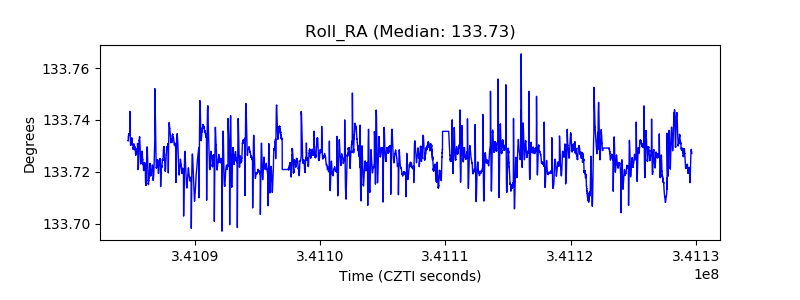 |
| Veto Counter | 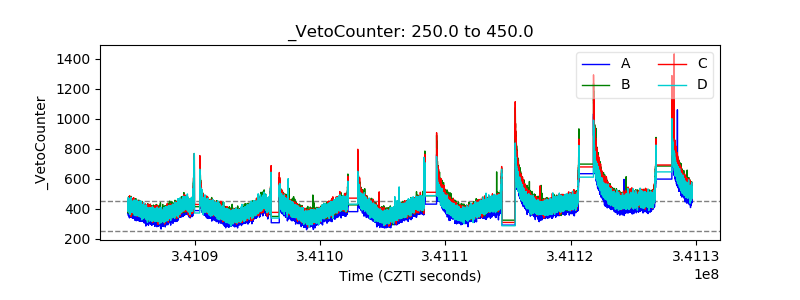 |