| Param | Original file | Final file |
|---|---|---|
| Filename | modeM0/AS1T03_249T01_9000003934_27416cztM0_level2.evt | modeM0/AS1T03_249T01_9000003934_27416cztM0_level2_quad_clean.evt |
| Size (bytes) | 427,610,880 | 77,351,040 |
| Size | 407.8 MB | 73.8 MB |
| Events in quadrant A | 2,839,534 | 503,754 |
| Events in quadrant B | 2,950,024 | 509,102 |
| Events in quadrant C | 3,064,124 | 475,810 |
| Events in quadrant D | 3,725,270 | 471,299 |
| Mode M0 | |||
|---|---|---|---|
| Quadrant | BADHDUFLAG | Total packets | Discarded packets |
| A | 0 | 11395 | 0 |
| B | 0 | 11845 | 0 |
| C | 0 | 12128 | 0 |
| D | 0 | 14470 | 0 |
| Mode M9 | |||
|---|---|---|---|
| Quadrant | BADHDUFLAG | Total packets | Discarded packets |
| A | 0 | 13 | 0 |
| B | 0 | 13 | 0 |
| C | 0 | 13 | 0 |
| D | 0 | 13 | 0 |
| Quadrant | Total seconds | Saturated seconds | Saturation percentage |
|---|---|---|---|
| A | 5460 | 44 | 0.805861% |
| B | 5461 | 59 | 1.080388% |
| C | 5460 | 144 | 2.637363% |
| D | 5460 | 172 | 3.150183% |
Noise dominated data is calculated using 1-second bins in cleaned event files. If a bin has >2000 counts, and if more than 50% of those come from <1% of pixels, then it is considered to be noise-dominated and hence unusable.
| Quadrant | # 1 sec bins | Bins with >0 counts | Bins with >2000 counts | High rate bins dominated by noise | Noise dominated (total time) | Noise dominated (detector-on time) | Marked lightcurve |
|---|---|---|---|---|---|---|---|
| A | 6770 | 5461 | 1 | 1 | 0.01% | 0.02% | 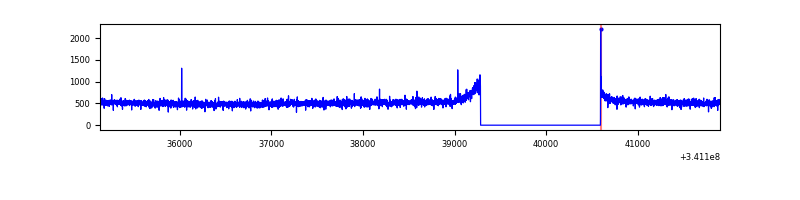 |
| B | 6771 | 5462 | 1 | 1 | 0.01% | 0.02% | 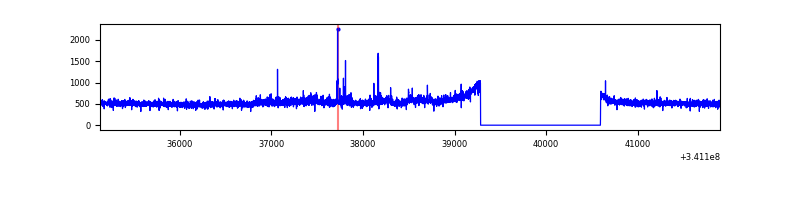 |
| C | 6770 | 5461 | 75 | 75 | 1.11% | 1.37% | 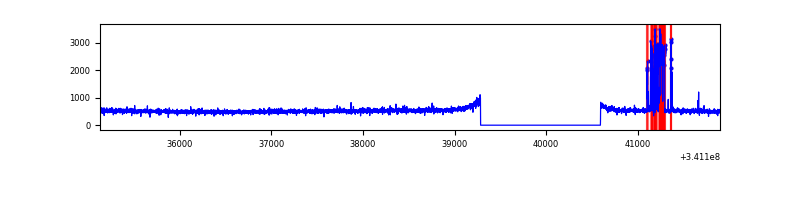 |
| D | 6770 | 5461 | 124 | 124 | 1.83% | 2.27% | 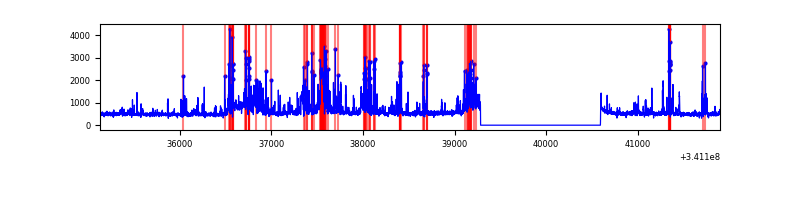 |
Top three noisy pixels from each quadrant. If the there are fewer than three noisy pixels in the level2.evt file, extra rows are filled as -1
| Pixel properties | Quadrant properties | ||||||
|---|---|---|---|---|---|---|---|
| Quadrant | DetID | PixID | Counts | Sigma | Mean | Median | Sigma |
| A | 13 | 254 | 8504 | 52.94 | 734 | 720 | 147.0 |
| A | 3 | 137 | 6563 | 39.74 | 734 | 720 | 147.0 |
| A | 0 | 226 | 6312 | 38.03 | 734 | 720 | 147.0 |
| B | 7 | 205 | 101017 | 732.81 | 721 | 704 | 136.9 |
| B | 12 | 111 | 16109 | 112.54 | 721 | 704 | 136.9 |
| B | 11 | 111 | 14744 | 102.57 | 721 | 704 | 136.9 |
| C | 2 | 16 | 247149 | 1520.88 | 693 | 698 | 162.0 |
| C | 14 | 238 | 113258 | 694.62 | 693 | 698 | 162.0 |
| C | 13 | 61 | 4729 | 24.88 | 693 | 698 | 162.0 |
| D | 1 | 52 | 706034 | 4289.54 | 701 | 685 | 164.4 |
| D | 2 | 250 | 297187 | 1803.16 | 701 | 685 | 164.4 |
| D | 2 | 120 | 58091 | 349.11 | 701 | 685 | 164.4 |
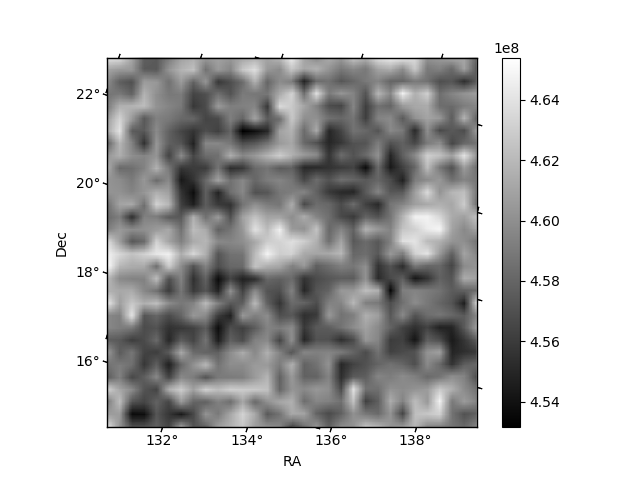
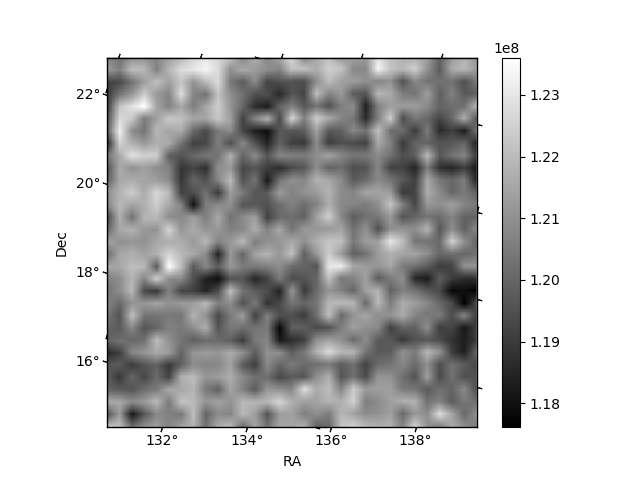
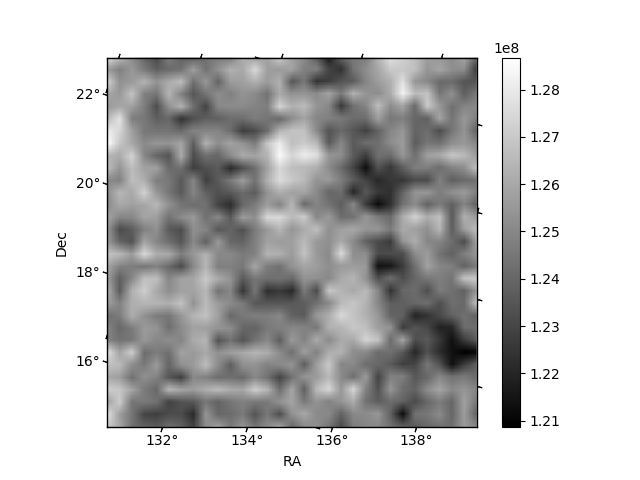
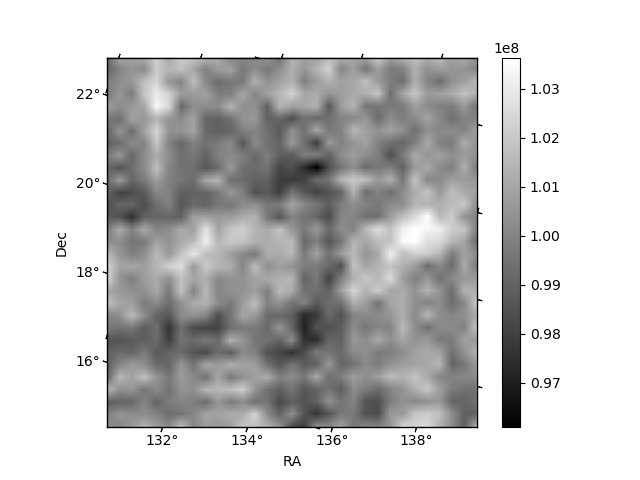
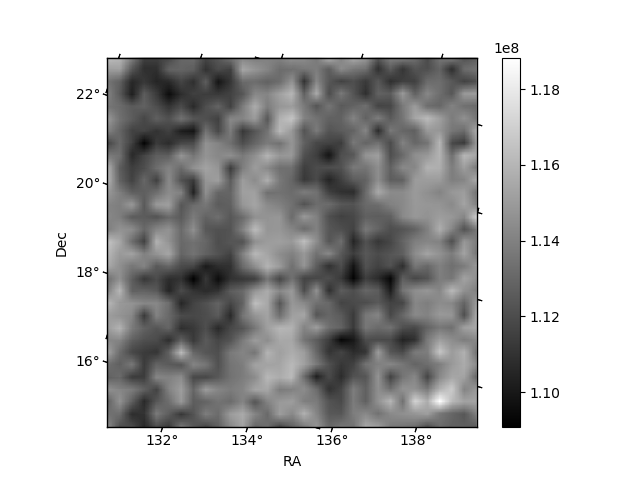
Histogram calculated using DETX and DETY for each event in the final _common_clean file
| Quadrant A | 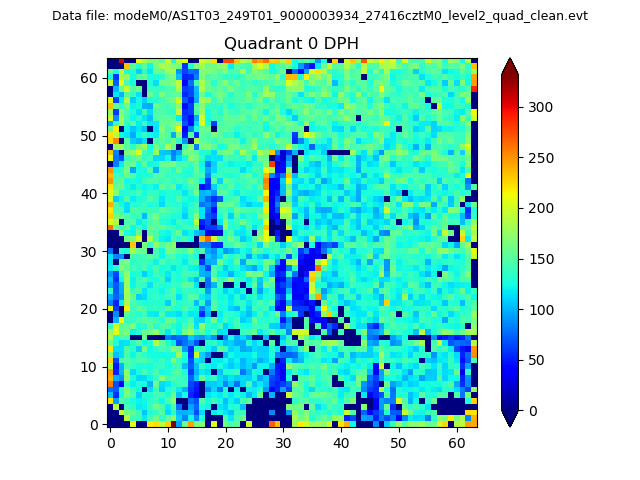 |
 |
Quadrant B |
|---|---|---|---|
| Quadrant D | 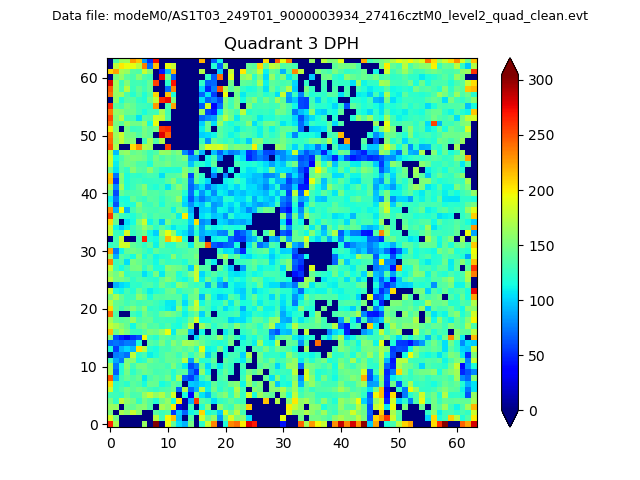 |
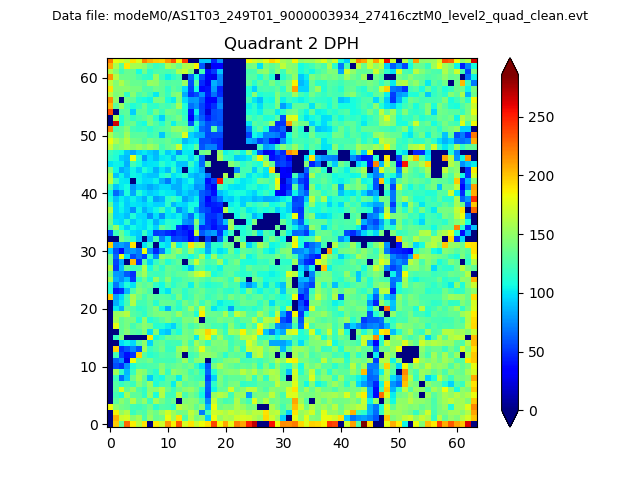 |
Quadrant C |
| Plot type | Count rate plots | Images |
|---|---|---|
| Comparison with Poisson distribution Blue bars denote a histogram of data divided into 1 sec bins. Red curve is a Poisson curve with rate = median count rate of data. |
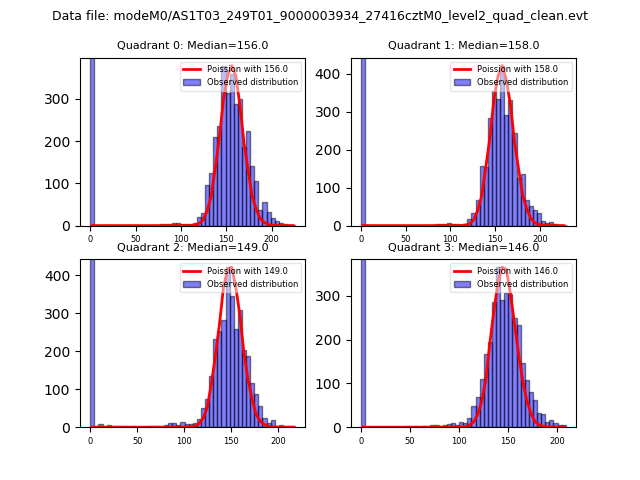 |
 |
| Quadrant-wise count rates Data is divided into 100 sec bins |
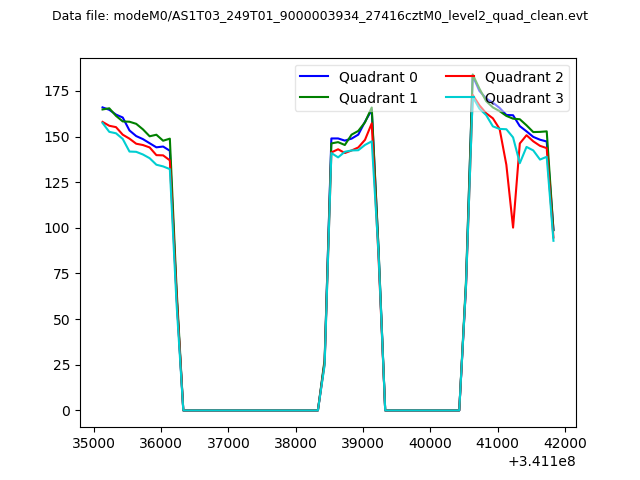 |
|
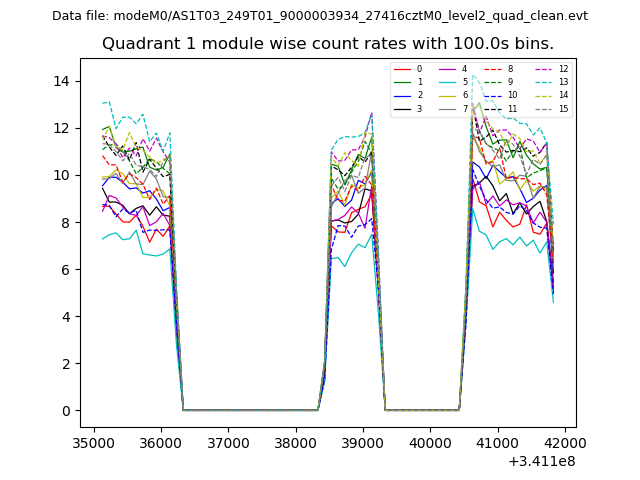
| Module-wise count rates for Quadrant A Data is divided into 100 sec bins |
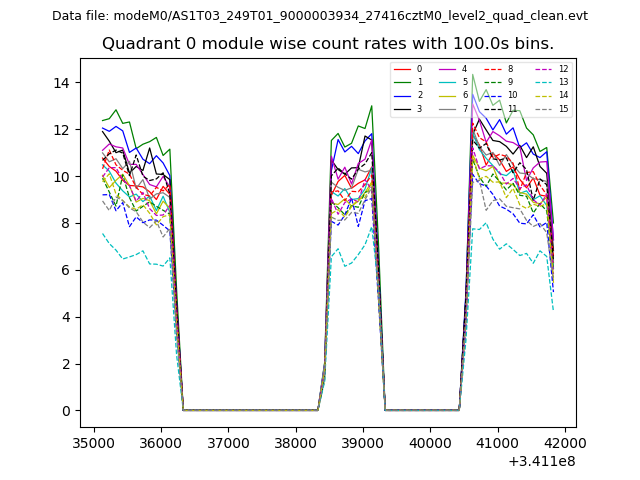 |
 |
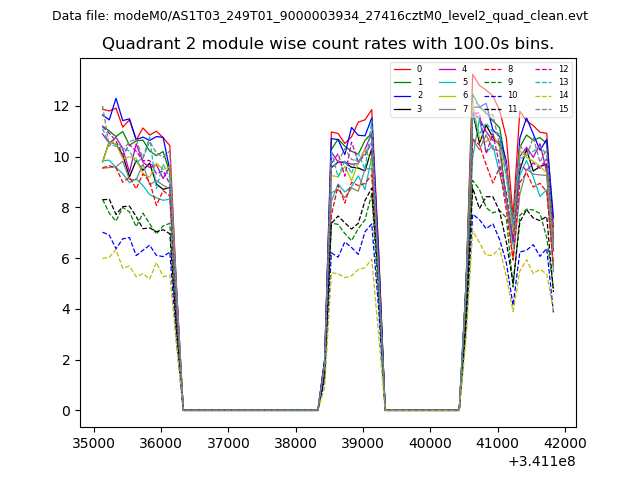
| Module-wise count rates for Quadrant B Data is divided into 100 sec bins |
 |
 |
| Module-wise count rates for Quadrant C Data is divided into 100 sec bins |
 |
 |
| Module-wise count rates for Quadrant D Data is divided into 100 sec bins |
 |
 |
| Parameter | Plot |
|---|---|
| CZT HV Monitor | 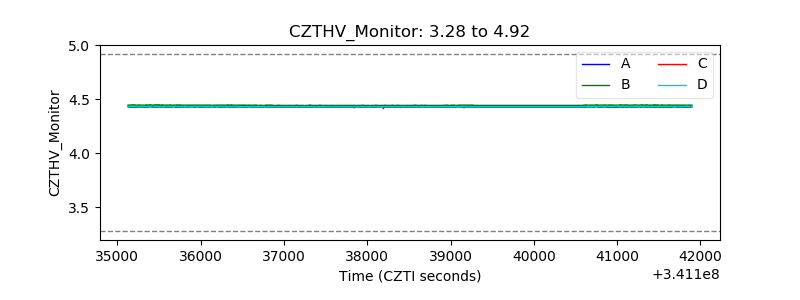 |
| D_VDD | 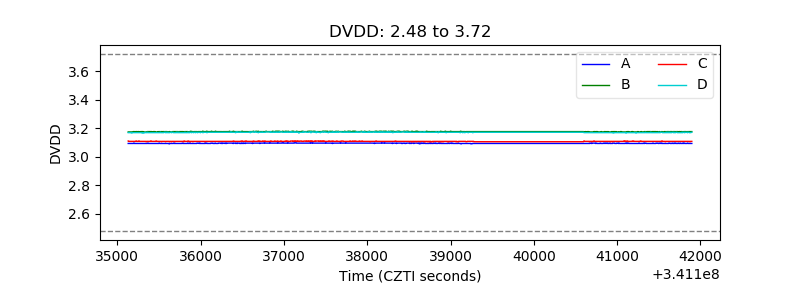 |
| Temperature 1 | 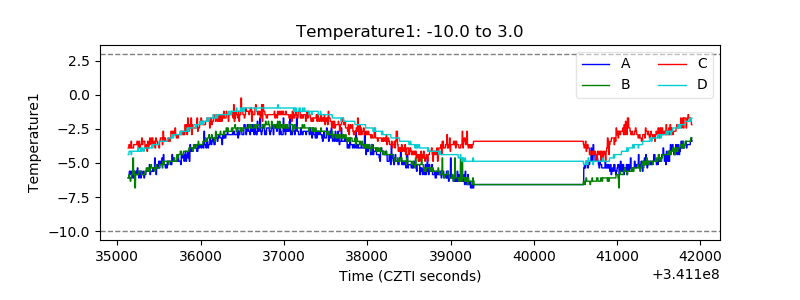 |
| Veto HV Monitor | 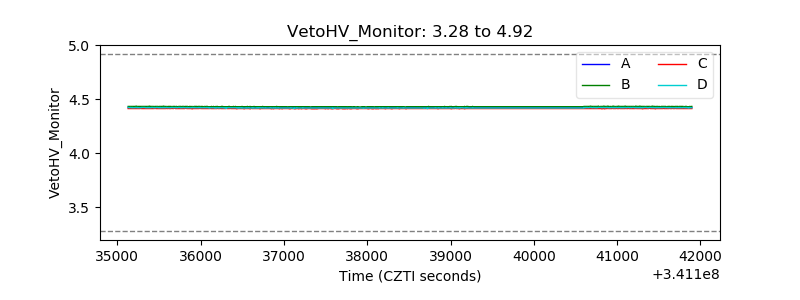 |
| Veto LLD | 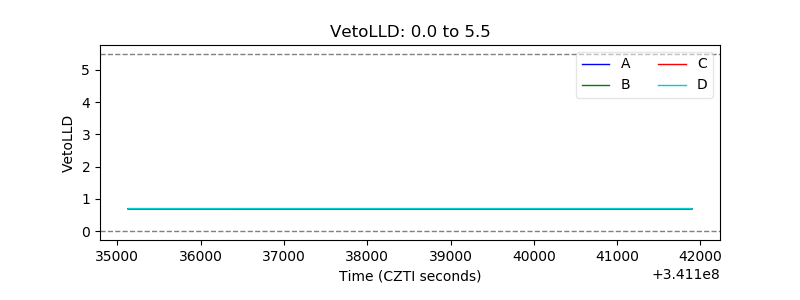 |
| Alpha Counter | 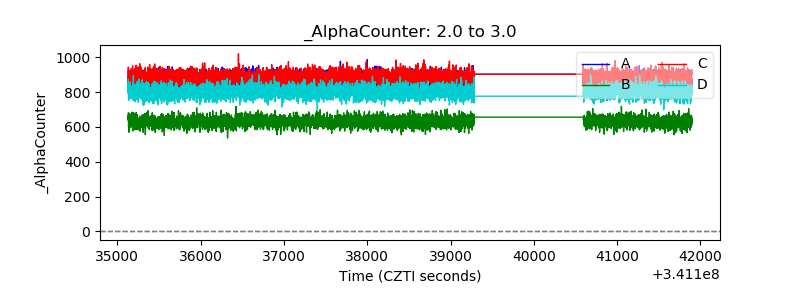 |
| _CPM_Rate | 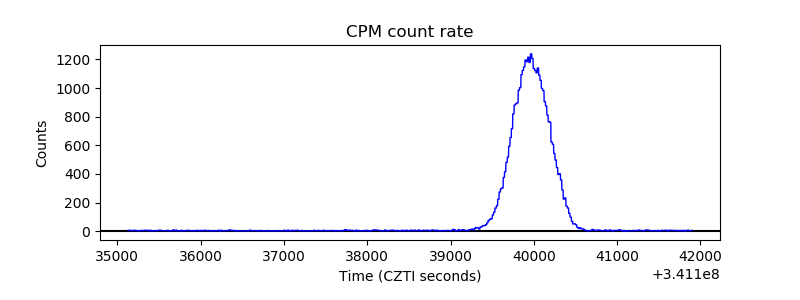 |
| CZT Counter | 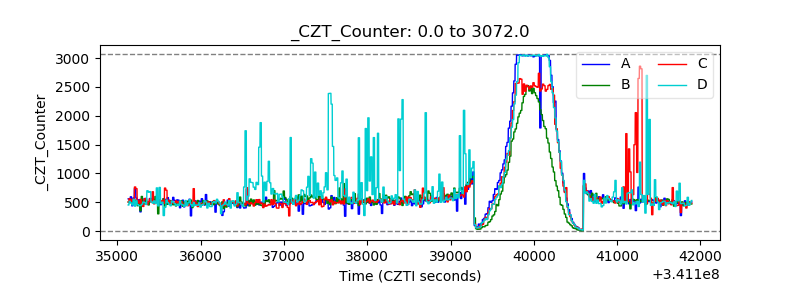 |
| +2.5 Volts monitor |  |
| +5 Volts monitor |  |
| _ROLL_ROT | 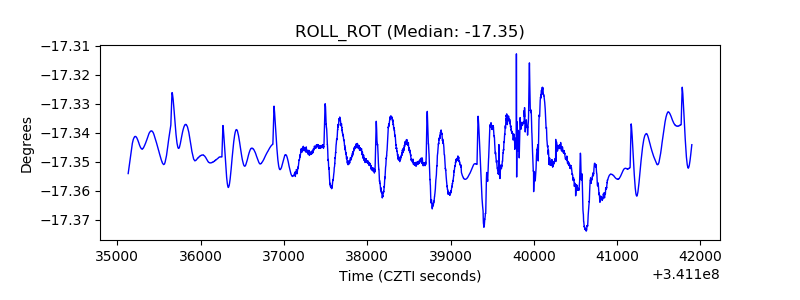 |
| _Roll_DEC | 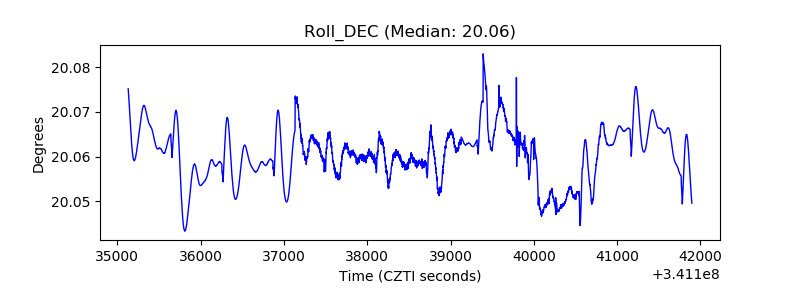 |
| _Roll_RA | 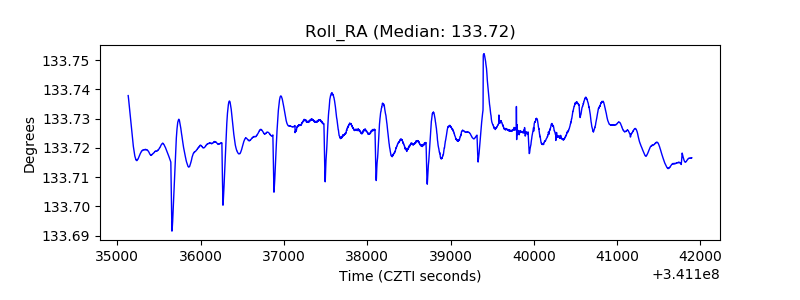 |
| Veto Counter | 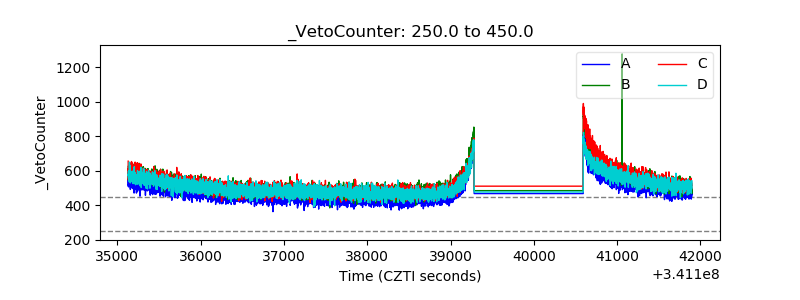 |