| Param | Original file | Final file |
|---|---|---|
| Filename | modeM0/AS1T03_249T01_9000003934_27417cztM0_level2.evt | modeM0/AS1T03_249T01_9000003934_27417cztM0_level2_quad_clean.evt |
| Size (bytes) | 506,430,720 | 91,370,880 |
| Size | 483.0 MB | 87.1 MB |
| Events in quadrant A | 3,264,893 | 598,802 |
| Events in quadrant B | 3,347,181 | 603,640 |
| Events in quadrant C | 3,990,714 | 559,276 |
| Events in quadrant D | 4,304,539 | 562,912 |
| Mode M0 | |||
|---|---|---|---|
| Quadrant | BADHDUFLAG | Total packets | Discarded packets |
| A | 0 | 13180 | 0 |
| B | 0 | 13443 | 0 |
| C | 0 | 15523 | 0 |
| D | 0 | 16886 | 0 |
| Mode M9 | |||
|---|---|---|---|
| Quadrant | BADHDUFLAG | Total packets | Discarded packets |
| A | 0 | 11 | 0 |
| B | 0 | 11 | 0 |
| C | 0 | 11 | 0 |
| D | 0 | 11 | 0 |
| Quadrant | Total seconds | Saturated seconds | Saturation percentage |
|---|---|---|---|
| A | 6331 | 115 | 1.816459% |
| B | 6333 | 110 | 1.736934% |
| C | 6333 | 359 | 5.668719% |
| D | 6333 | 201 | 3.173851% |
Noise dominated data is calculated using 1-second bins in cleaned event files. If a bin has >2000 counts, and if more than 50% of those come from <1% of pixels, then it is considered to be noise-dominated and hence unusable.
| Quadrant | # 1 sec bins | Bins with >0 counts | Bins with >2000 counts | High rate bins dominated by noise | Noise dominated (total time) | Noise dominated (detector-on time) | Marked lightcurve |
|---|---|---|---|---|---|---|---|
| A | 7431 | 6331 | 0 | 0 | 0.00% | 0.00% | 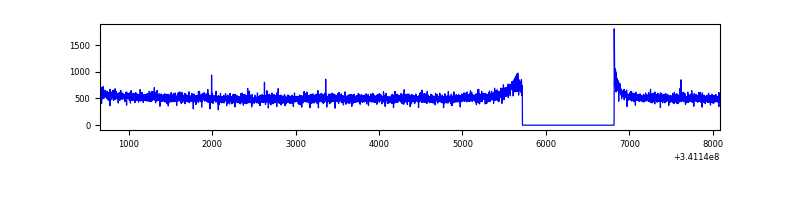 |
| B | 7433 | 6333 | 0 | 0 | 0.00% | 0.00% | 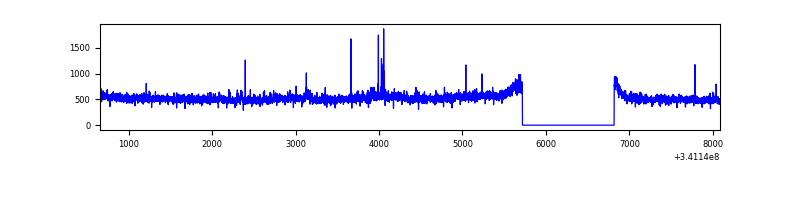 |
| C | 7433 | 6333 | 200 | 200 | 2.69% | 3.16% | 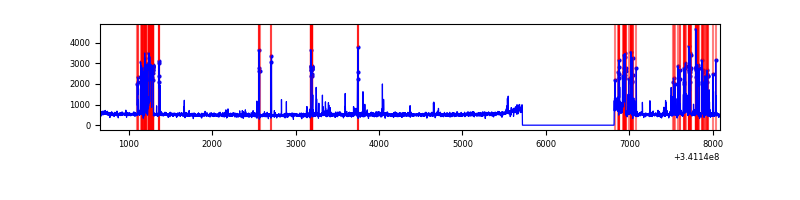 |
| D | 7433 | 6333 | 92 | 92 | 1.24% | 1.45% | 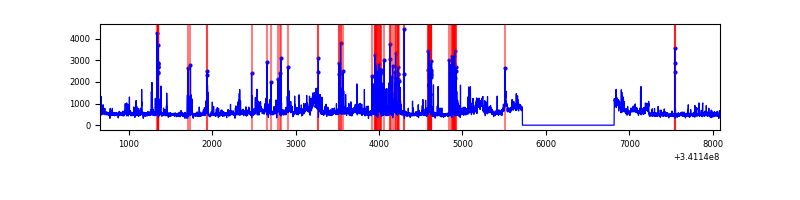 |
Top three noisy pixels from each quadrant. If the there are fewer than three noisy pixels in the level2.evt file, extra rows are filled as -1
| Pixel properties | Quadrant properties | ||||||
|---|---|---|---|---|---|---|---|
| Quadrant | DetID | PixID | Counts | Sigma | Mean | Median | Sigma |
| A | 13 | 254 | 9959 | 54.21 | 843 | 826 | 168.5 |
| A | 3 | 137 | 7684 | 40.71 | 843 | 826 | 168.5 |
| A | 0 | 226 | 7306 | 38.47 | 843 | 826 | 168.5 |
| B | 7 | 205 | 71859 | 453.45 | 826 | 806 | 156.7 |
| B | 12 | 111 | 18979 | 115.98 | 826 | 806 | 156.7 |
| B | 11 | 111 | 17176 | 104.47 | 826 | 806 | 156.7 |
| C | 2 | 16 | 783814 | 4263.94 | 787 | 792 | 183.6 |
| C | 14 | 238 | 125941 | 681.5 | 787 | 792 | 183.6 |
| C | 10 | 22 | 9468 | 47.25 | 787 | 792 | 183.6 |
| D | 1 | 52 | 828749 | 4292.18 | 812 | 791 | 192.9 |
| D | 12 | 227 | 184543 | 952.58 | 812 | 791 | 192.9 |
| D | 2 | 250 | 164155 | 846.89 | 812 | 791 | 192.9 |
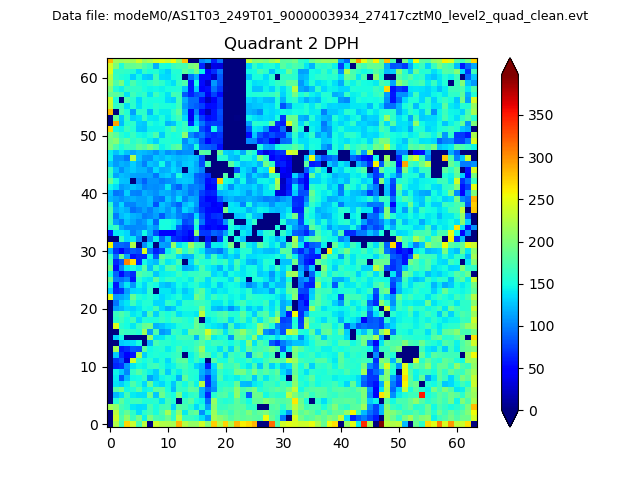
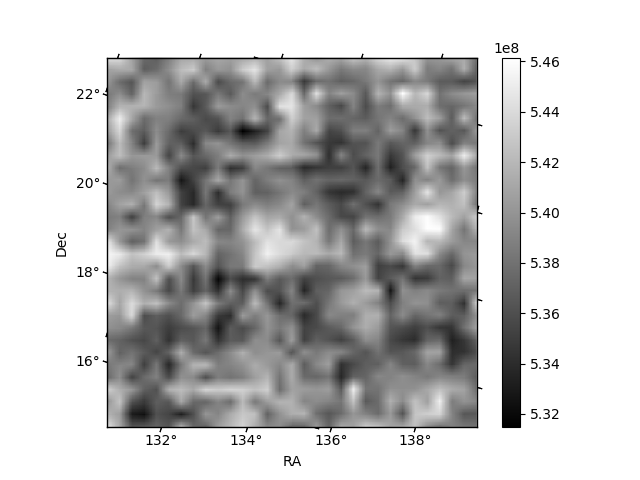
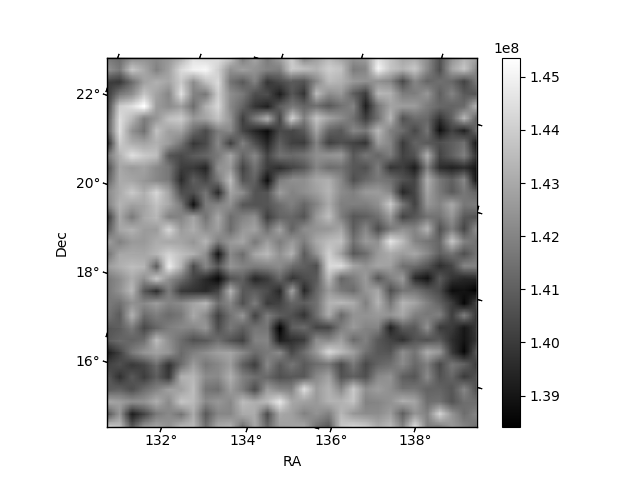
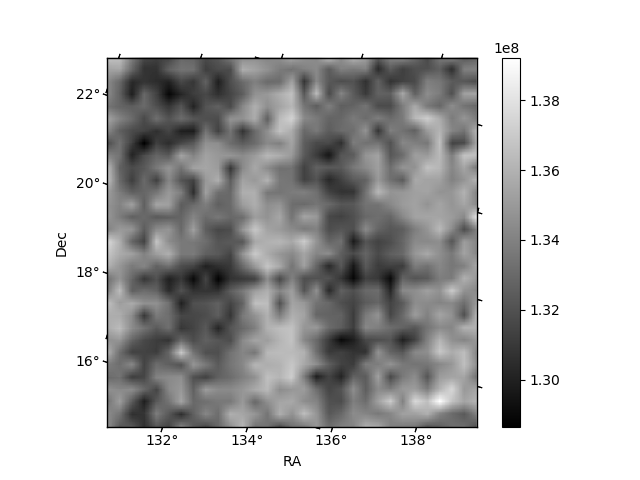
Histogram calculated using DETX and DETY for each event in the final _common_clean file
| Quadrant A | 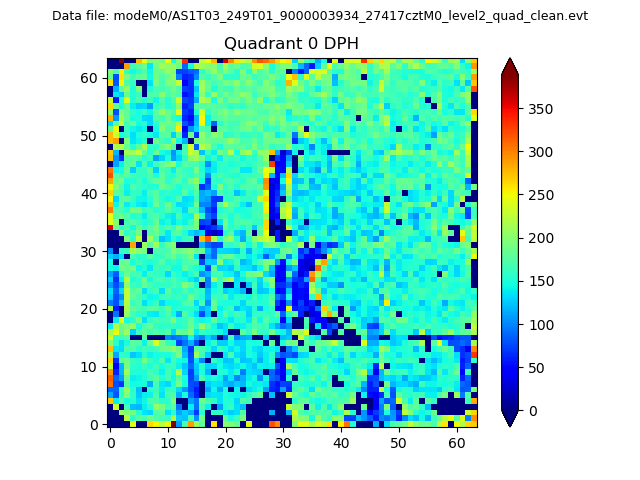 |
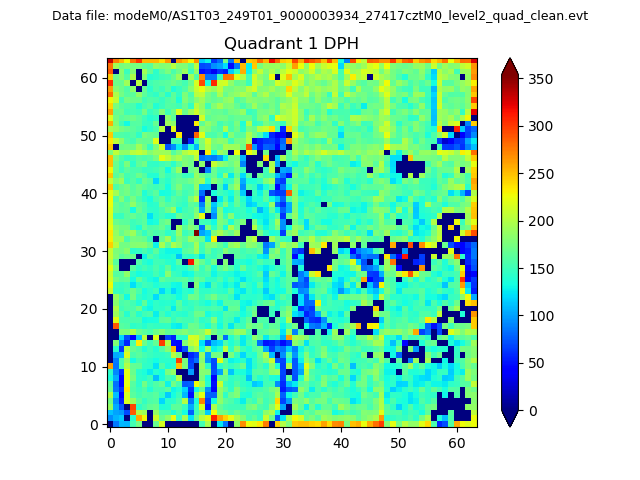 |
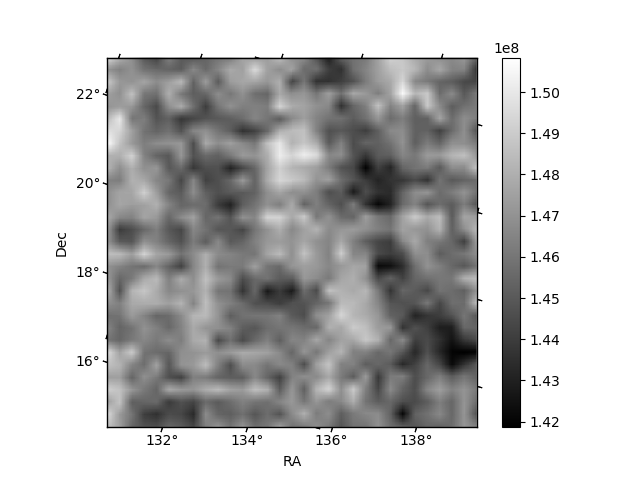
Quadrant B |
|---|---|---|---|
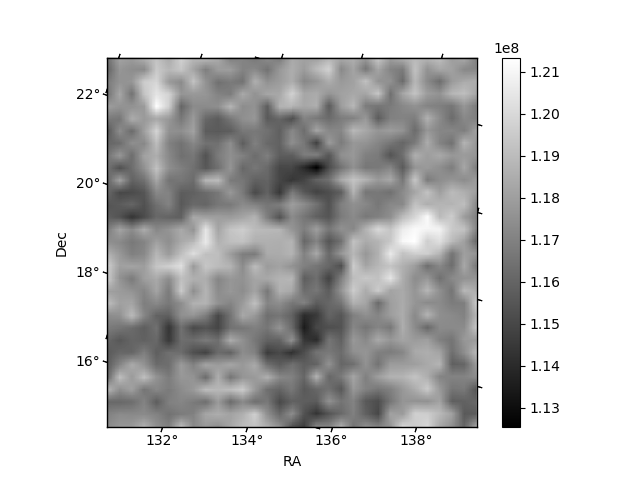
| Quadrant D | 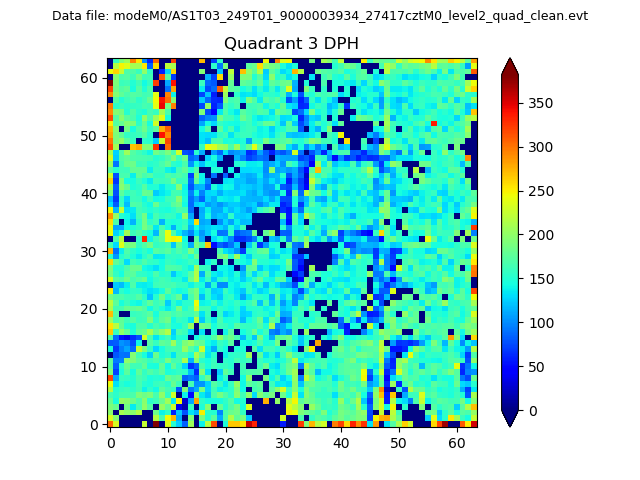 |
 |
Quadrant C |
| Plot type | Count rate plots | Images |
|---|---|---|
| Comparison with Poisson distribution Blue bars denote a histogram of data divided into 1 sec bins. Red curve is a Poisson curve with rate = median count rate of data. |
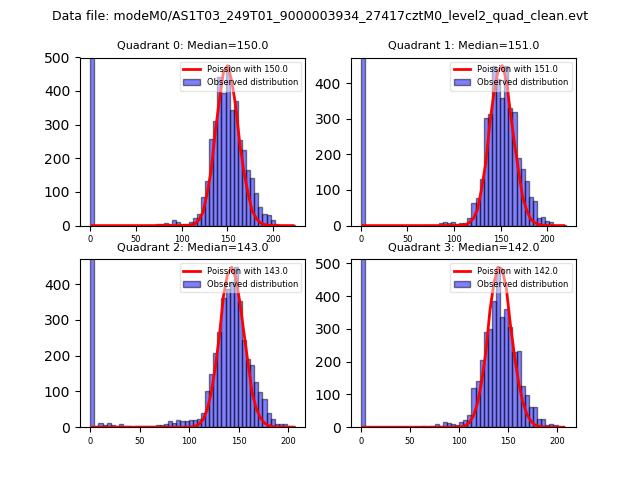 |
 |
| Quadrant-wise count rates Data is divided into 100 sec bins |
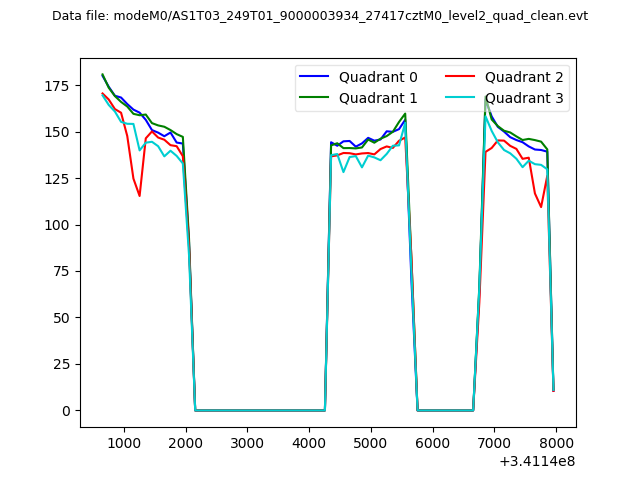 |
|
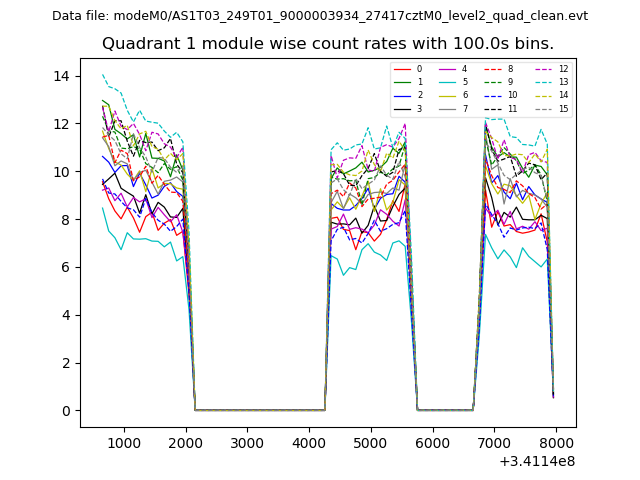
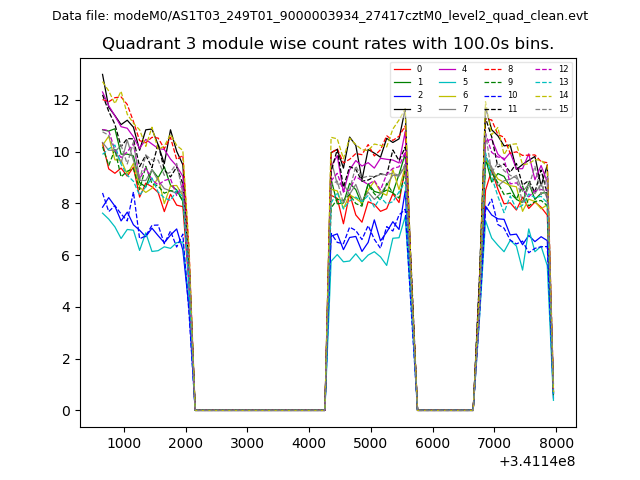
| Module-wise count rates for Quadrant A Data is divided into 100 sec bins |
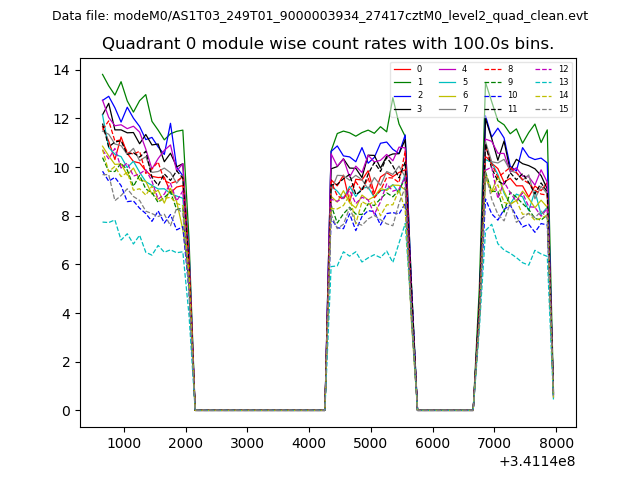 |
 |
| Module-wise count rates for Quadrant B Data is divided into 100 sec bins |
 |
 |
| Module-wise count rates for Quadrant C Data is divided into 100 sec bins |
 |
 |
| Module-wise count rates for Quadrant D Data is divided into 100 sec bins |
 |
 |
| Parameter | Plot |
|---|---|
| CZT HV Monitor |  |
| D_VDD | 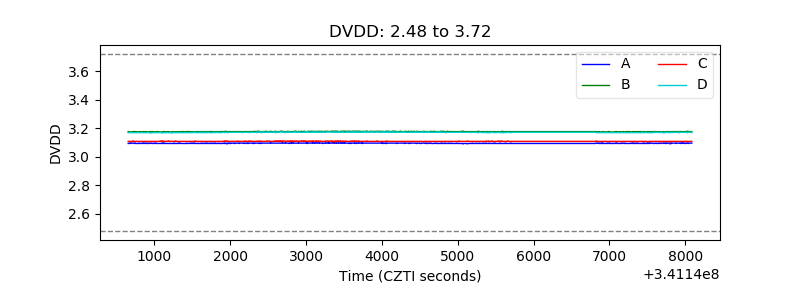 |
| Temperature 1 |  |
| Veto HV Monitor | 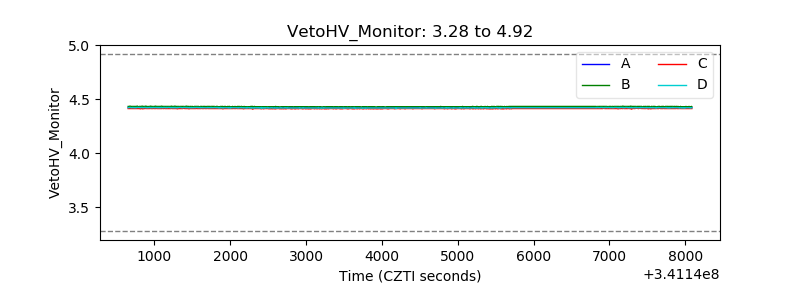 |
| Veto LLD | 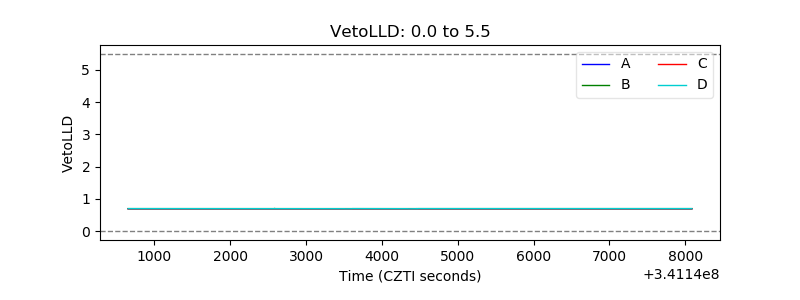 |
| Alpha Counter | 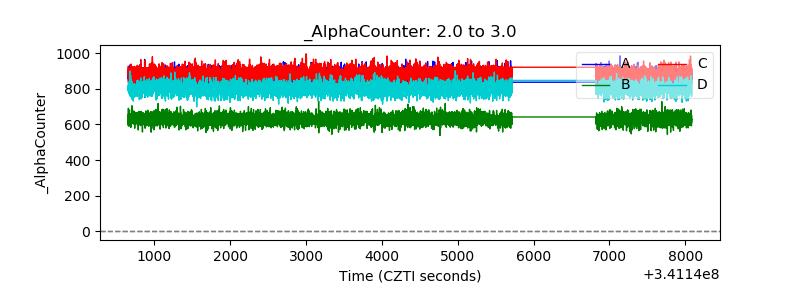 |
| _CPM_Rate | 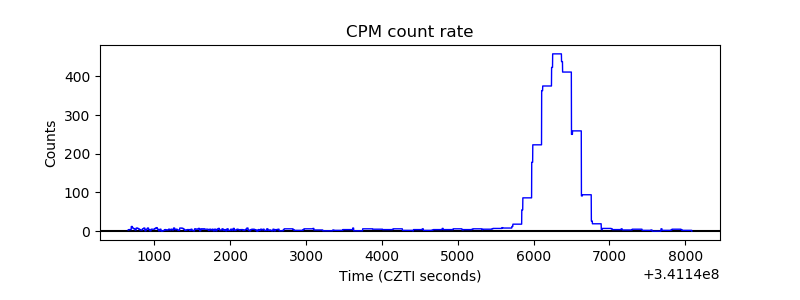 |
| CZT Counter | 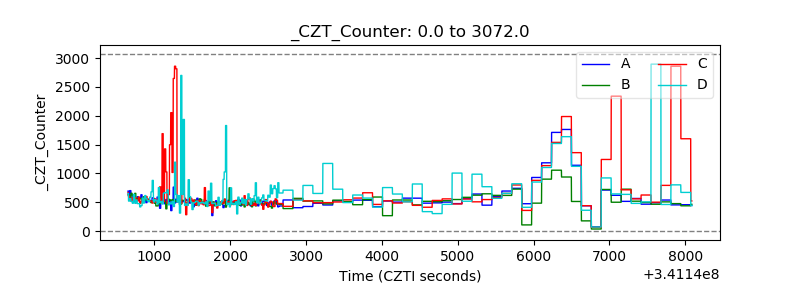 |
| +2.5 Volts monitor |  |
| +5 Volts monitor |  |
| _ROLL_ROT | 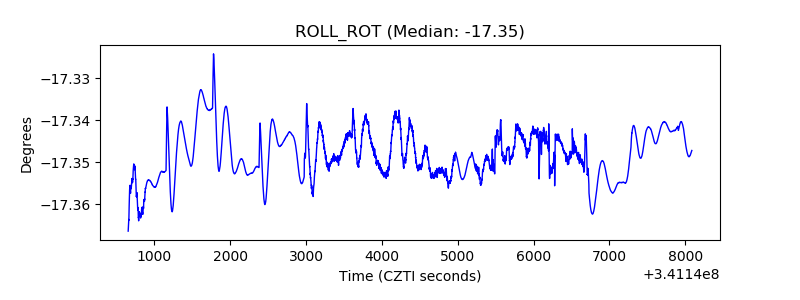 |
| _Roll_DEC | 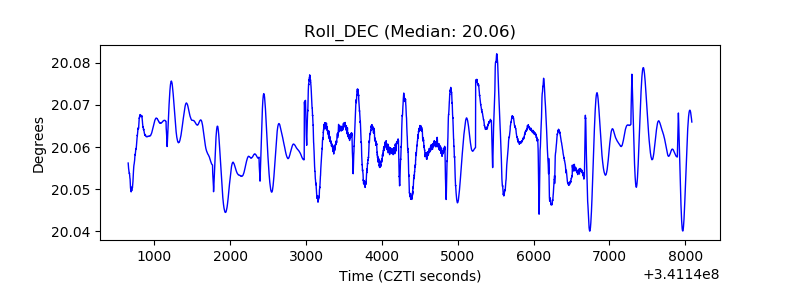 |
| _Roll_RA | 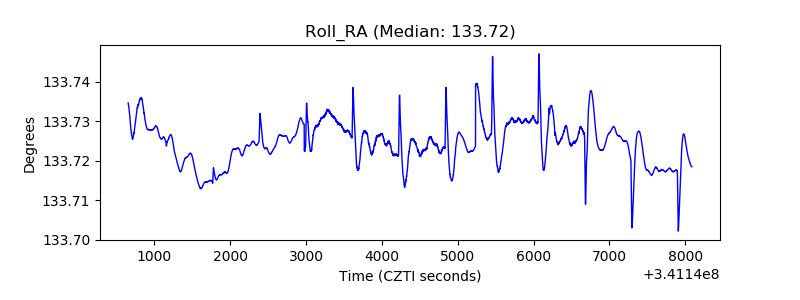 |
| Veto Counter | 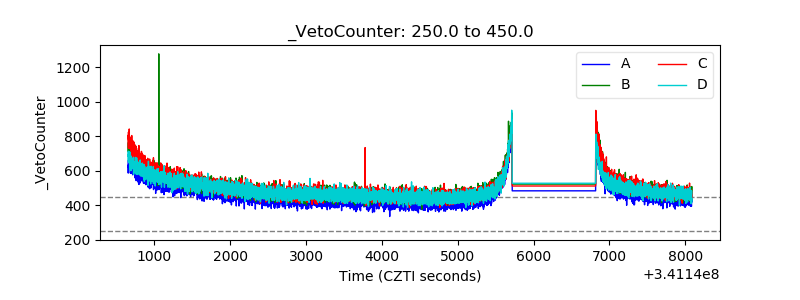 |