| Param | Original file | Final file |
|---|---|---|
| Filename | modeM0/AS1T03_249T01_9000003934_27418cztM0_level2.evt | modeM0/AS1T03_249T01_9000003934_27418cztM0_level2_quad_clean.evt |
| Size (bytes) | 533,551,680 | 85,942,080 |
| Size | 508.8 MB | 82.0 MB |
| Events in quadrant A | 3,375,228 | 549,006 |
| Events in quadrant B | 3,506,726 | 553,016 |
| Events in quadrant C | 3,740,917 | 519,127 |
| Events in quadrant D | 5,077,285 | 510,283 |
| Mode M0 | |||
|---|---|---|---|
| Quadrant | BADHDUFLAG | Total packets | Discarded packets |
| A | 0 | 13969 | 0 |
| B | 0 | 14373 | 0 |
| C | 0 | 15134 | 0 |
| D | 0 | 19596 | 0 |
| Mode M9 | |||
|---|---|---|---|
| Quadrant | BADHDUFLAG | Total packets | Discarded packets |
| A | 0 | 8 | 0 |
| B | 0 | 8 | 0 |
| C | 0 | 8 | 0 |
| D | 0 | 8 | 0 |
| Quadrant | Total seconds | Saturated seconds | Saturation percentage |
|---|---|---|---|
| A | 6761 | 130 | 1.922792% |
| B | 6761 | 155 | 2.292560% |
| C | 6761 | 250 | 3.697678% |
| D | 6760 | 313 | 4.630178% |
Noise dominated data is calculated using 1-second bins in cleaned event files. If a bin has >2000 counts, and if more than 50% of those come from <1% of pixels, then it is considered to be noise-dominated and hence unusable.
| Quadrant | # 1 sec bins | Bins with >0 counts | Bins with >2000 counts | High rate bins dominated by noise | Noise dominated (total time) | Noise dominated (detector-on time) | Marked lightcurve |
|---|---|---|---|---|---|---|---|
| A | 7556 | 6761 | 0 | 0 | 0.00% | 0.00% | 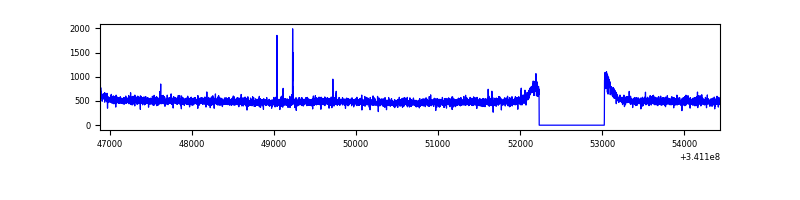 |
| B | 7556 | 6761 | 17 | 17 | 0.22% | 0.25% | 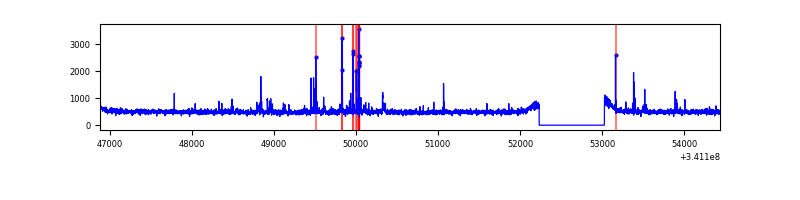 |
| C | 7556 | 6761 | 95 | 95 | 1.26% | 1.41% | 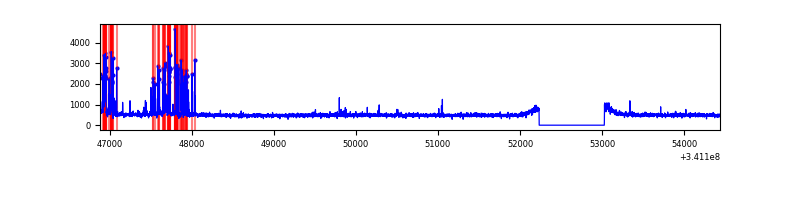 |
| D | 7555 | 6760 | 179 | 179 | 2.37% | 2.65% | 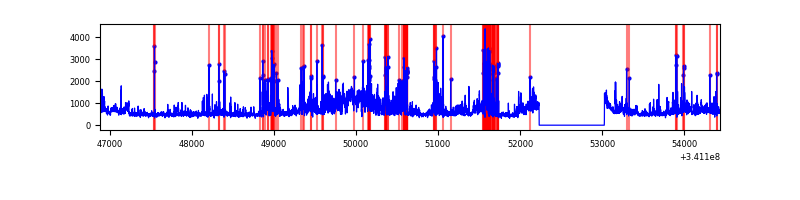 |
Top three noisy pixels from each quadrant. If the there are fewer than three noisy pixels in the level2.evt file, extra rows are filled as -1
| Pixel properties | Quadrant properties | ||||||
|---|---|---|---|---|---|---|---|
| Quadrant | DetID | PixID | Counts | Sigma | Mean | Median | Sigma |
| A | 13 | 254 | 11333 | 59.62 | 870 | 851 | 175.8 |
| A | 3 | 137 | 8101 | 41.24 | 870 | 851 | 175.8 |
| A | 0 | 226 | 7572 | 38.23 | 870 | 851 | 175.8 |
| B | 0 | 190 | 81663 | 497.3 | 851 | 830 | 162.5 |
| B | 4 | 52 | 40242 | 242.47 | 851 | 830 | 162.5 |
| B | 12 | 111 | 19619 | 115.59 | 851 | 830 | 162.5 |
| C | 2 | 16 | 391076 | 2016.39 | 821 | 826 | 193.5 |
| C | 14 | 238 | 129453 | 664.6 | 821 | 826 | 193.5 |
| C | 10 | 22 | 16700 | 82.02 | 821 | 826 | 193.5 |
| D | 1 | 52 | 1620920 | 8164.52 | 832 | 810 | 198.4 |
| D | 2 | 250 | 259062 | 1301.46 | 832 | 810 | 198.4 |
| D | 12 | 227 | 32121 | 157.79 | 832 | 810 | 198.4 |
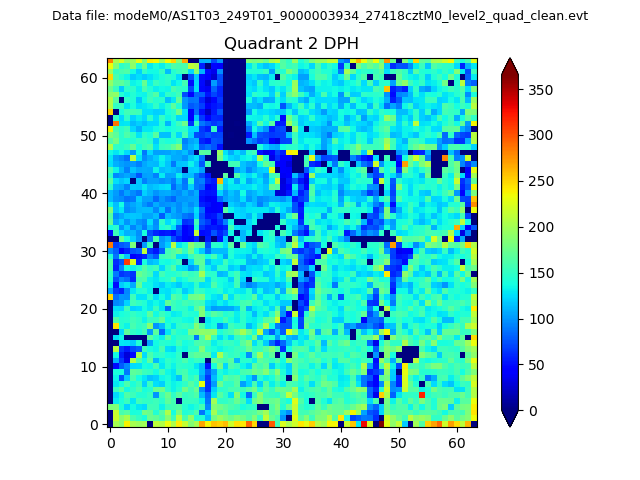
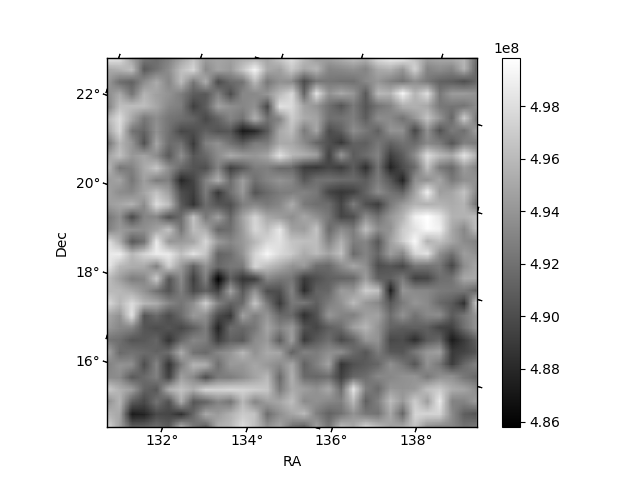
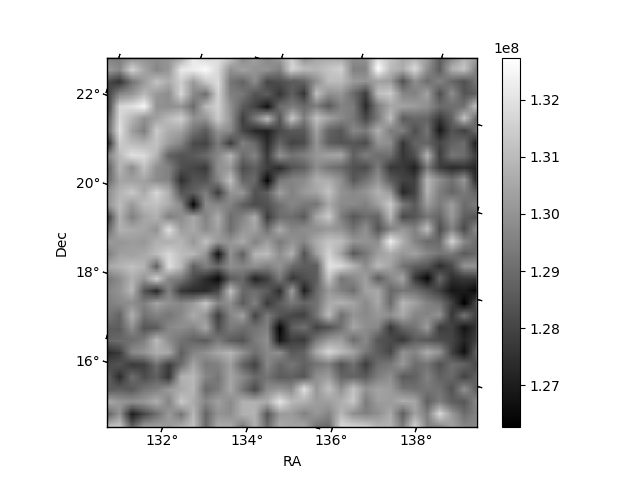
Histogram calculated using DETX and DETY for each event in the final _common_clean file
| Quadrant A | 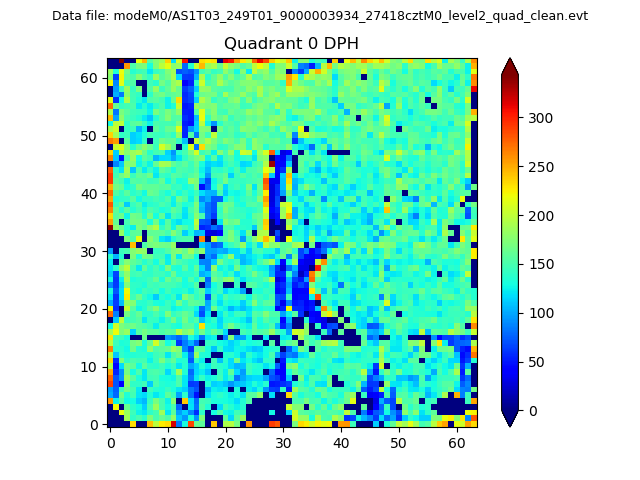 |
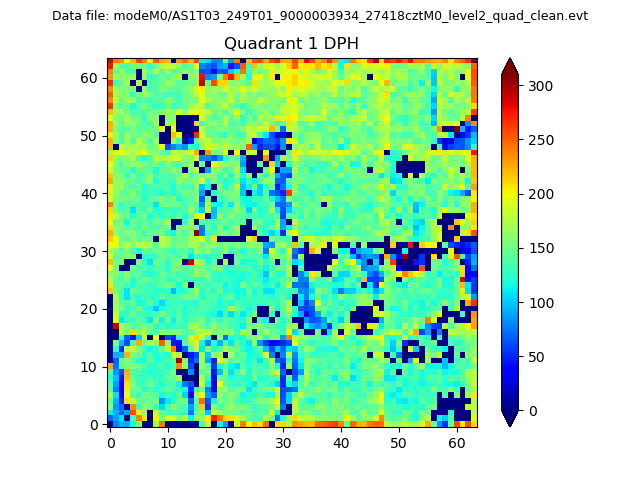 |
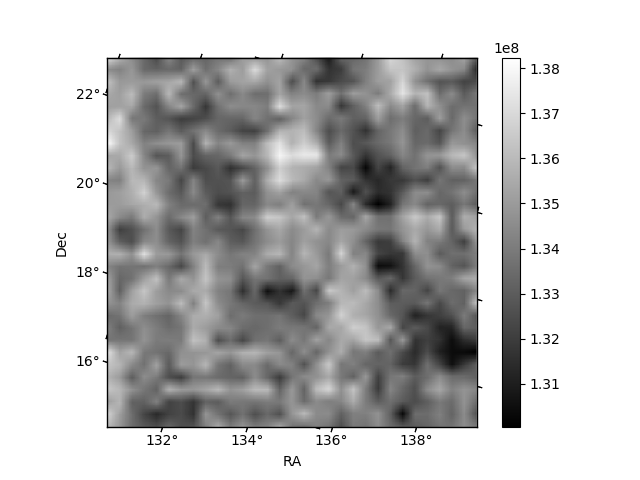
Quadrant B |
|---|---|---|---|
| Quadrant D | 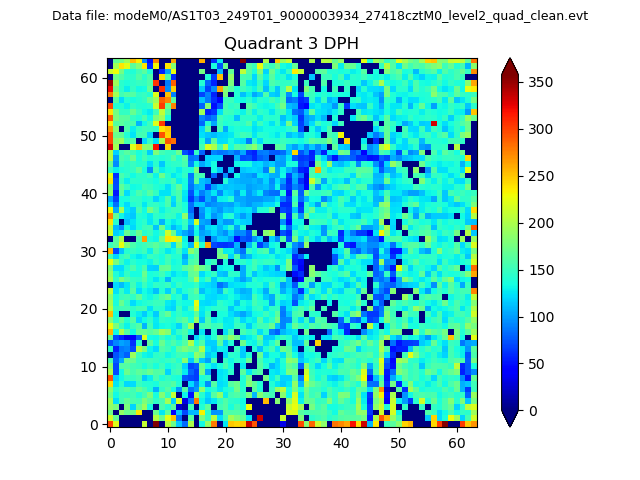 |
 |
Quadrant C |
| Plot type | Count rate plots | Images |
|---|---|---|
| Comparison with Poisson distribution Blue bars denote a histogram of data divided into 1 sec bins. Red curve is a Poisson curve with rate = median count rate of data. |
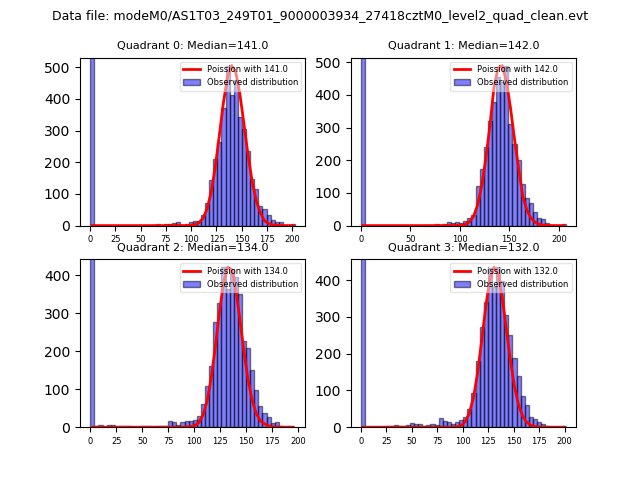 |
 |
| Quadrant-wise count rates Data is divided into 100 sec bins |
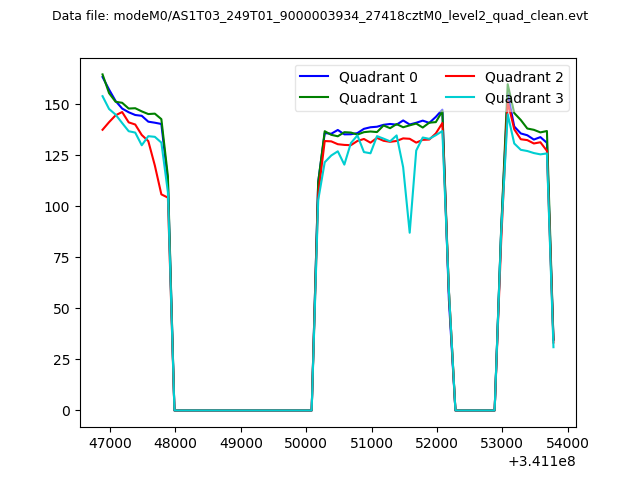 |
|
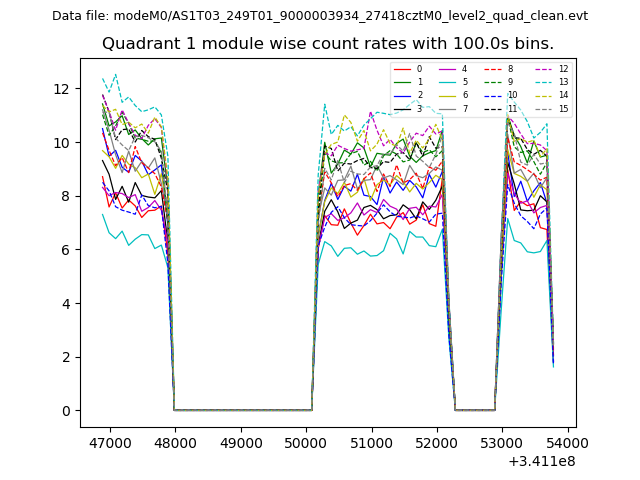
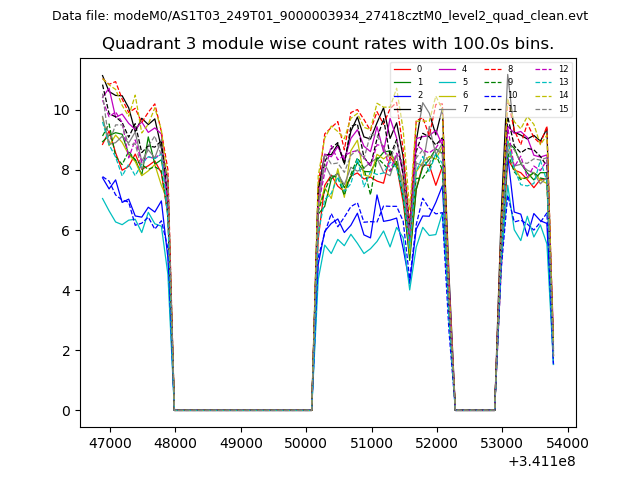
| Module-wise count rates for Quadrant A Data is divided into 100 sec bins |
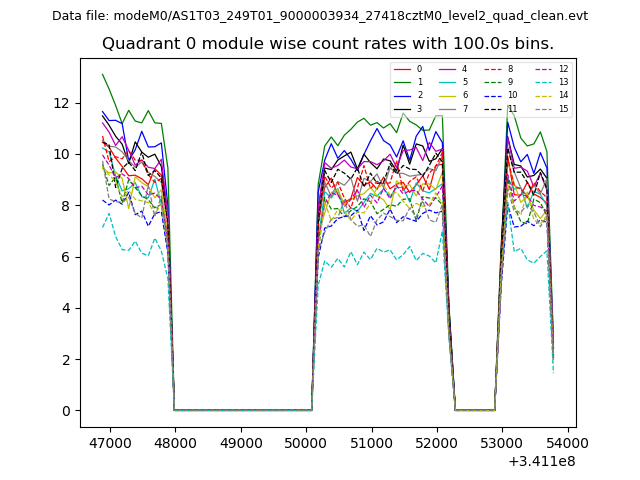 |
 |
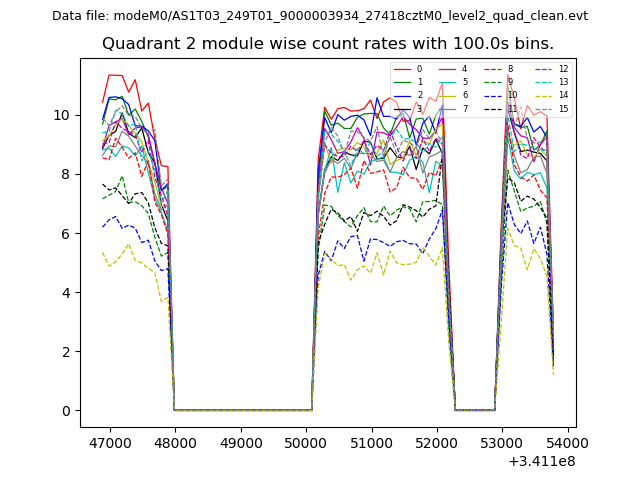
| Module-wise count rates for Quadrant B Data is divided into 100 sec bins |
 |
 |
| Module-wise count rates for Quadrant C Data is divided into 100 sec bins |
 |
 |
| Module-wise count rates for Quadrant D Data is divided into 100 sec bins |
 |
 |
| Parameter | Plot |
|---|---|
| CZT HV Monitor |  |
| D_VDD | 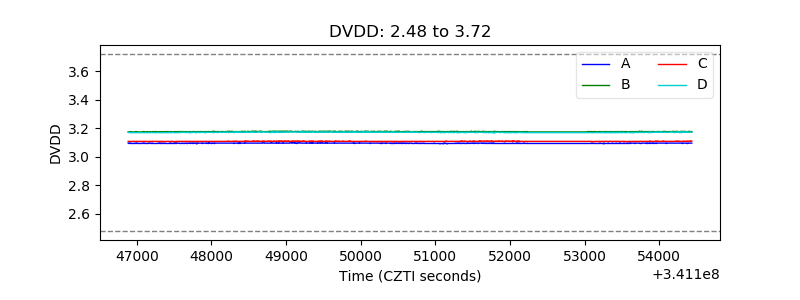 |
| Temperature 1 |  |
| Veto HV Monitor | 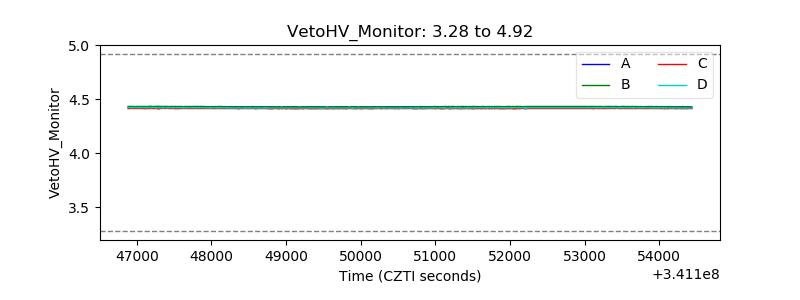 |
| Veto LLD | 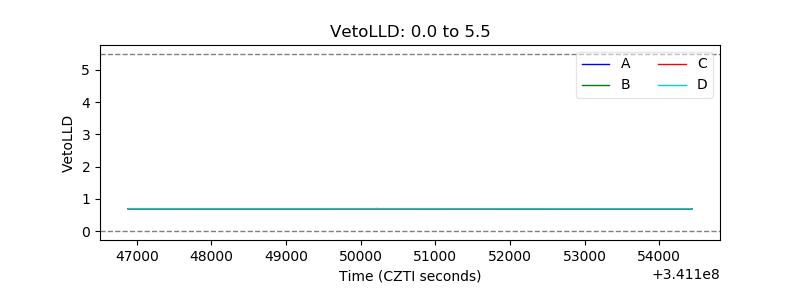 |
| Alpha Counter |  |
| _CPM_Rate | 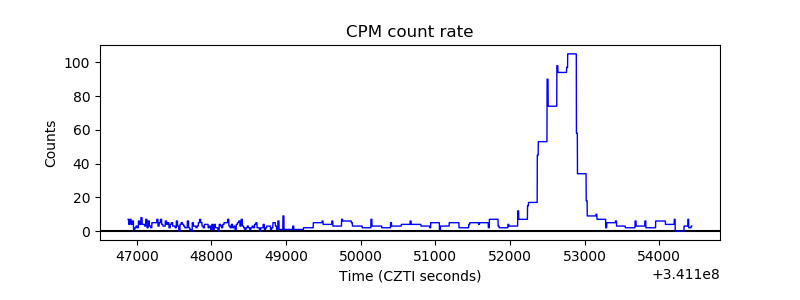 |
| CZT Counter |  |
| +2.5 Volts monitor |  |
| +5 Volts monitor | 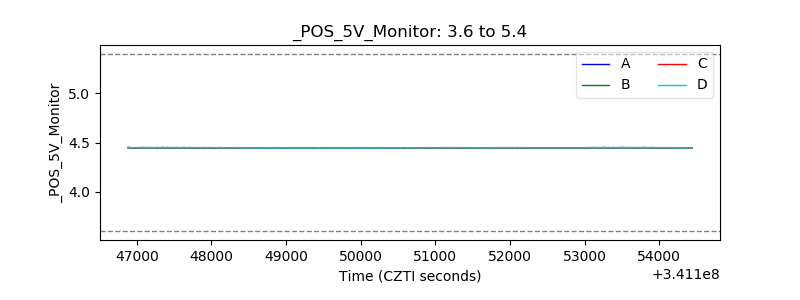 |
| _ROLL_ROT | 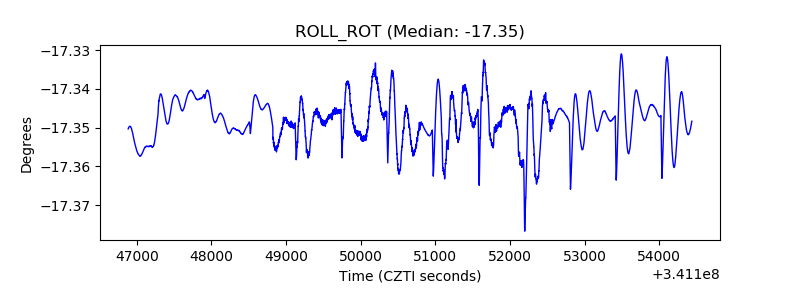 |
| _Roll_DEC | 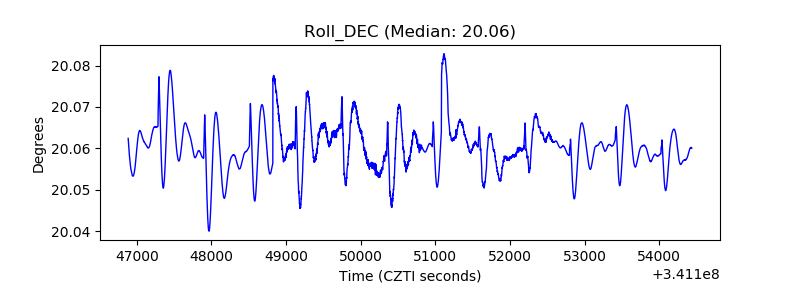 |
| _Roll_RA | 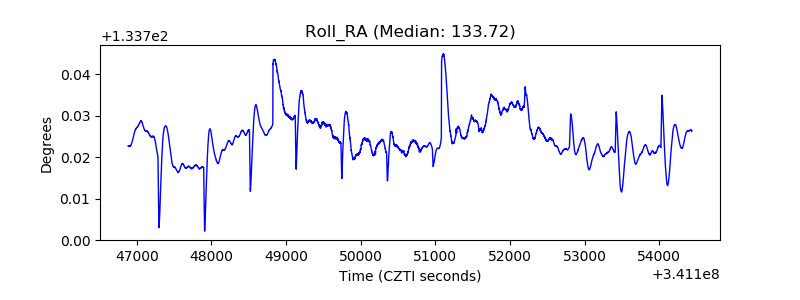 |
| Veto Counter | 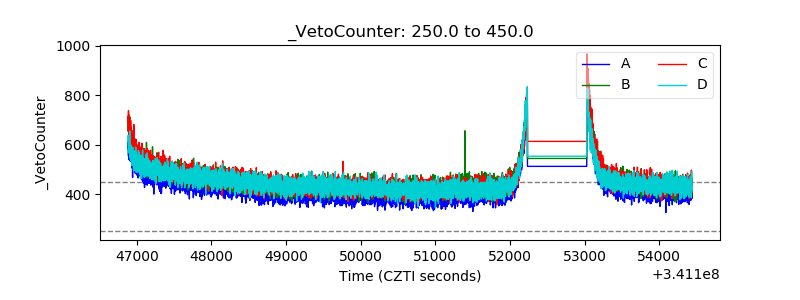 |